In this post, I’d like to take a brief look at the Query Performance Insight — SQL Azure tool which will help you to identify the most expensive queries in your database.
Query Performance Insights was announced in early October 2015. To understand what it is, let’s think about how do you usually learn that the database performance got down? Probably, you are receiving emails from your clients or it takes an hour to create a weekly report instead of a several minutes, or maybe, your application starts throwing exceptions.
New Azure Portal
To take some actions, you are visiting portal.azure.com, find your database in a resources list and start watching Monitoring chart:
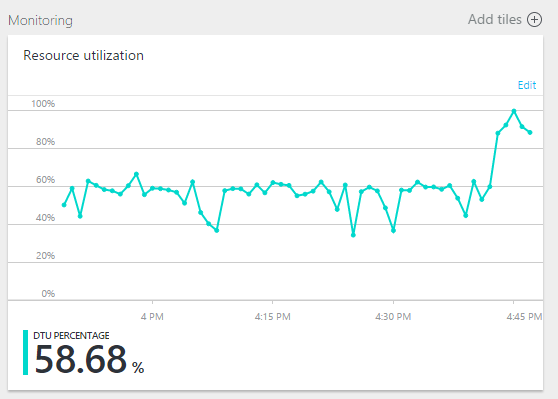
Yes, something happened, DTU jumped to 90%, what’s next? To look deeper and find the culprit, let’s load the Query Performance Insight.
Query Performance Insight
To start Query Performance Insight, do the following:
1. In the portal, browse to an SQL database and click Query Performance Insight.
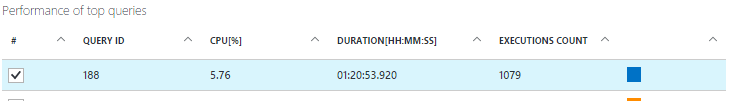
2. Look at the chart for details.
The top line shows overall DTU% for the database, while the bars show CPU% consumed by the selected queries during the selected interval (for example, if Past week is selected each bar represents 1 day).
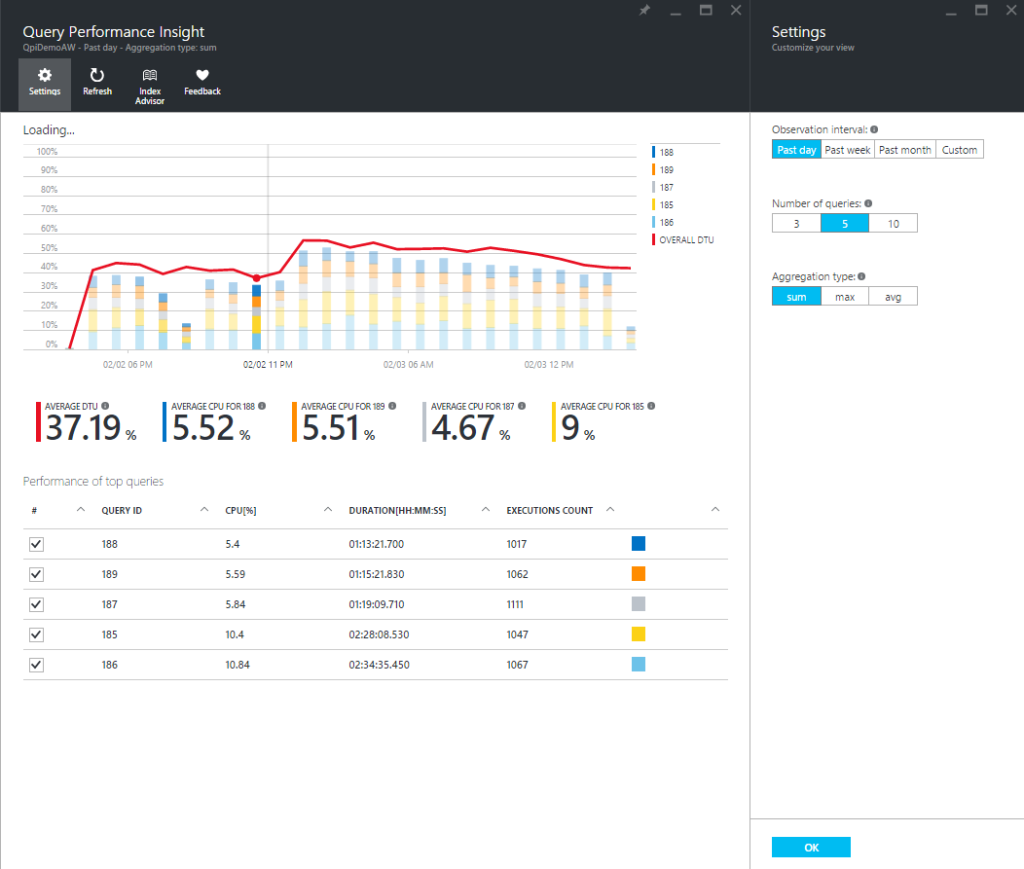
The bottom grid represents aggregated information for the visible queries.
- Average CPU per query during observable interval.
- Total duration per query.
- Total number of executions for a particular query.
Select or clear individual queries to include or exclude them from the chart.
3. You can click the Refresh button, in the case of stale data.
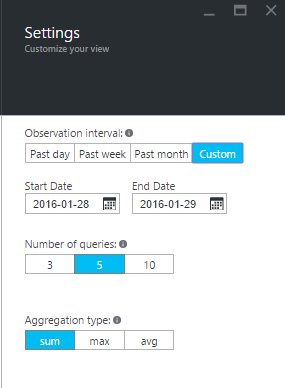
4. To customize the representation of how CPU consume data, or to show a different time period, click Settings.
Exploring individual query details
Let’s open the query that used the largest quantity of CPUS. To view query details:
1. Click any query in the list of top queries.
The details view opens and the queries CPU consumption is broken down over time. We can view the chart for details. The top line is overall DTU%, and the bars are CPU% consumed by the selected query.
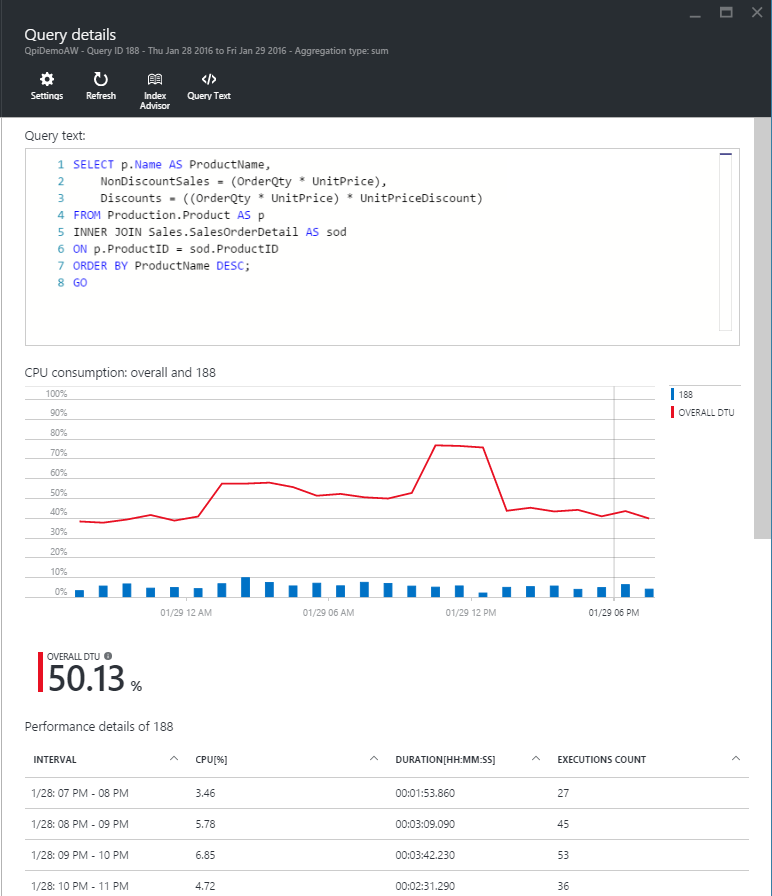
2. Analyze the data to get detailed metrics including duration, a number of executions, and resource utilization percentage for each interval the query was running.
Optimizing the Query Store configuration for Query Performance Insight
While using Query Performance Insight, you may see the following Query Store messages:
- “Query store has reached its capacity and not collecting new data.”
- “Query Store for this database is in read-only mode and not collecting performance insights data.”
- “Query Store parameters are not optimally set for Query Performance Insight.”
They basically appear when Query Store is unable to gather new data. To repair, you can use the following options:
- Change the Retention and Capture policy of Query Store
- Increase size of Query Store
- Clear Query Store
- Recommended
Recommended retention and capture policy
There are two types of retention policies:
Size based – AUTO will clean data automatically upon reaching max size.
Time based – The default value is 30 days. Once Query Store will run out of space, it will delete query information older than 30 days.
Capture policy could be set to:
All – The default option (captures all queries).
Auto – Infrequent queries and queries with insignificant compile and execution duration are ignored. Thresholds for execution count, compile, and runtime duration are internally determined.
None – Query Store stops capturing new queries.
Summary
Query Performance Insight allows you to analyze and understand the impact of your query workload and how it relates to database resource consumption. Utilizing this tool, you will learn about the top consuming queries, and easily identify the ones to fix before they become a problem.
Further Reading:
Query Store: A flight data recorder for your database
Tags: azure sql, performance, query performance Last modified: September 23, 2021