In today’s world, it is not enough to simply analyze data, create reports or develop business intelligence projects. To discover the power of data, we have to modify data on machine learning models and to predict future.
In this article, we will discuss one of the simplest methods, a linear regression, that we are going to modify statically in Azure Machine Learning.
What is linear regression?
The linear regression is a statistical method that summarizes the relationship between two quantitative data and defines uncertain relationships between two variables.
y = a.x +b – This equation defines a linear regression,
where y is a dependent variable, x is an independent variable, and b is a constant.
In the real world, the data will not fit this equation. Linear regression equation tries to predict the approximate relationship between the dependent and independent variables.
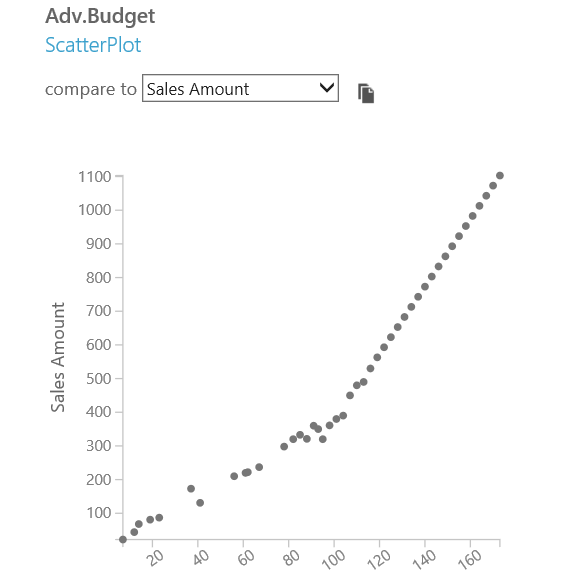
Let’s look at the chart below.
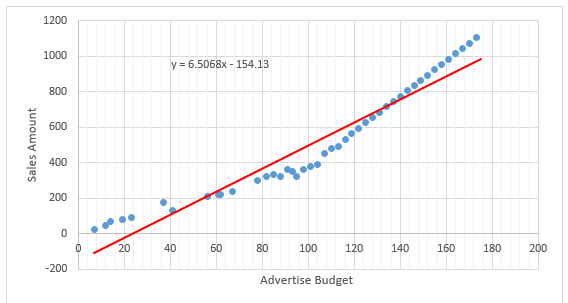
Blue dots define real data, while a red line defines a linear regression equation, which shows that the amount of sale is very highly correlated with the advertising budget. However, the red line is not able to determine exact values.
What is Machine Learning and Azure Machine Learning?
Machine Learning is the paradigm of the method retrieved from the analyzed and estimated data in your computer as a result of the mathematical and statistical methods.
Azure Machine Learning is a technology based on the information you have learnt from the machine (computer). Analyzing the information gives you an ability to ensure your power of predicting.
Suppose that you have a team data, according to which you have to make some decisions. For this, experienced workers developed algorithms. To be able to calculate them, you need a powerful computer. Instead, you can use Azure Machine Learning, a platform, where you can ensure the possibility of making calculations and estimations in a very simple way.
Microsoft Azure Machine Learning Studio is an IDE used for your estimated data that must be treated as a prediction with the purpose of analysis, testing, and distribution.
In the advanced type of this column, we will explain how to model Linear Regression with Azure Machine Learning Studio on a simple example. We will not pay much attention to static concepts.
In the example, we will search the creation or non-creation of relationships between the advertising budget and sales amount, as well as analyze with Linear Regression whether the relationship is strong or not.
Requirements
- Azure Machine Learning Studio account (you can create a free account for limited time on Azure).
- Sample csv data.
Example:
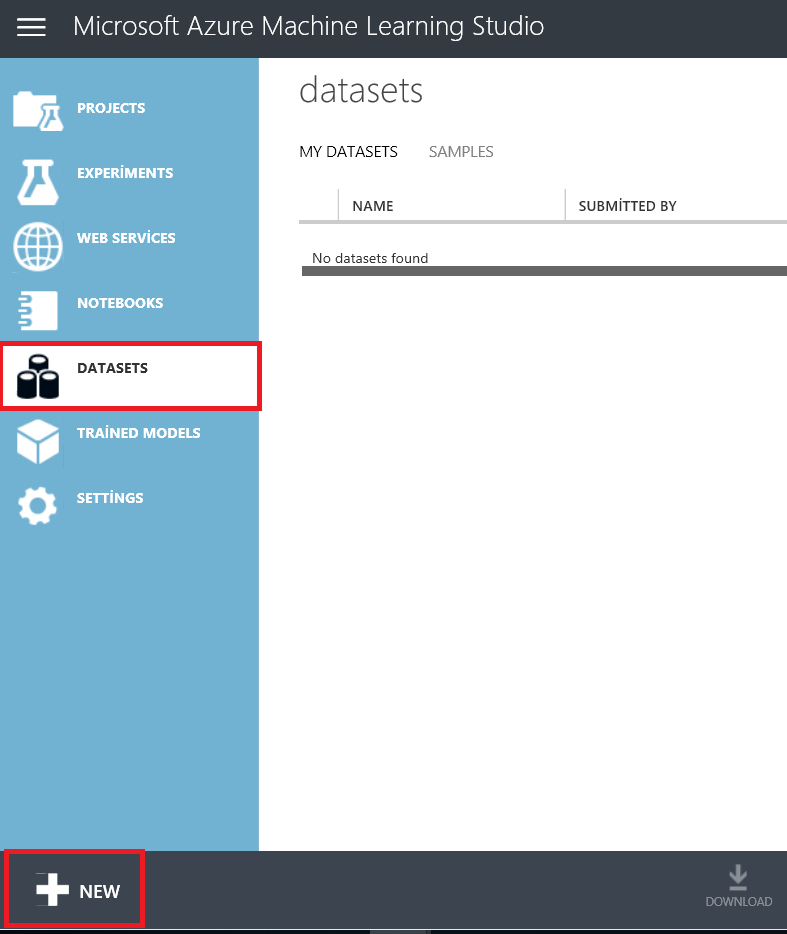
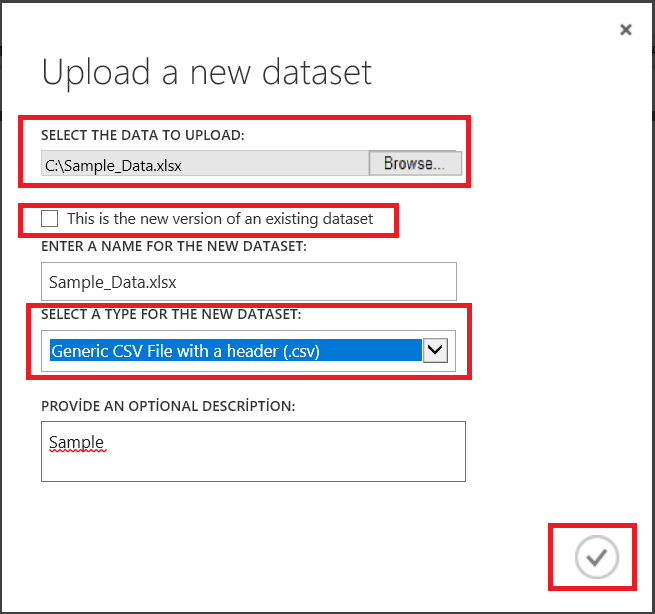
Log into Azure Machine Learning Studio. For our experiment, we will need a dataset. Go to the Datasets tab and add a new one.
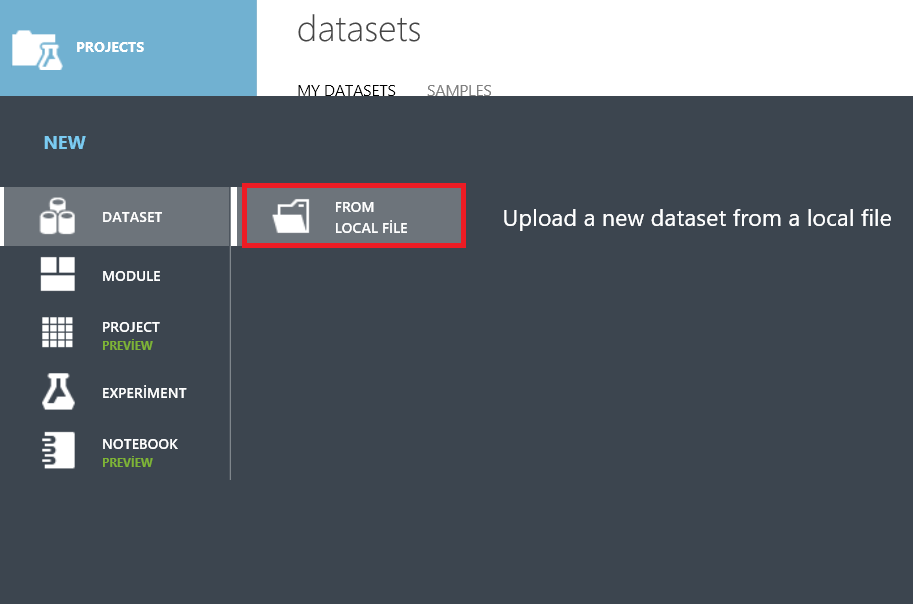
Browse the files from the computer and upload our Excel or CSV file to Azure Machine Learning storage. We are going to use this dataset as a training model in our project.
Then, select Excel dataset and enter a dataset name. If you want to replace your dataset with a new one, you have to check the box “This is the new version of an existing dataset” and select a deprecated dataset.
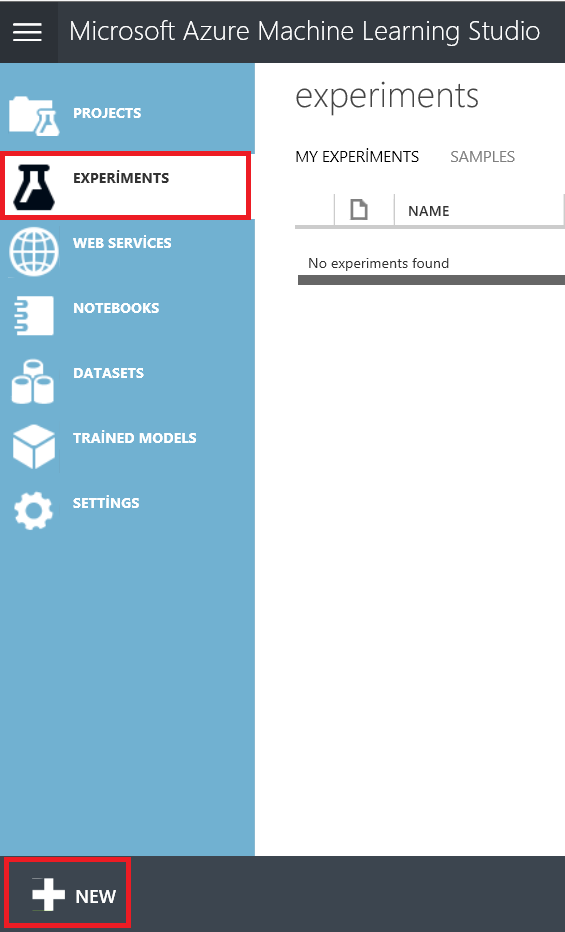
As you can see, we have successfully uploaded the dataset. After this, select the Experiments tab and add a new experiment.
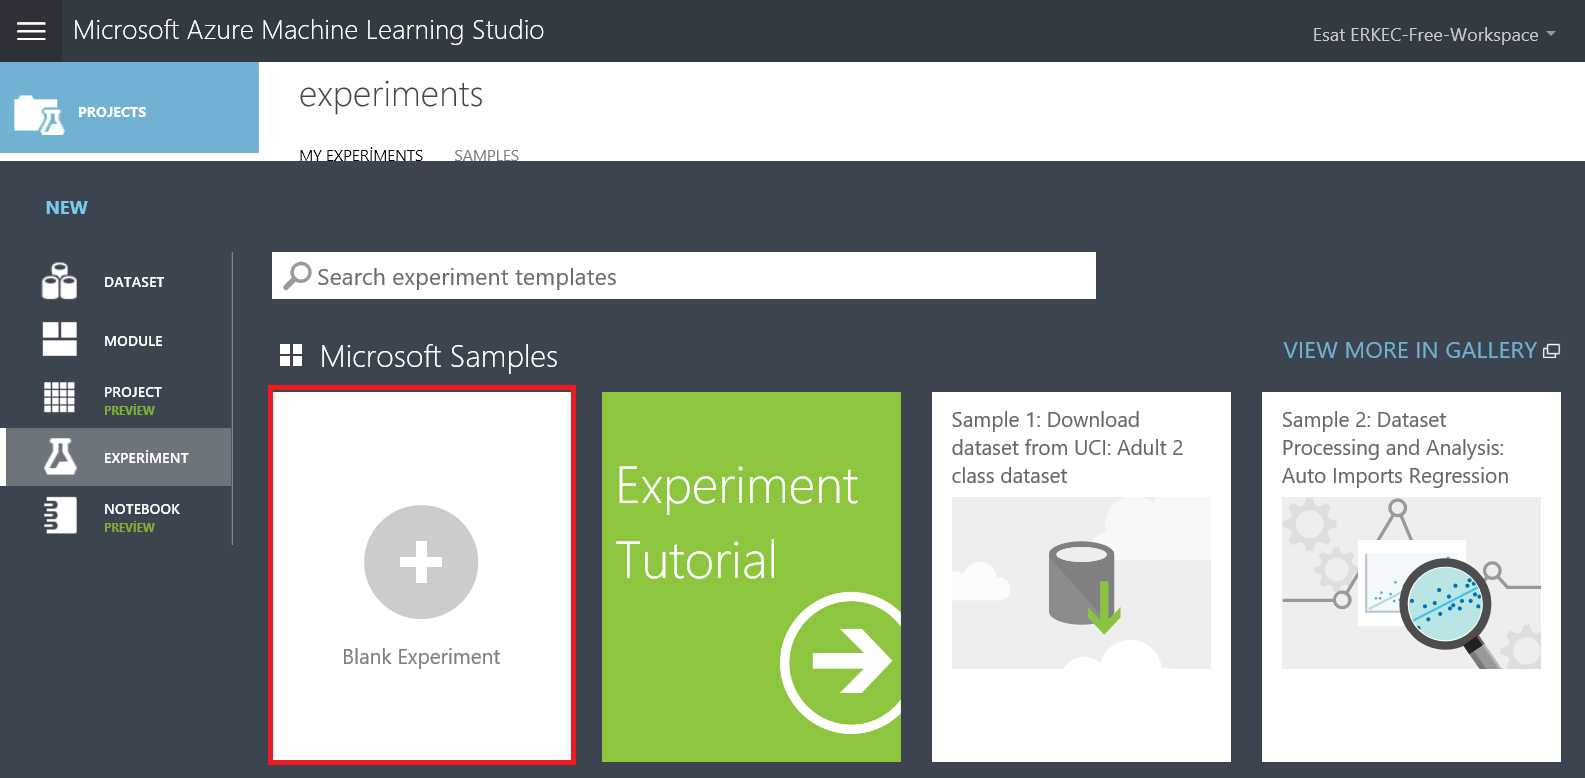
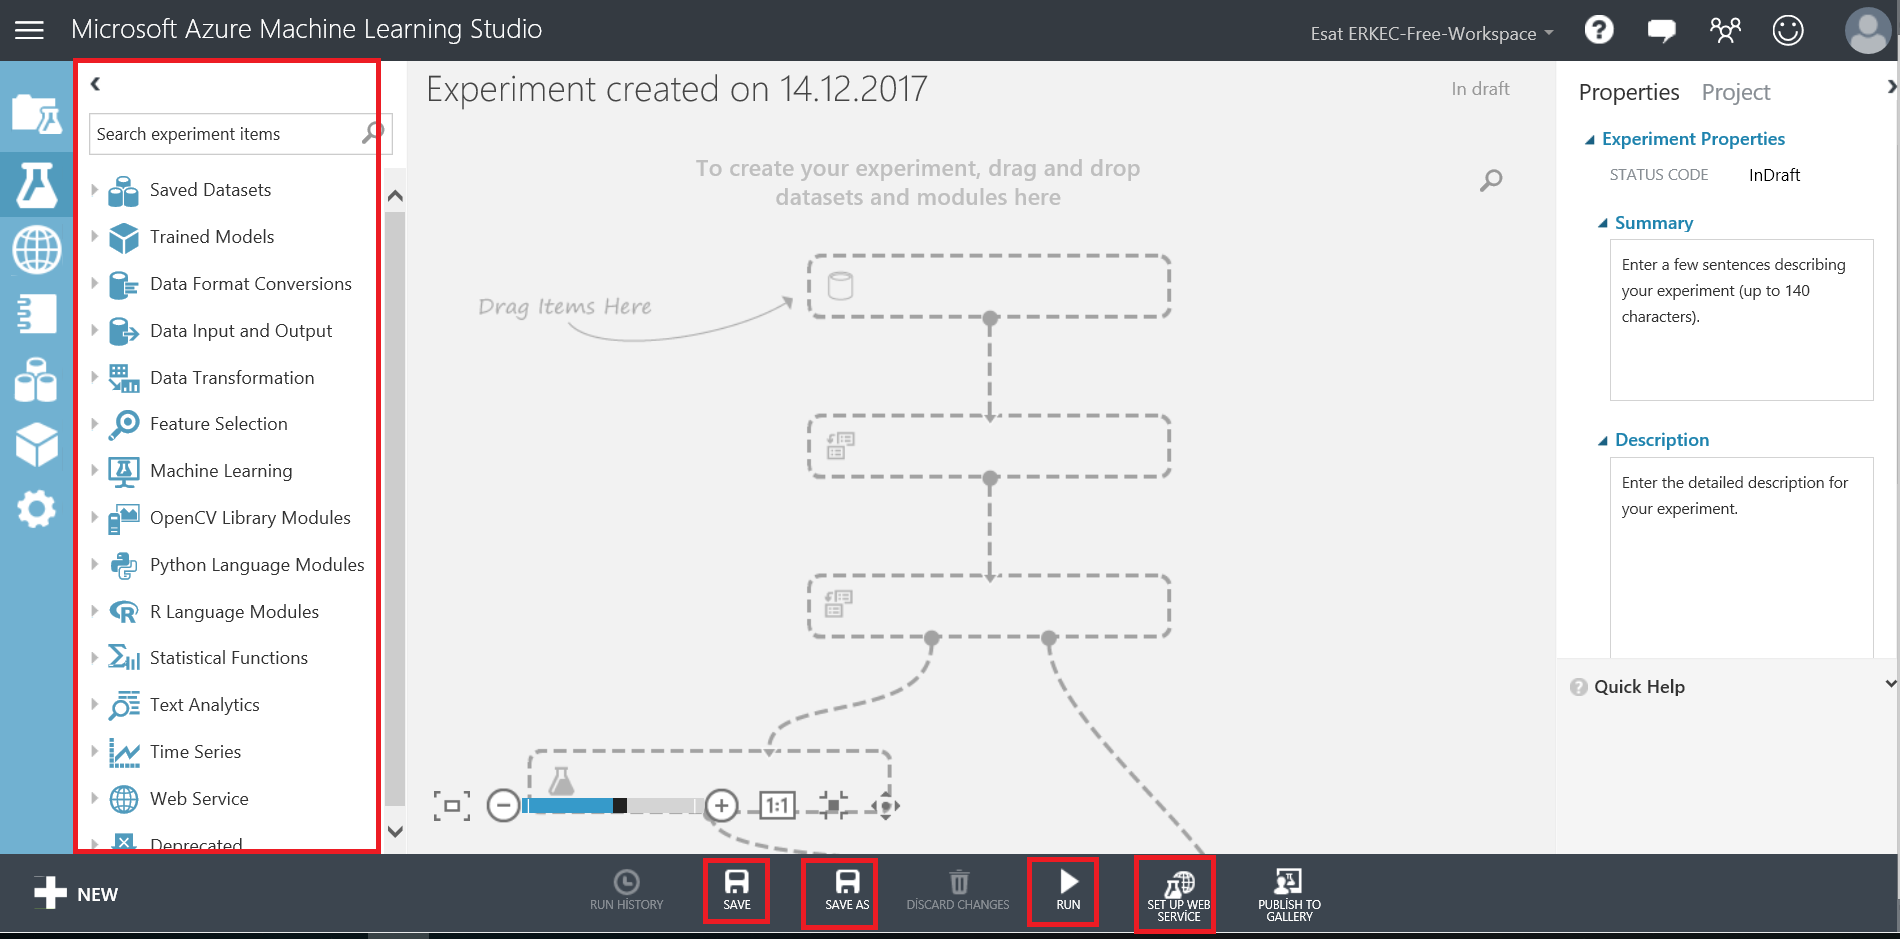
Azure Machine Learning Studio opens. In the window that appears, we can find the development environment. On the left side of the window, there are a lot of components which help us to develop a machine learning project. In addition, we can drag and drop these components. At the same time, we can see some data transformation and conversion components that help us to manipulate a dataset.
Azure Machine Learning Studio offers a sample dataset under the Saved Datasets tab that we can use for training and tests. Azure Machine Learning Studio provides datasets for Python and R script. After this, we will use this screen to create a linear regression model. At the bottom of the window, we can find such buttons as Save, Save as, Run, and Set up web service.
Now, add our dataset which we have just uploaded and get some details about these features.
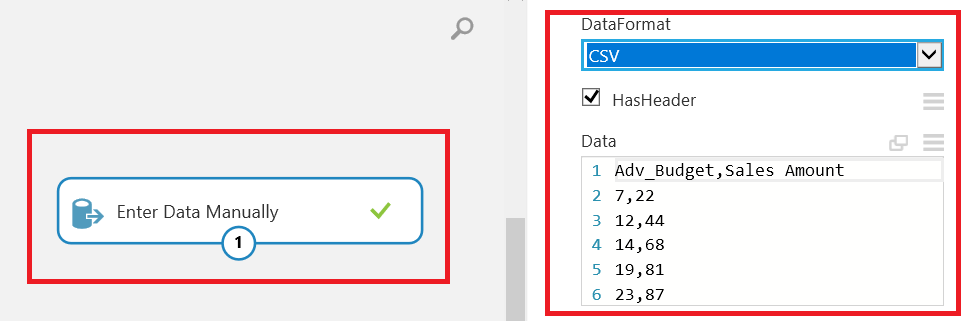
Drag and drop Sample_Data.csv and visualize a dataset. Instead of uploading data, we can manually add our dataset.
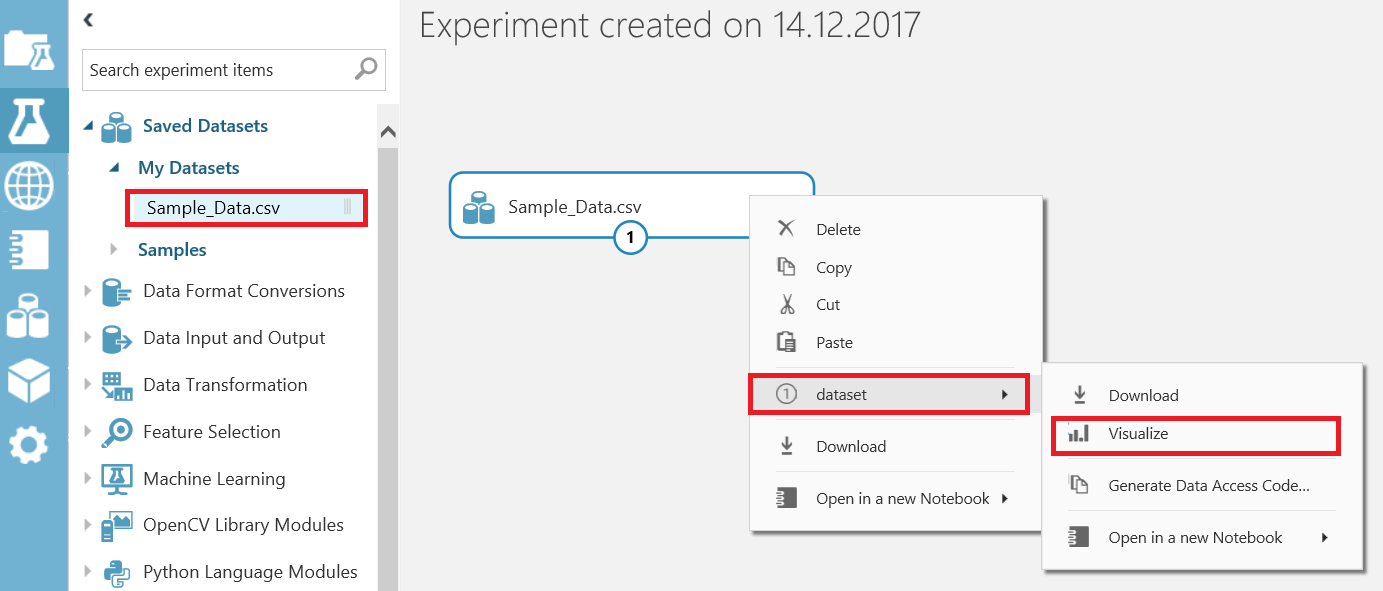
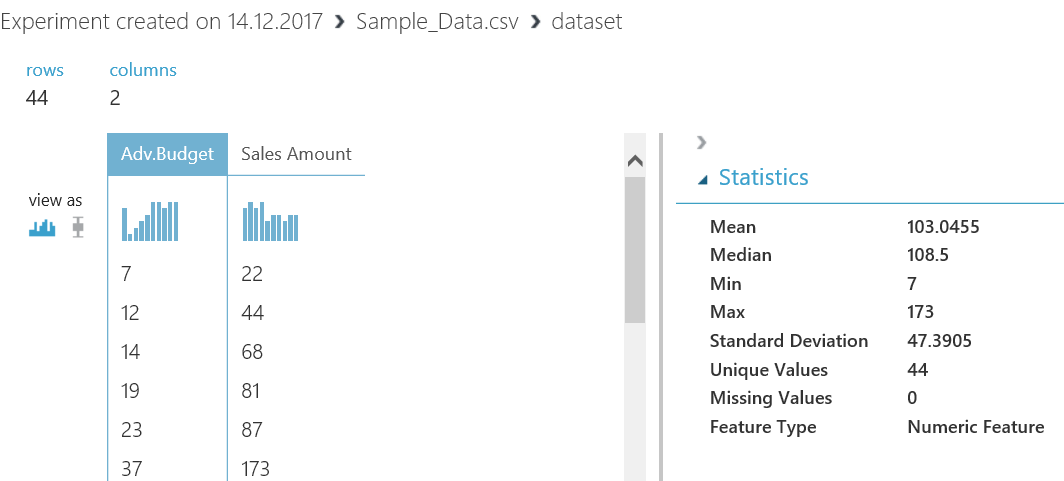
In the Visualization window, we can get dataset values and basic statistical information about columns and compare them to charts.
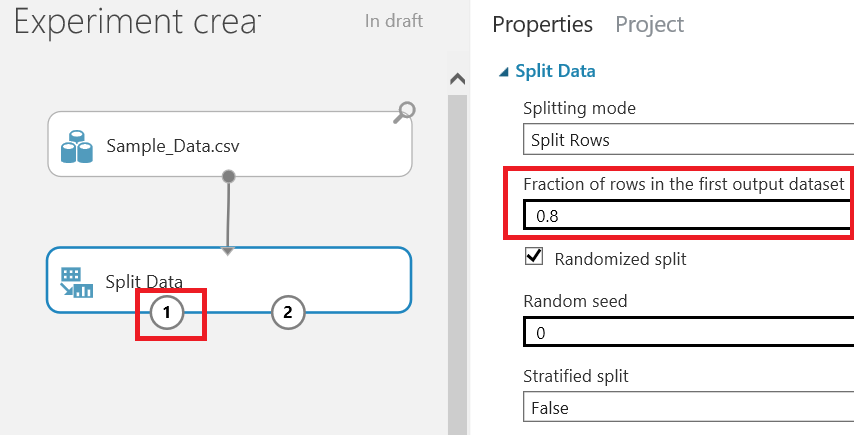
In this step, we will add the Split Data component that divides the dataset into two parts.
This component is commonly used for the separate dataset for training and testing. The “Fraction of rows in the first output dataset” value sets the percentage of the ratio for the first output. We will set it to 0.8 because we will use 80% of data for training and 20% for testing.
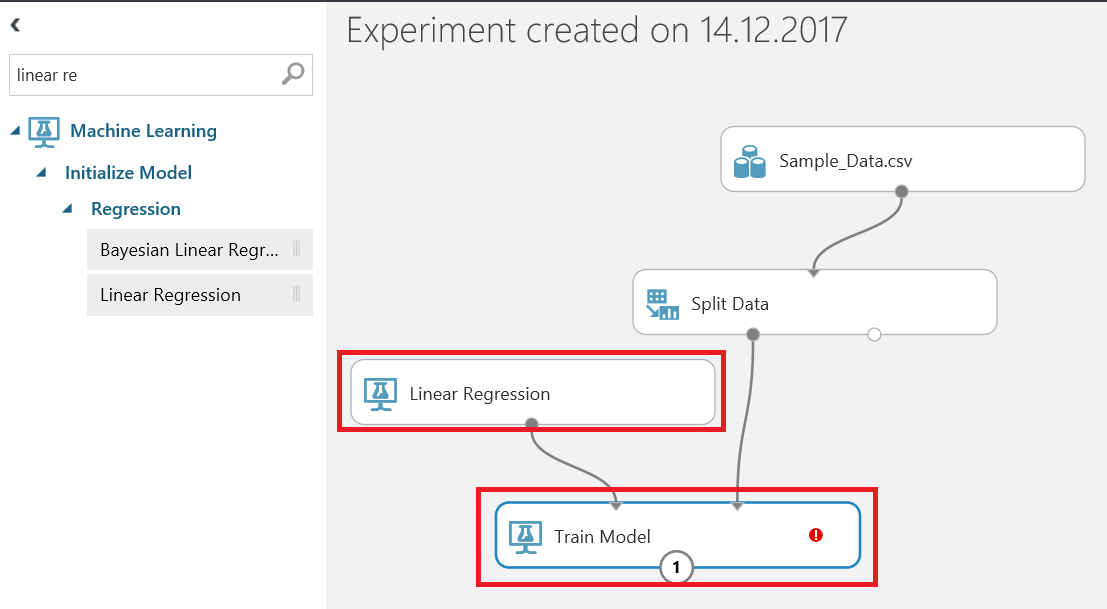
In this step, we will add the Train Model component and select Linear Regression. Splitting the data will pass 80% of data to the train model and linear regression component.
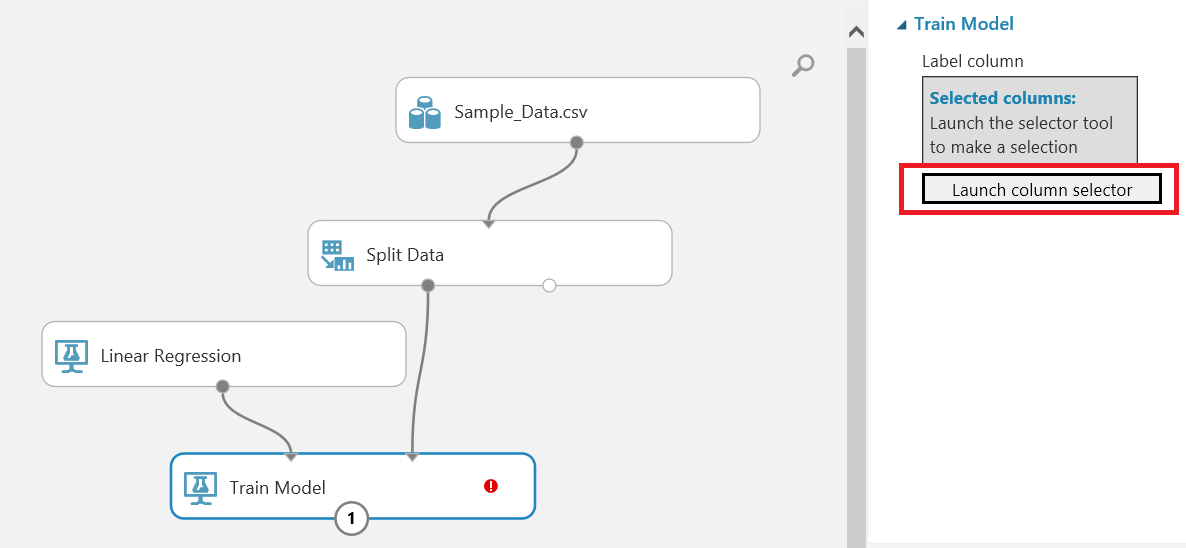
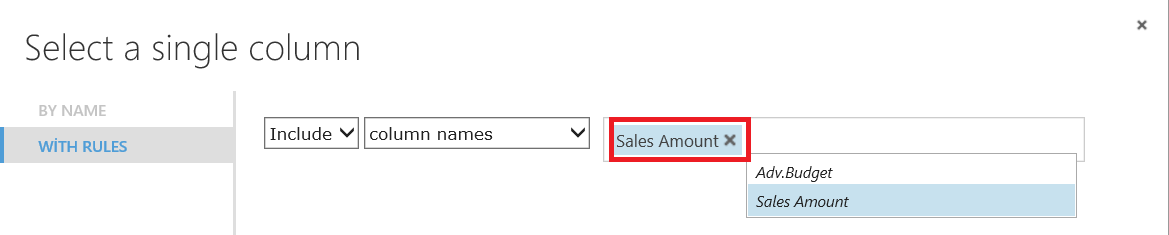
After this, we need to select Train Model and click Launch column selector. In the window, select Predict column. In our sample, we will select Sales Amount.
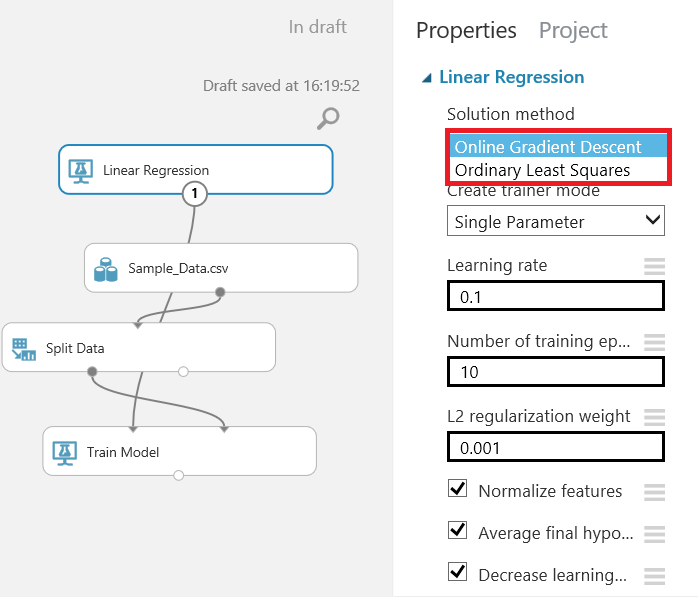
Let‘s analyze the Linear Regression component. We can choose two methods for prediction:
- Ordinary Least Squares
- Online Gradient Descent
The Ordinary Least Squares component refers to the loss function, which computes an error as the sum of the distance square from the actual value to the predicted line and fits the model by minimizing the squared error.
The Online Gradient Descent component is a method that minimizes the number of errors at each step of the model training process. This method has both pros and cons.
In our case, we will use the Ordinary Least Squares component.
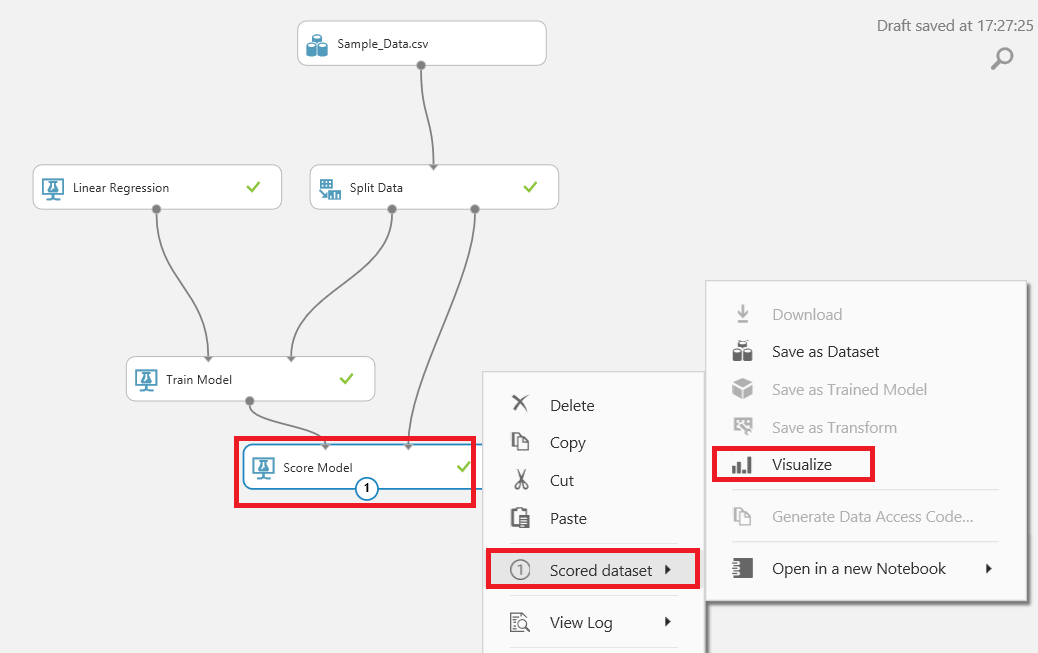
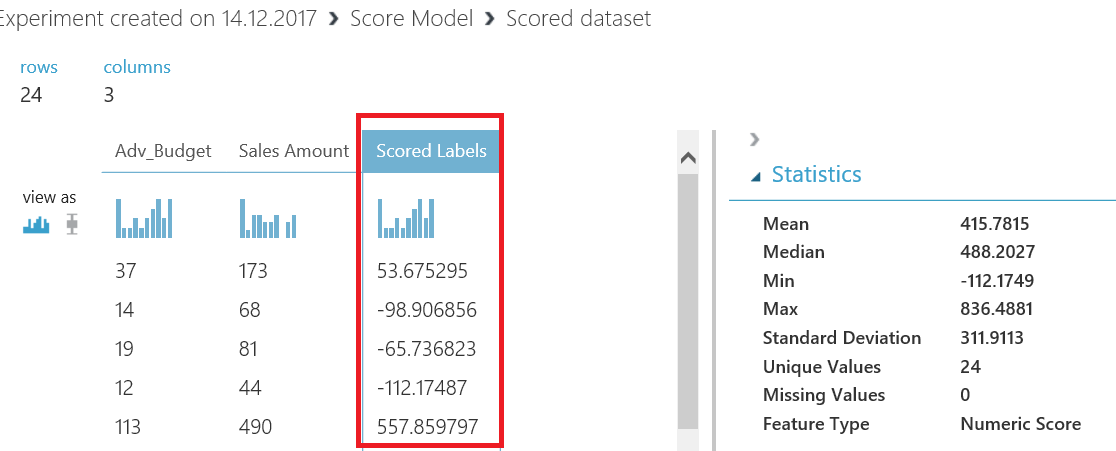
Add the Score Model component that tries to predict the test data. The train model provides a predictive algorithm that a score model uses. The Scored Labels column defines the prediction of Sales Amount.
Run the experiment.
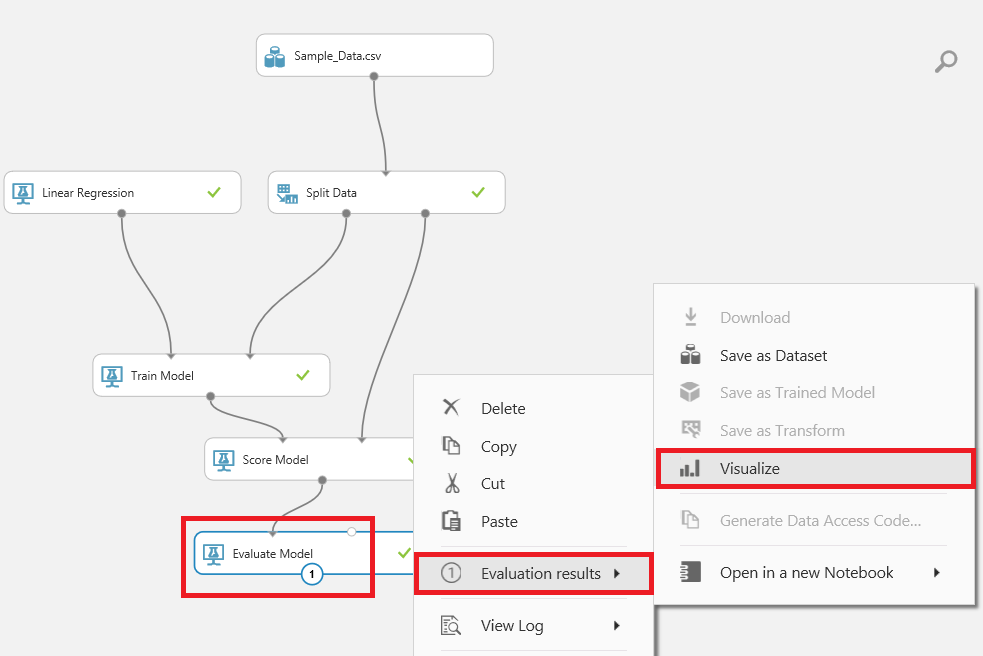
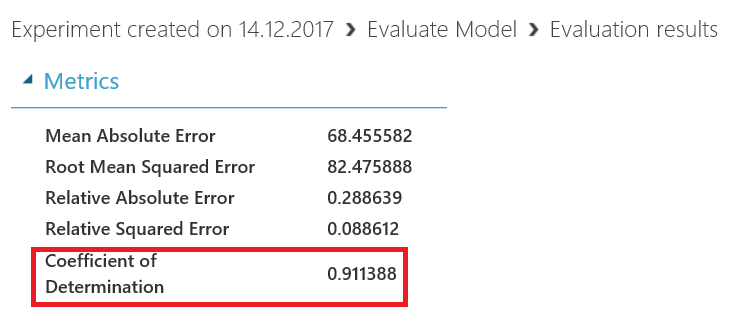
Now, add the Evaluate Model component that measures the accuracy of a trained dataset. For the linear regression, we will look at “Coefficient of Determination”. This value informs us about the accuracy of the model and can vary between 0 and 1. If the value is near 0.8 or 1, the linear regression model is reliable.
When we run our model, we will see a coefficient of determination about 0.9. It means that our model is almost perfect.
Conclusions
In this article, we discussed the main basic concept of linear regression. Azure Machine Learning is a gate to open new data world with which you can discover, analyze, and predict your data.
References
What is Simple Linear Regression?
How to evaluate model performance in Azure Machine Learning
Tags: azure Last modified: October 07, 2022