Cubes require frequent monitoring since their productivity decreases quite often (slowdowns during query building, processing time increment). To find out the reason of decrease, we need to monitor our system. For this, we use SQL Server Profiler. However, Microsoft is planning to exclude this SQL tracing tool in subsequent versions. The main disadvantage of the tool is resource intensity, and it should be run on a production server carefully, since it may cause a critical system productivity loss.
Thus, Extended Events is a general event-handling system for server systems. This system supports the correlation of data from SQL Server which allows getting SQL Server state events.
The system architecture is shown below:
In fact, we have a package that contains Events, Targets, Actions, Types, Predicates, and Maps. Sessions containing Events, Targets, Actions are run on the server. I won’t describe the architecture in detail since the help contains an explicit description.
Now, let’s return back to our SSAS. To make everything more vivid, let’s consider several scenarios that we use for problem analysis.
First scenario: Cube processing analysis (Multidimensional cube)
It is often the case when a cube is being updated for a very long time during processing, though the data volume is quite low. To find out the reason, we need to understand what query or what place of processing causes the slowdown. Of course, we can run processing on Production and see what is going on, but I’m not sure your users will appreciate it. Here Extended Events comes to the aid. Let’s run our session and configure its saving to a file.
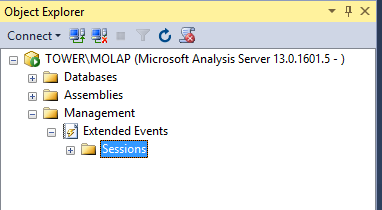
Let’s open SSMS and connect to SSAS, and then switch to Management.
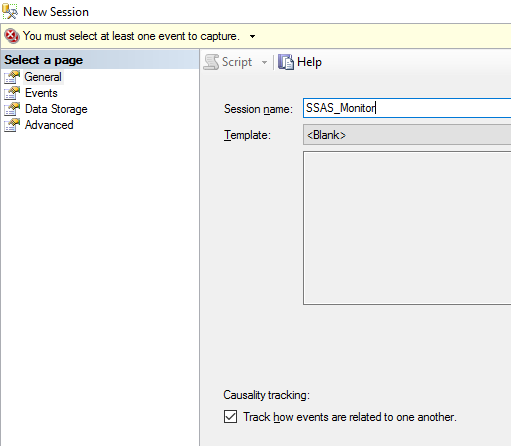
Now, let’s create a new session:
- On the General tab, specify a name for our session and load a template.

- The Events tab shows the events that will help us to analyze the problems. The tab features all our old friends from Profiler. Let’s select the following events for processing analysis: CommandBegin, CommandEnd, ProgressReportBegin and ProgressReportEnd, ResourseUsage.
CommandBegin, CommandEnd will show the beginning and ending of command execution during processing.
ProgressReportBegin and ProgressReportEn provide extended information on the length of each event and show data read, execution of SQL queries, length etc.
ResourseUsage shows the number of resources that were spent on execution of a query, an action.
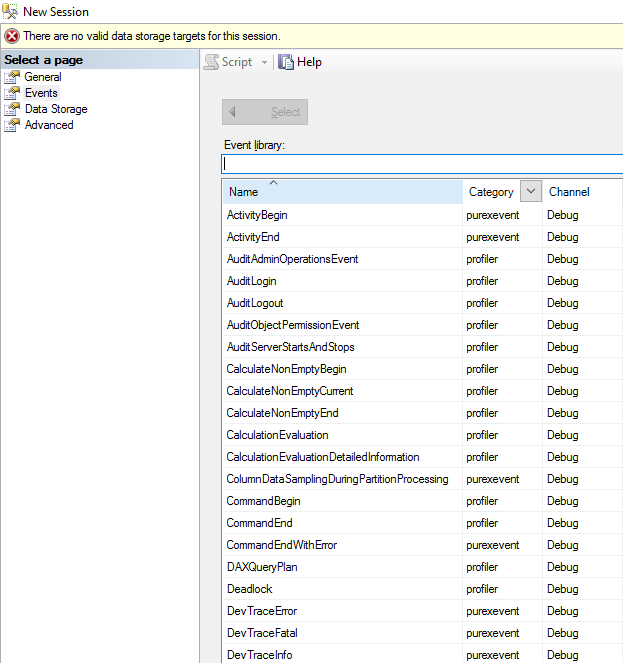
When we selected the events, we can switch to configuring each event and specify which events must be shown, and which events must be hidden (for instance, we can hide process id).
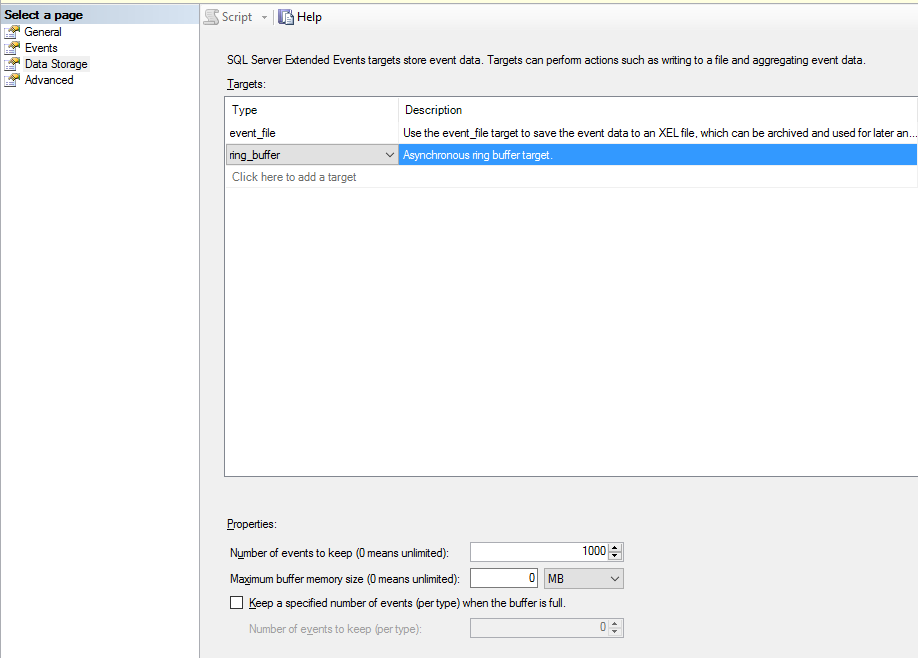
- Data Storage tab. Here we can specify either to show events in the real-time mode or write them to a file:
- event_file – saving event to a file for further analysis. Specify the maximum file size and destination path. If the file size exceeds the specified size, a new file will be created. Also, we can specify the number of files that must be created (maximum number files).
- event_stream – enables viewing events in the real-time mode.
- ring_buffer – specifies that the session data must be stored in memory as long as the server is run. In the case of reload, data will be dropped.

- The Advanced tab allows configuring resources (memory, processor) for a given session.
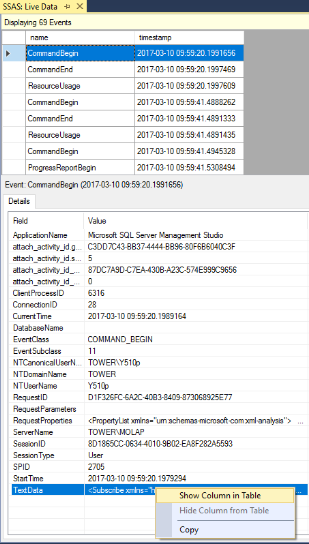
Finally, click OK and get the session. Let’s run cube processing and see the processing by events. Switch to the live data mode.
At the top of the following screenshot, we can see the events that take place right now with our instance. Details of the events are shown at the bottom. Any value of the event details can be added as a separate column at the top. Right-click a selected value of the event details and view them in a table.
In the result, we get the following view:
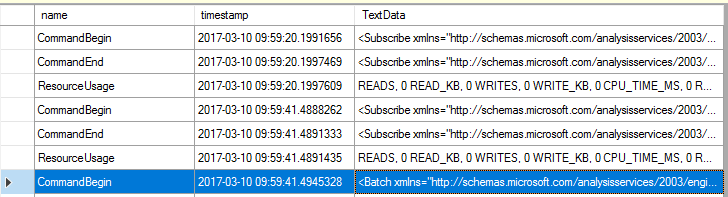
Therefore, Extended Events allow analyzing our processing in the real-time mode. We can understand how much time is spent on the processing of each object, how many resources are used whereupon. This helps to make conclusions and find weak spots. In addition, we do not overload the system and do not get productivity loss.
You can also create session via XMLA. You can retrieve the script at GitHub.
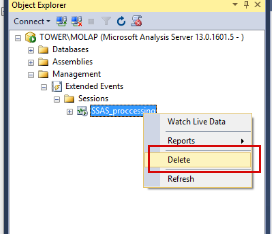
Stopping and deletion of a session is possible via both, SSMS and XMLA.
- Via SSMS (however, in 2016 the error occurs and I failed to delete session via interface).

- XMLA script – can be downloaded here.
This is the first part of the article about Extended Events for SSAS. In the second part, we will consider a scenario of query productivity analysis in cube, working with trace file and analyzing the file via Power BI.
I also recommend to take a look at the following blog posts:
- Pinal Dave — SQL SERVER – SQL Profiler vs Extended Events
- Chris Web — Profiler, Extended Events And Analysis Services. Though the author of the article states that Profiler is almost not used on production servers, but confirms its problems with server load.
- Brent Ozar — SQL Server Extended Events