In my previous article, Microsoft SQL Operations Studio: Understanding and Installation, we discussed deeply the need for a new SQL Server development and administration graphical user interface tool that can replace the default SQL Server user interface tool, the SQL Server Management Studio. We discussed deeply the new features and the advantages of SQL Operations Studio over the SQL Server Management Studio tool and how to download and install it to the Windows machine.
In this article, we will see the different configuration of the SQL Operations Window and how we can perform our daily tasks with it.
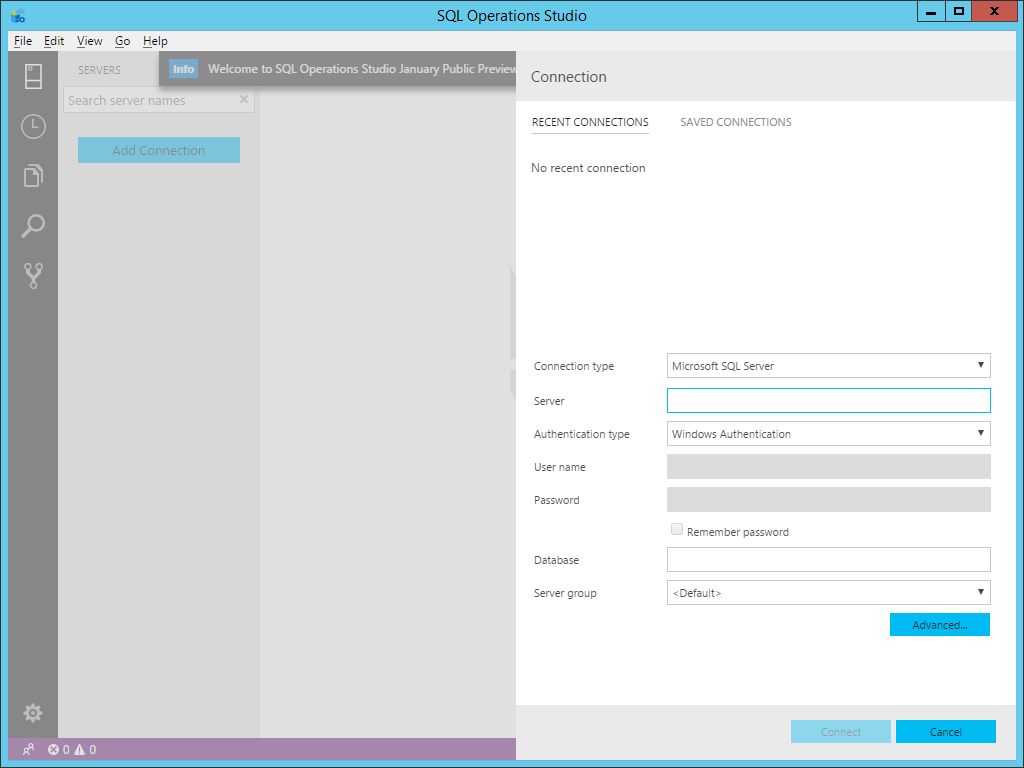
After installing SQL Operations Studio, the connection dialog will be opened automatically. In the connection dialog, type the name of the SQL Server instance that you want to connect to, with the authentication type that you will use, with the ability to connect to a specific database by writing the database name. After filling out the connection information, click the Connect button:
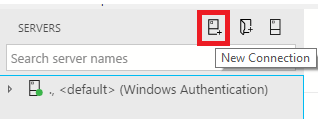
If the connection window does not appear automatically, click the New Connection icon as shown below:
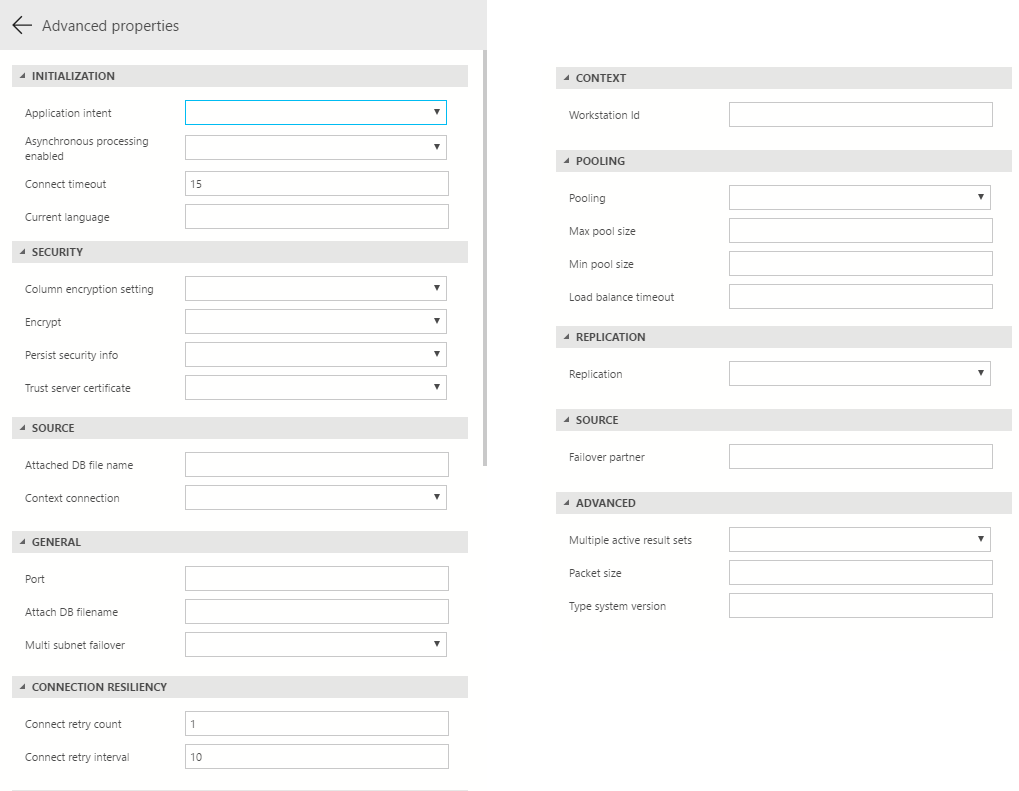
To customize your connection, click the Advanced button that provides a large number of options that can help you to draw a specific type of connection. For example, you can specify the application workload type when connecting to the server by setting the Application Intent option. You can also override the default Connect Timeout setting, the SQL Server Current Language, the default Column Encryption Setting for all commands on the connection, the Encrypt option to use the SSL encryption for all data sent between the client and the server if there is an installed certificate, Persist Security Info to prevent returning the password as a part of the connection, and use the SSL encryption although there is no certificate in the server by enabling the Trust Server Certificate.
You can also use the Advanced options to specify the number of attempts to restore connection and the delay between attempts using Connect Retry Count and Connect Retry Interval. In addition, you will be able also to specify the maximum and the minimum number of connections allowed in the pool with the ability to force that the connection object is drawn from the appropriate pool, and the minimum amount of time for that connection to live in the pool using Load Balance Timeout. The Failover Partner option allows you to provide the name of the SQL Server instance that acts as a failover partner. You can control the size of the network packets used to communicate with the SQL Server instance using the Packet Size option. The described options and all other available options are shown below:
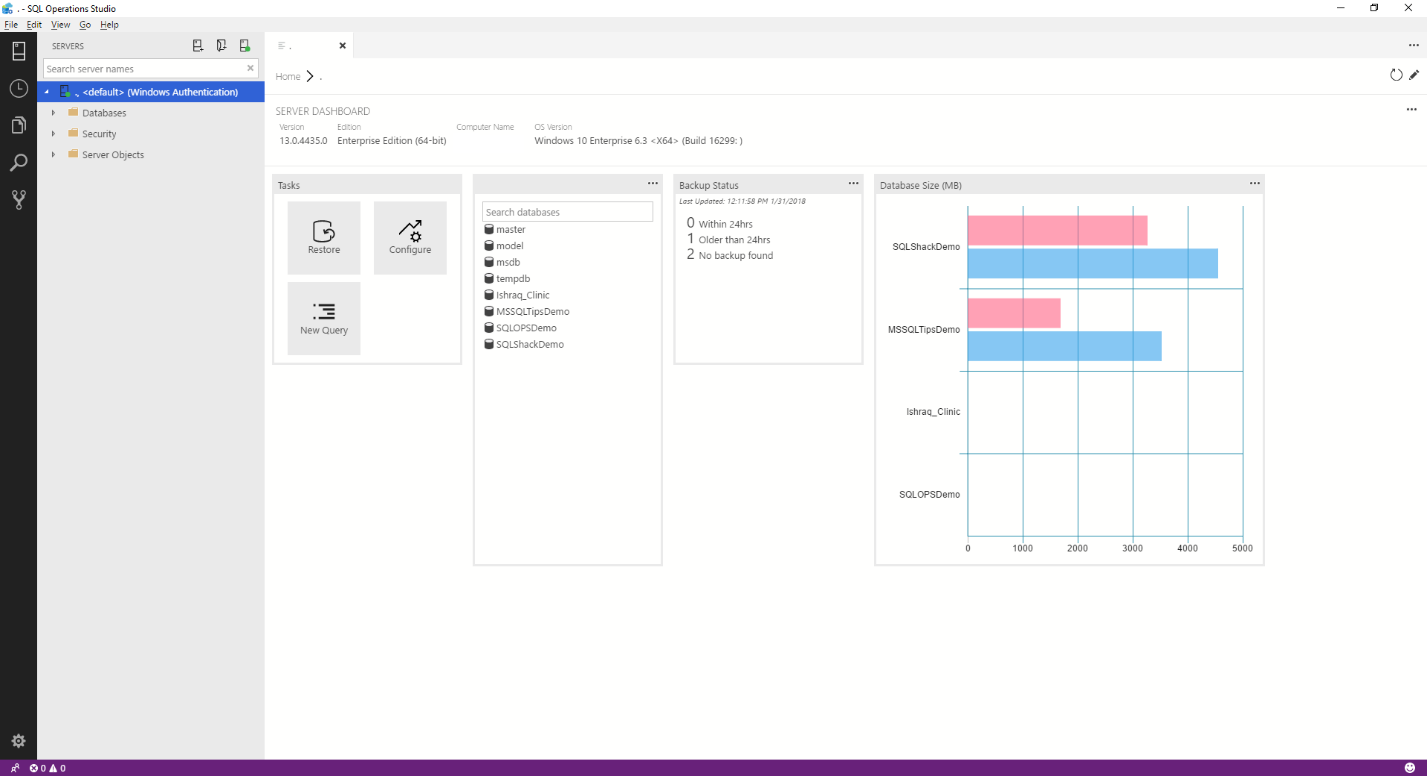
Once you fill the connection information and provide the advanced options if required, click the Connect button, that will show you the Home window, from which you can start your development and administration work, as shown below:
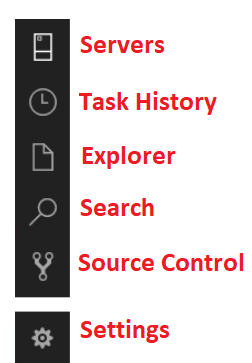
On the left side of the SQL Operations Studio, you will find six icons. Each icon will open a new pane that provides the corresponding functionality sets, as shown below:
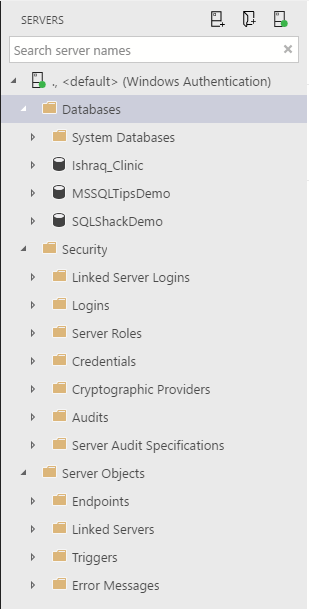
The first pane is the Server pane, that allows you to navigate to the different SQL Server instance and database objects, and perform different operations on these objects, which is similar to the Object Explorer in SQL Server Management Studio tool, as shown below:
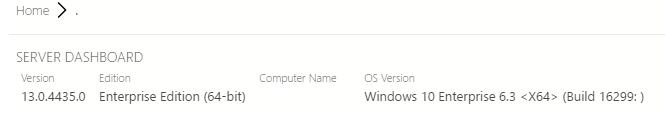
At the right side of the appeared window under the Server pane, the SQL Operations Studio Dashboard shows much useful information, such as the currently connected SQL Server instance versions and editions and the and the hosting operating system version:
Under SQL Operations Studio Dashboard header, you will see three shortcuts to common server level tasks, such as database restore, server configuration and new query creation, as shown below:
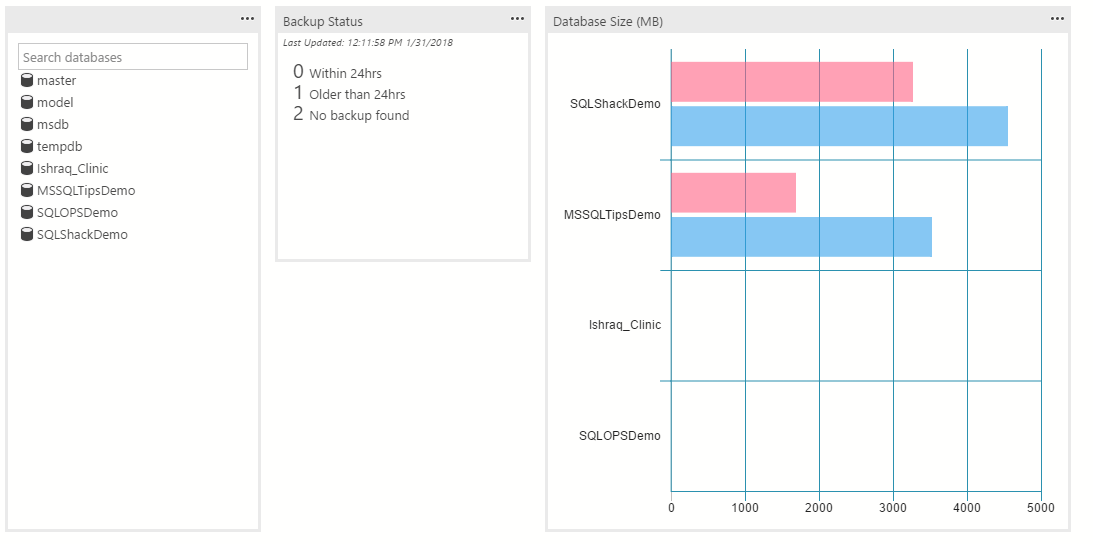
Other useful information that is provided by SQL Operations Studio Dashboard includes a list of all databases under the connected SQL Server instance, the status of the performed backups and chart of the databases size comparison, as shown clearly below:
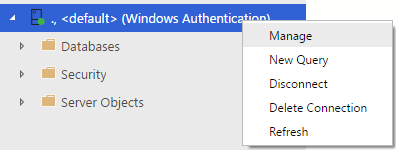
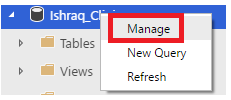
If the SQL Operations Studio Dashboard does not appear automatically, you can open it by choosing the Server pane, then right-click the connected SQL Server instance and select the Manage option, as below:
Another customizable dashboard is also available at the database level. Right-click the database name and choose Manage option:
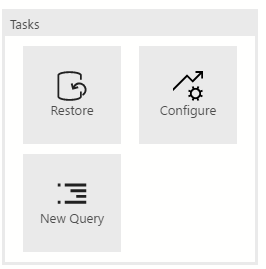
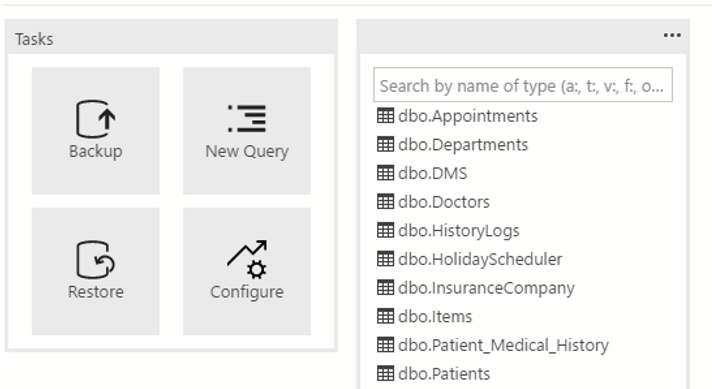
The database dashboard contains four shortcuts to common database level tasks, such as database backup, restore, configuration and new query creation. In addition, list of all database objects will be displayed with an interactive search option, as shown below:
Beside the Servers pane, in addition to the New Connection button we used previously to open the Connection window, there are two useful icons shown below:
![]()
The first icon is used to create a New Server Group, in which you can define a new server group, description for the created group and choose a color to visually identify that group as shown below:
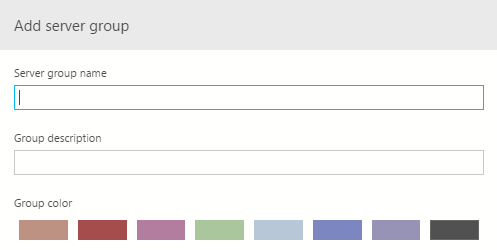
For example, you can choose a specific color for the development environment to distinguish it from the production environment that will be assigned a different name and color as below:

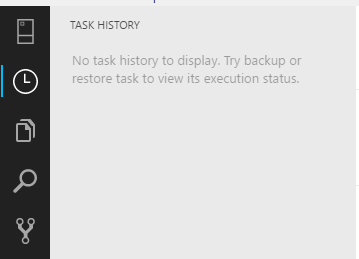
The next icon is the Task History icon. The pane that is opened when you click this button will show a list of all tasks, such as backup or restore tasks, that were performed on the select SQL Server instance, as in the snapshot below:
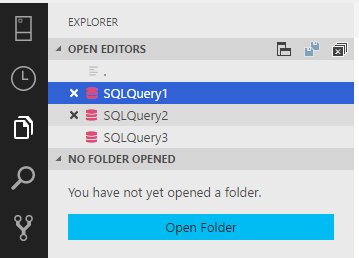
The Explorer pane shows a list of all files and folders that are opened in the SQL Operation Studio, from where you can view, save, open in the terminal, open to the side, revel in the explorer and perform many other tasks, as shown below:
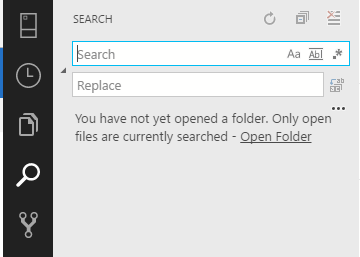
The Search pane also provides you with an easy and quick way to search for any value in all opened files or folders, and replace the selected value with another one, as in the snapshot below:
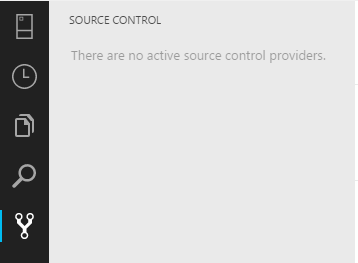
And the Source Control pane allows you to connect to a previously configured source control repository to pull, modify and save the files, as shown below:
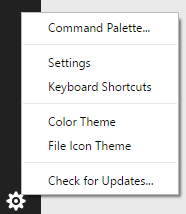
The last pane shows the general settings that are used to configure the SQL Operations Window, such as the Keyboard Shortcuts, the Color Theme, File Icon Theme and other settings shown below:
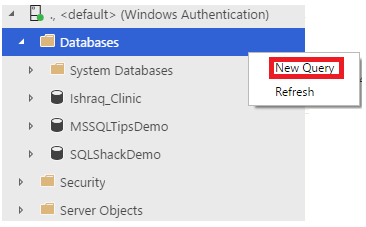
At this point, the SQL Operations Studio interface is introduced in a way that helps you to start working deeply on it to perform your daily tasks. For instance, you can create a new database using T-SQL commands, rather than using the UI method, which is not available in the SQL Operations Studio. To create a new query, right-click the Databases node under the connected SQL instance and choose the New Query option, as shown below:
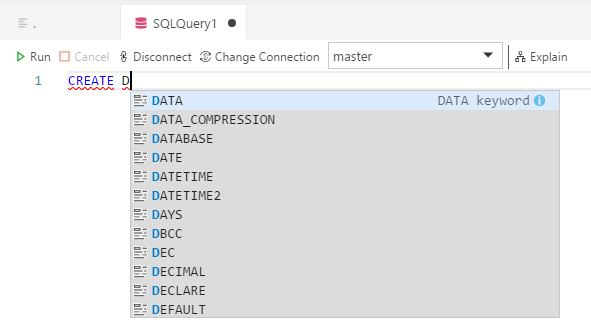
A new window will appear, in which you can write and execute a query, in addition to specifying and modifying the connection of that query. Another useful feature in the SQL Operations Studio is that, when you start typing the T-SQL command, the fast SQL IntelliSense and the code snippets, which is an extensive library of T-SQL commands templates, will help you identify the database objects and the T-SQL commands correct syntax, without the need to search online for the correct syntax of each T-SQL command, as shown below:
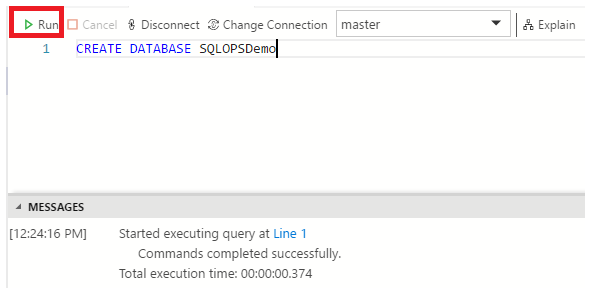
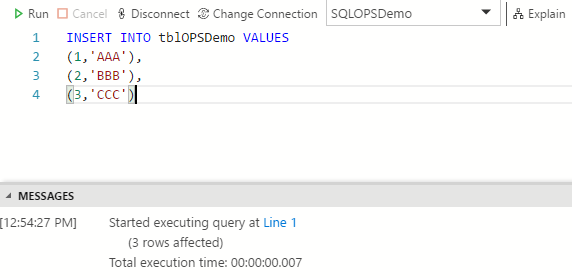
Once you complete writing the query, click the Run button to execute the query. After executing the query, the Messages tab will display useful information about the query execution, such as the accurate total execution time for the query, as shown below:
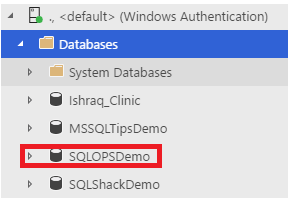
Refresh the Databases node on the Servers pane to make sure that the database is created successfully, as in the snapshot below:
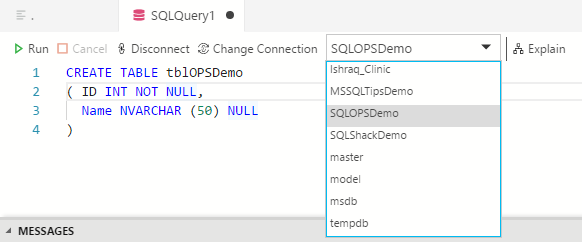
Now the database is ready for our demo. We will create a new table under that database, using the CREATE TABLE T-SQL command, as this functionality is not supported in the UI of the SQL Operations Studio current version. Open the New Query window and type the CREATE TABLE T-SQL statement below, after making sure that you choose the correct database name from the databases dropdown list, as the default database to which all queries will connect to is the master database:
To execute the previous query, click the Run button to have the table created successfully. Having the table ready, we will insert few records using the INSERT INTO T-SQL command, as in the below statement:
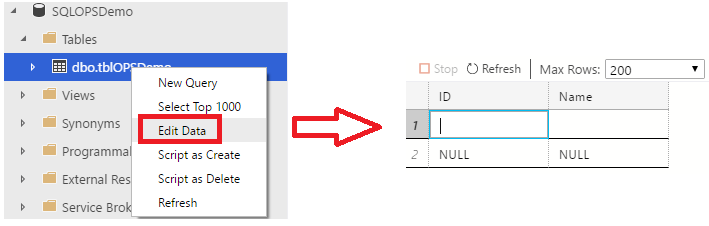
Or insert it directly by right-clicking on the database table and choose Edit Data, similar to the SQL Server Management Studio, as shown below:
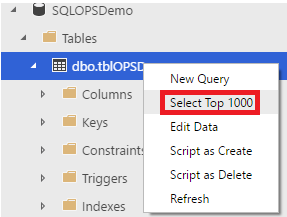
To view the inserted data into the table, you can simply right-click the database table and choose the Select Top 1000 option, as below:
Alternatively, open the New Query window and write the SELECT statement below. After executing the query, you will see that the Messages tab will be displayed below the Results tab, different from the SQL Server Management Studio tool, in which the results and the Messages will appear in different tabs:
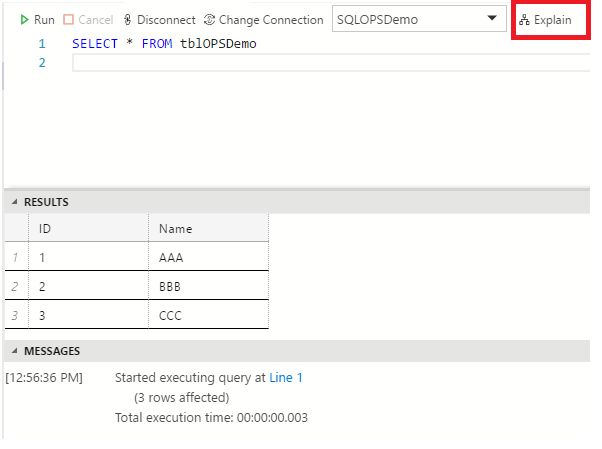
If you click the Explain button in the previous query window, the execution plan of the executed query will be displayed under the Query Plan tab as shown below:
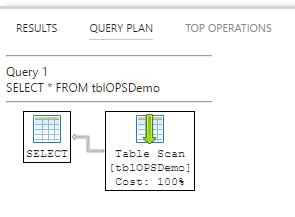
In addition, detailed information of the query execution cost will be displayed under the Top Operations tab, as shown below:

Another useful feature of SQL Operation Studio for the SQL Server is the Peek Definition. Assume that you want to get the definition of the database object that you are working with, such as the list of columns or columns data types for a specific table, without the need to browse the database tables within the Servers pane. From the query editor, locate the cursor on the name of the table that you need to know its definition and right-click the name, then choose the Peek Definition option from the list, as shown below:
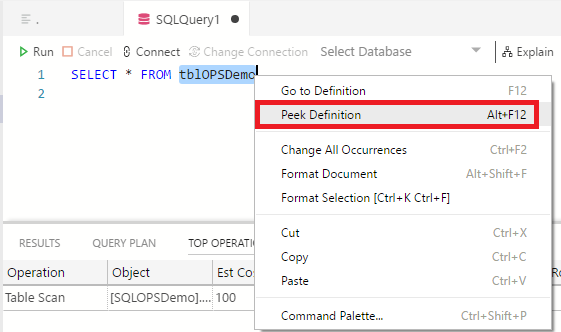
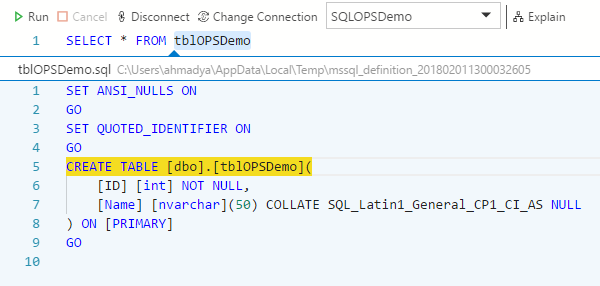
A new small window will appear under the peeked table, that contains the definition of the selected table. This will work also with other database objects such as the database stored procedures and functions. The definition of the previously peeked table will be like:
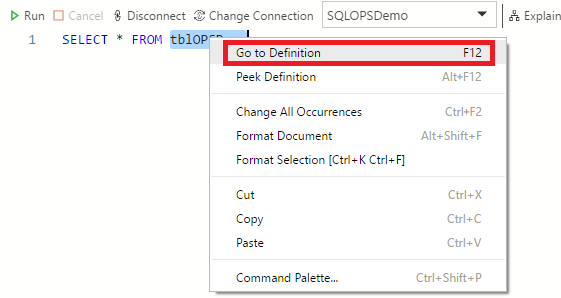
You can also view the definition of the database objects using the Go to Definition option, that will display the definition of that object in a new tab. Again, right-click the name of the table that you need to view its definition and choose Go to Definition:
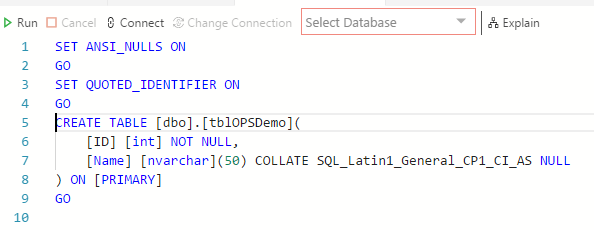
A new window will be displayed in a separate tab, that contains the selected table’s definition, as shown below:
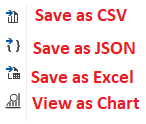
Another great addition that you should pay attention in SQL Operations Studio are the Save as and View options. At the right side of the Query Results tab, you will see four icons that can be used easily to save the result of the executed query in different formats, such as CSV, JSON or Excel format or view it as a customized chart, as shown below:
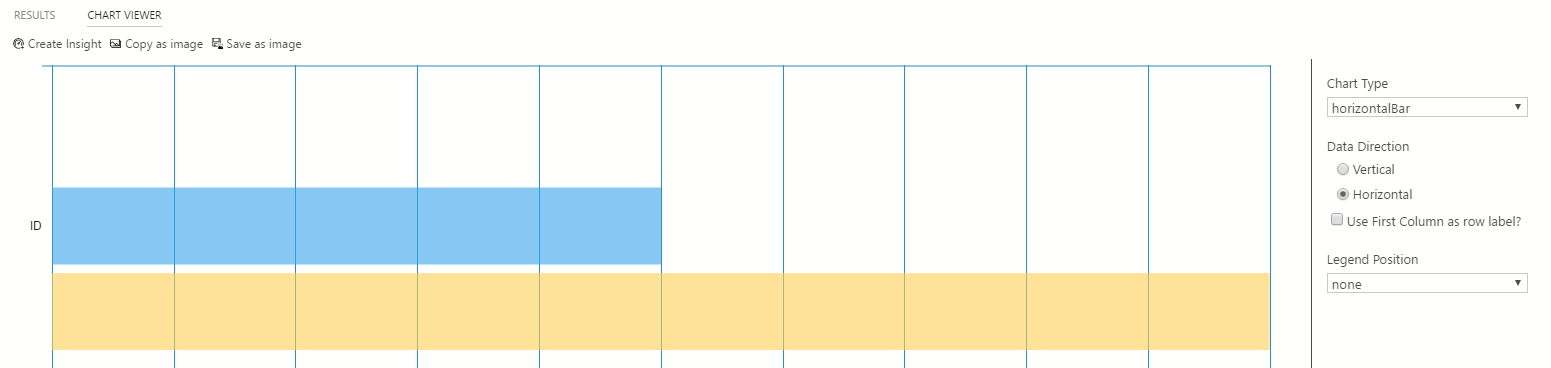
If you click the View as Chart option, the data returned from the executed query will be drawn in a chart, that can be customized using the available types and options. Viewing the result of the previous query as a chart, which has no meaning in our case, will be like:
Useful Links
- Download and install SQL Operations Studio (preview)
- Tutorial: Use the Transact-SQL editor to create database objects – SQL Operations Studio (preview)
- Create and use code snippets to quickly create Transact-SQL (T-SQL) scripts in SQL Operations Studio (preview)
- Server groups in SQL Operations Studio (preview)
- Manage servers and databases with Insight widgets in SQL Operations Studio (preview)