The most important and challenging responsibility of a database administrator is monitoring performance metrics. Because monitoring performance and troubleshooting performance issues are considered to be difficult. For this reason, we need diagnostic and monitoring tools to measure performance counters and metrics. For Azure SQL there is a tool which is named SQL Analytics. With this tool, we can measure and monitor Azure SQL databases and elastic pools. At the same time, we can create alerts for notifications. SQL Analytics offers performance metrics in graphical form. In this article, we will learn how to enable Azure SQL Analytics.
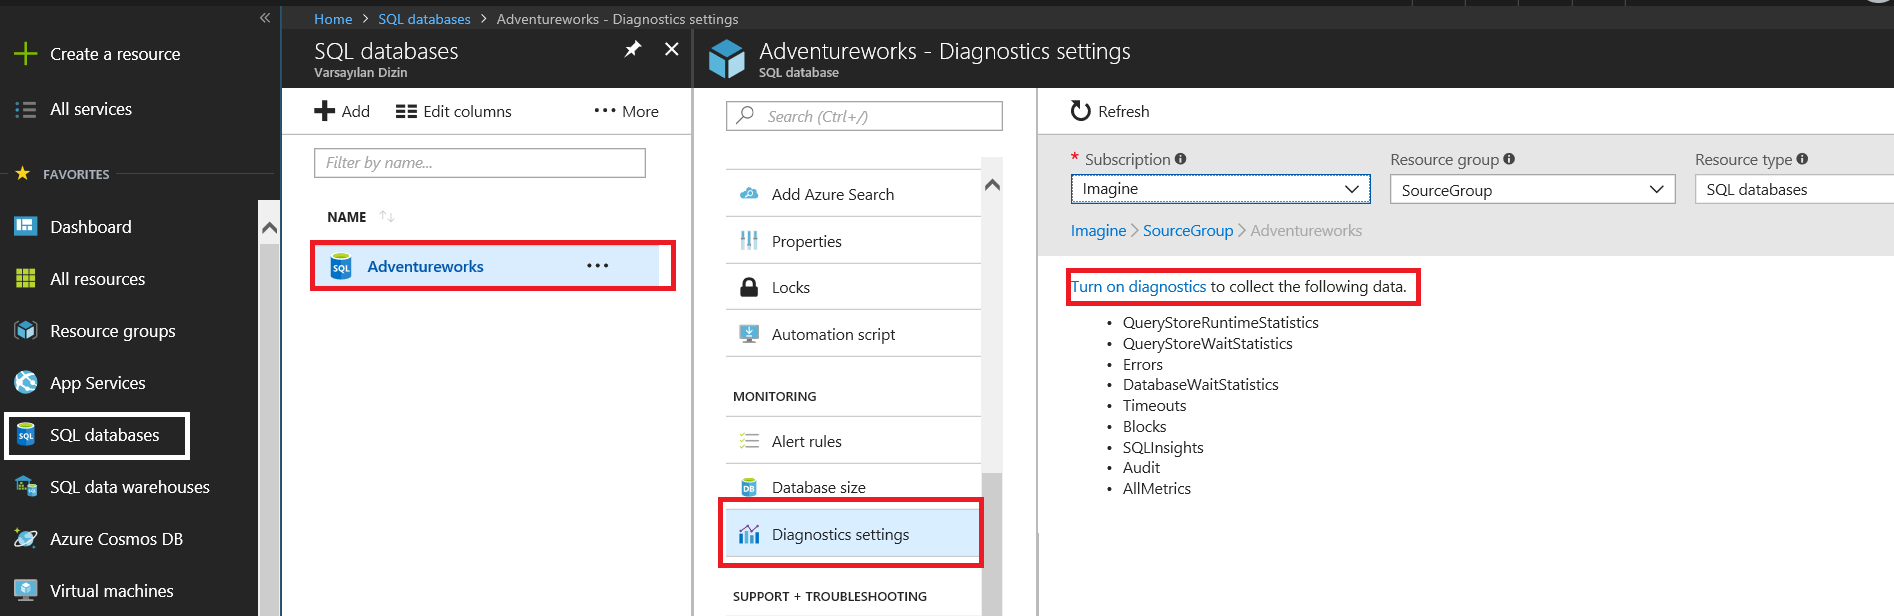
In the first step, we will turn on diagnostics to collect performance metrics. We can find this menu under the SQL Databases option. Click Turn on diagnostics.
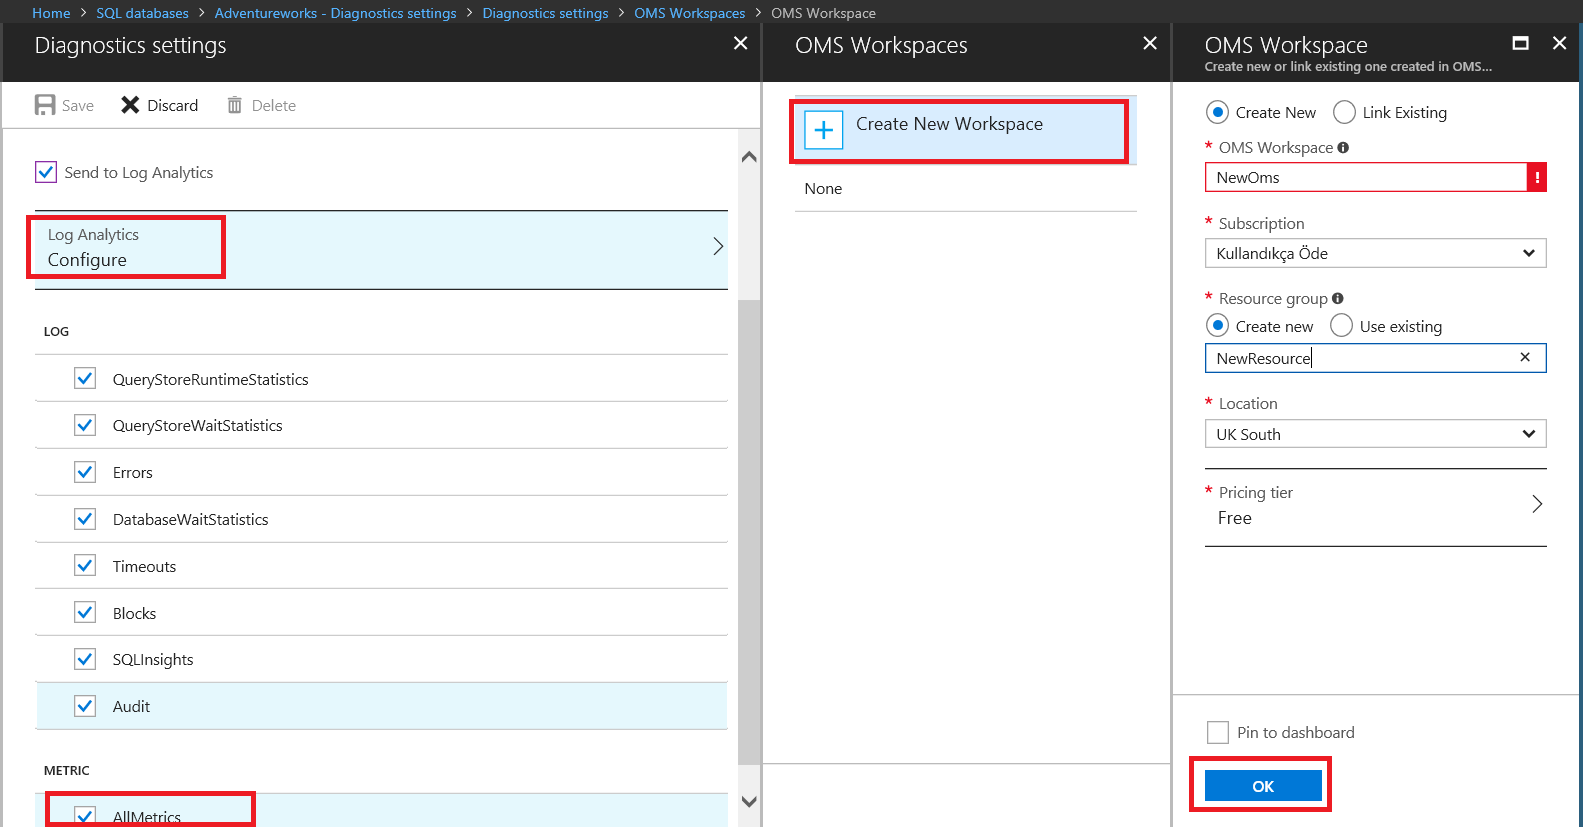
In this step, we have to configure Log Analytics (Management data collected by Log Analytics is stored in a repository which is hosted in Azure) and create Operation Management Suite (Operations Management Suite is Microsoft’s cloud-based IT management solution that helps you manage and protect your on-premises and cloud infrastructure.) Check “AllMetrics” to collect all of metrics and check all of the “Log” options. Then click “Create a workspace” and “OMS Workspace” is created.
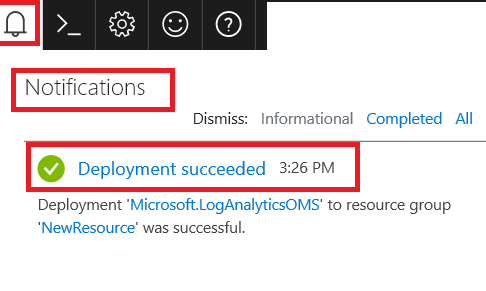
We can see the status of deployment under notifications menu.
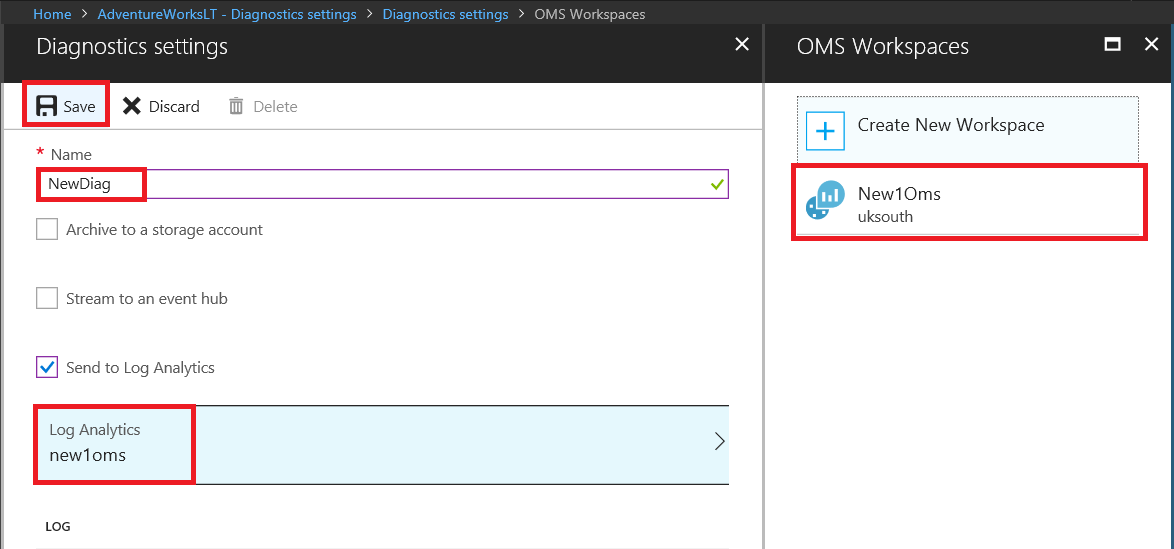
Now, we are ready to save “Diagnostic settings”.
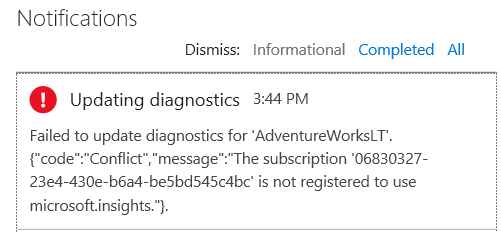
If you are not registered to microsoft.insights you can take “Failed to update diagnostics for ‘DbName” {“code”:”Conflict”:”message”:” The subscription ‘Id’ is not registered to use microsoft.insights”}.
Resolution:
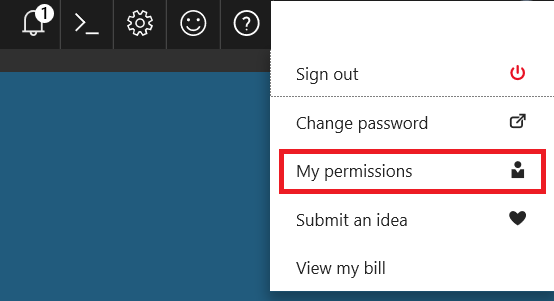
- Click “My permissions” under the user Id
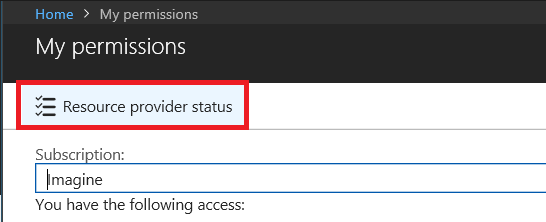
- Click “Resource provider status.”
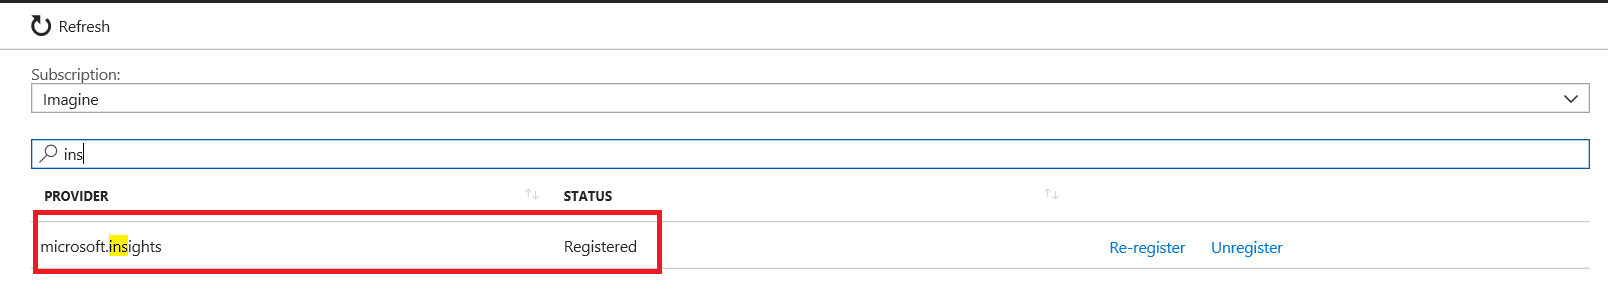
- If microsoft.insight status is unregistered, you have to register.
In this step, we will setup Azure SQL Analytics. Go to the marketplace and click “All Services” and find the marketplace.
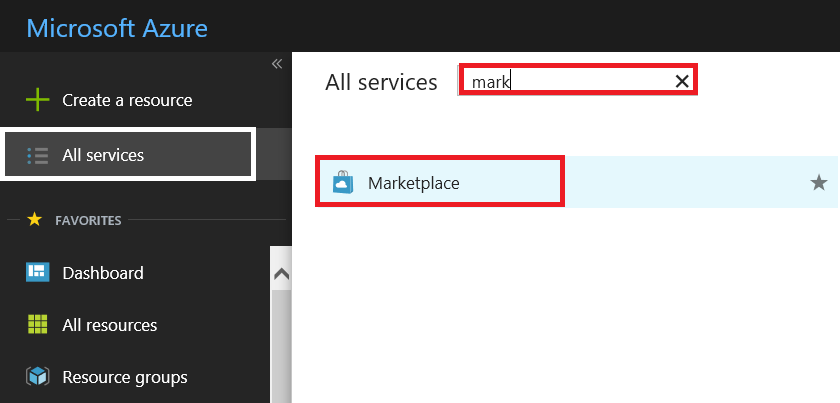
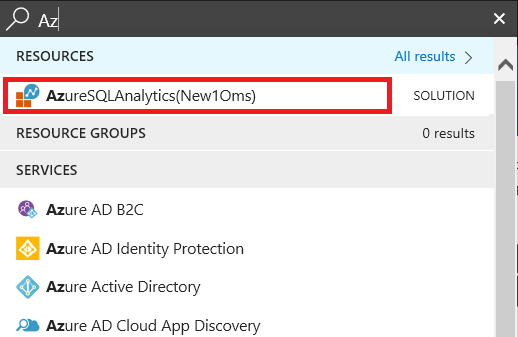
Type “Azure SQL Analytics” in the search.
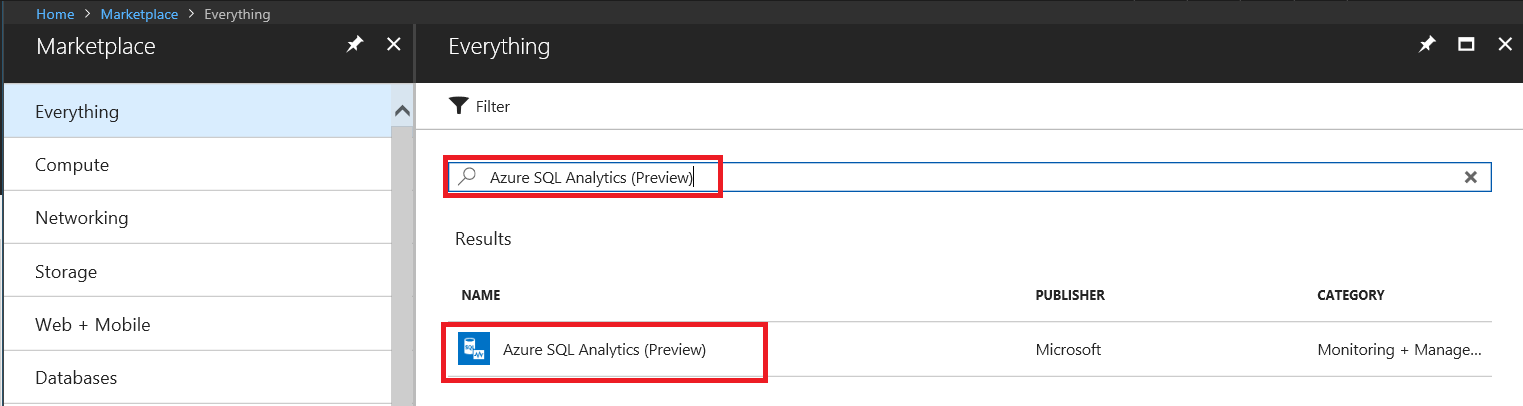
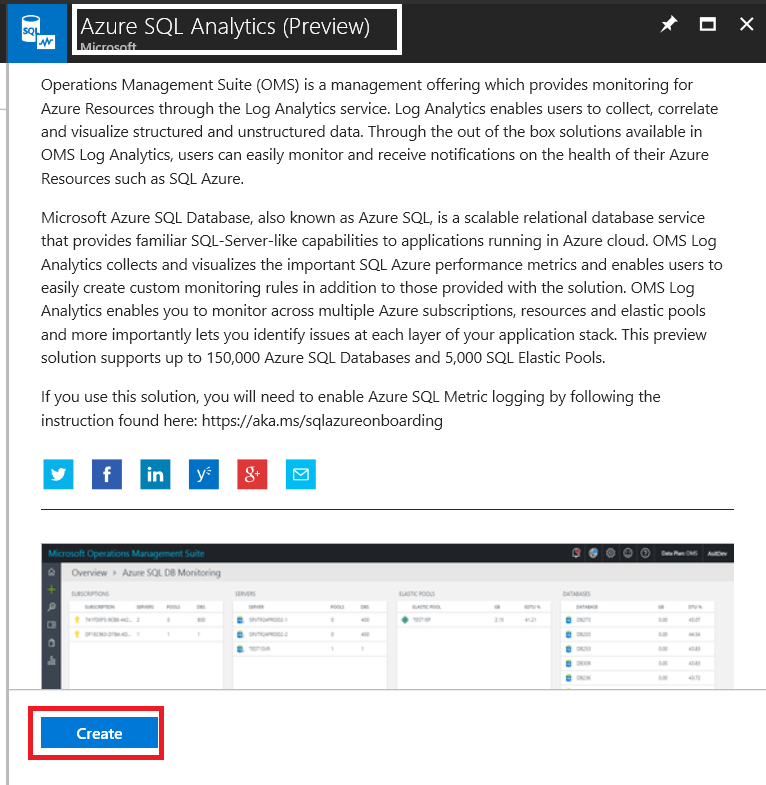
After that, create Azure SQL Analytics.
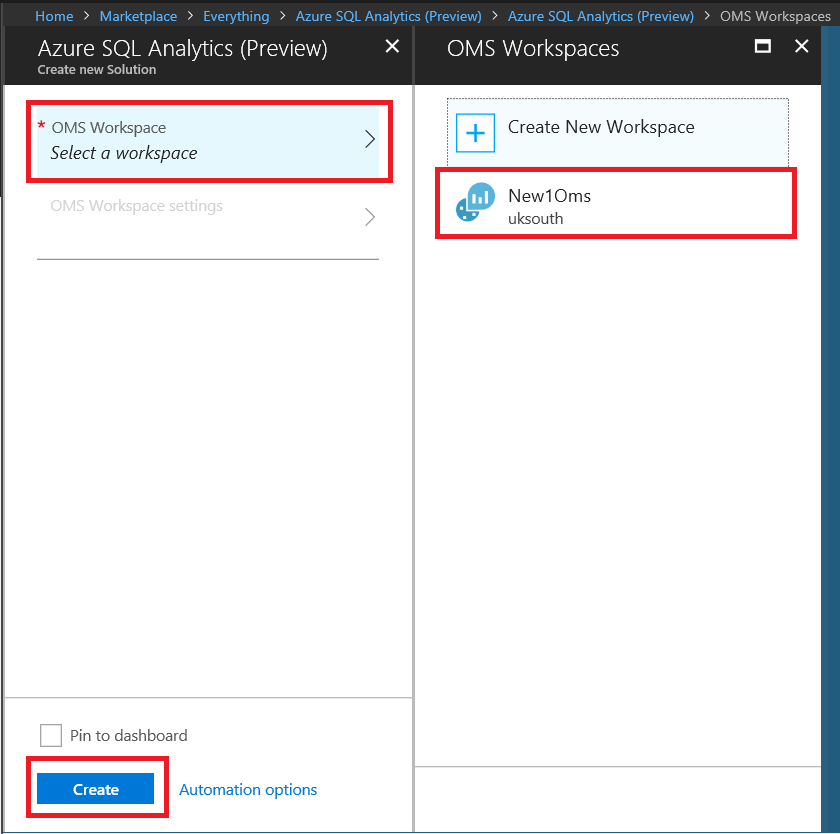
Select OMS (Operation Management Suite) Workspace and click “create”.
Now, Azure SQL Analytics is ready for use.
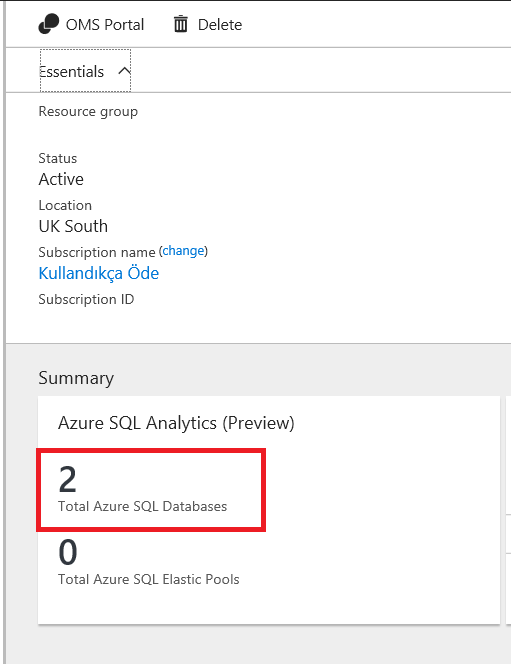
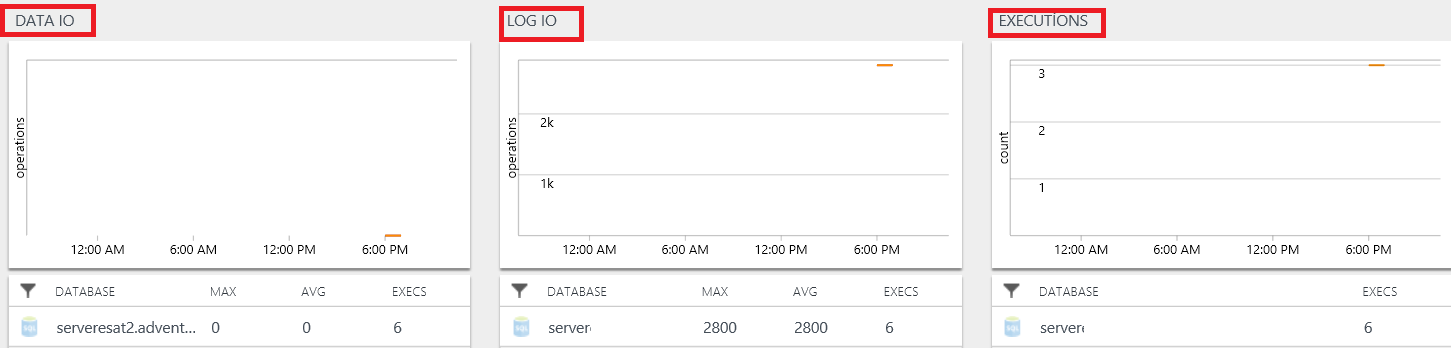
In this screen, we can find a dashboard which includes the main metrics of databases.
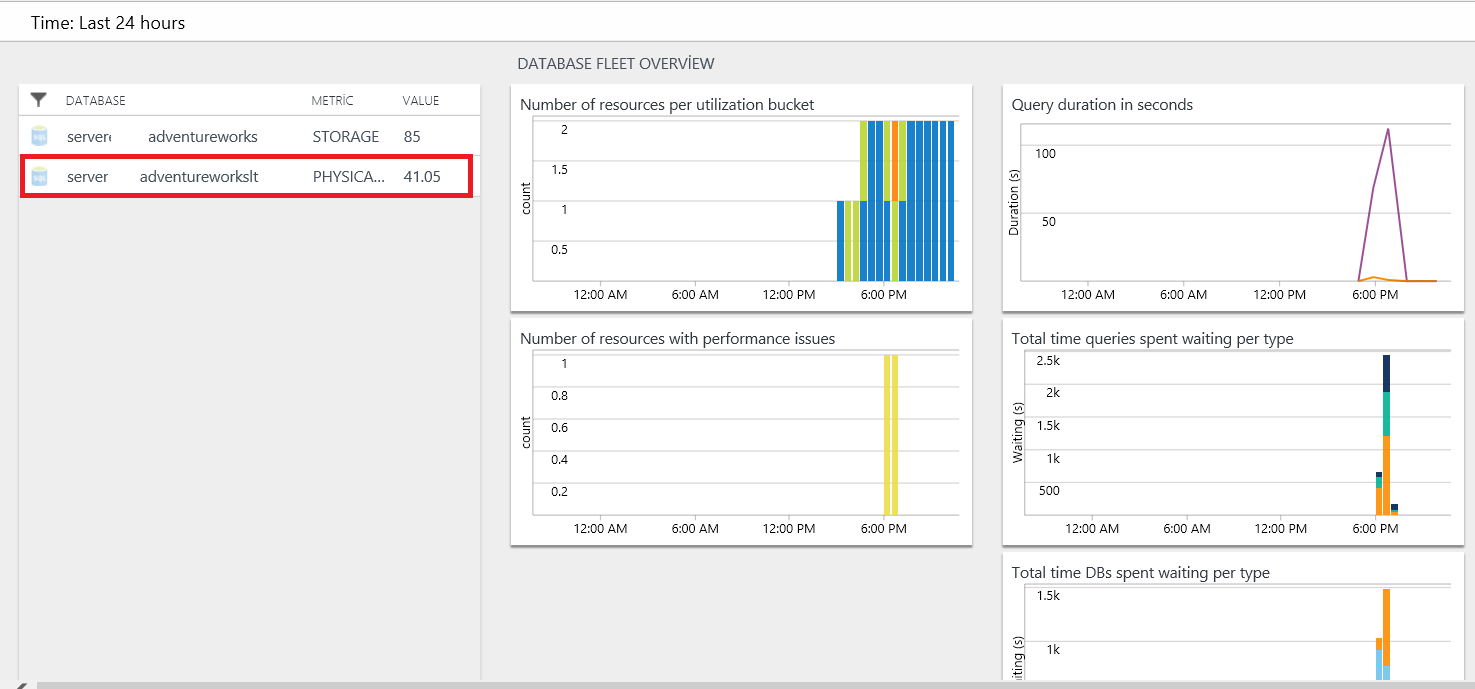
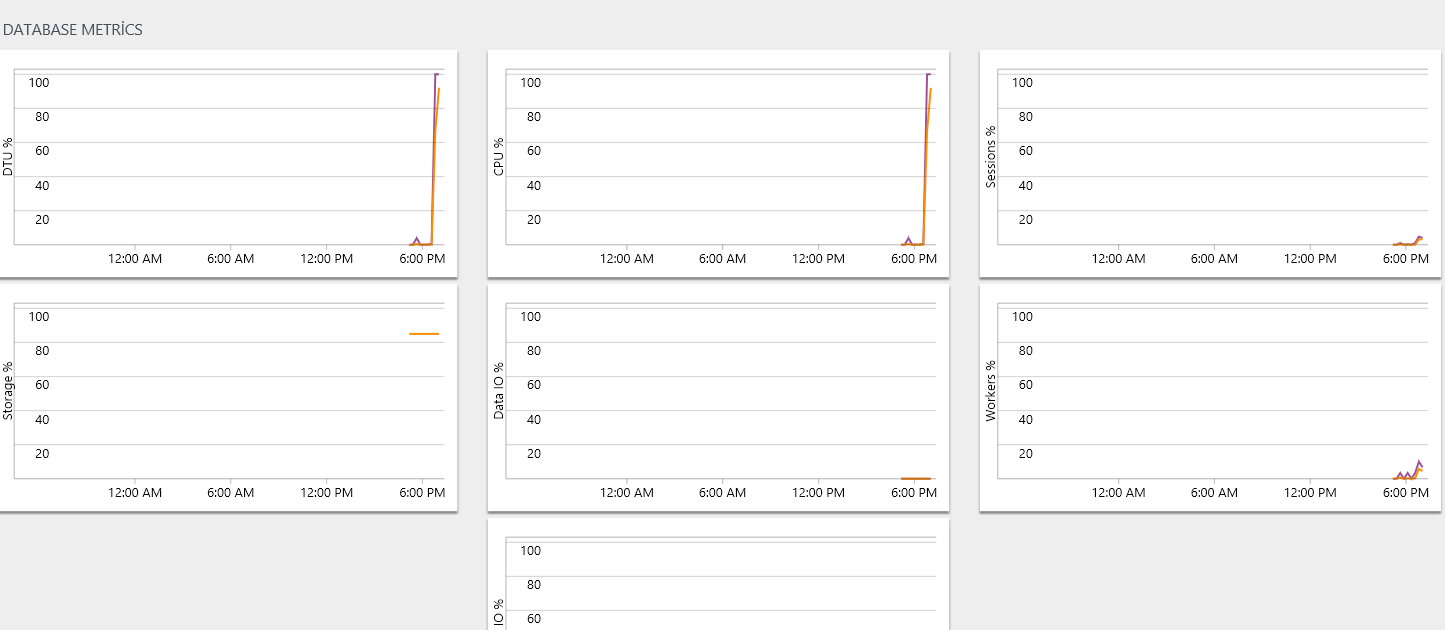
When we click one of the databases, we can find “DATABASE METRICS” on the right side of the screen. In this screen, we can find DTU, CPU, storage, Disk I/O utilizations.
Database Throughput Unit (DPU): Database Throughput Unit defines the performance level of individual databases. DTU is a performance indicator which is a combination of some performance counters (CPU, memory, I/O). If DTU is over %100, Azure database needs more resources, so we have to use DTU.
When you click the report chart, the details screen will open. In this screen, you can change chart, type, filter chart timeline and find legacy Log Analytics query. Moreover, you can download Power Query for PowerBI.
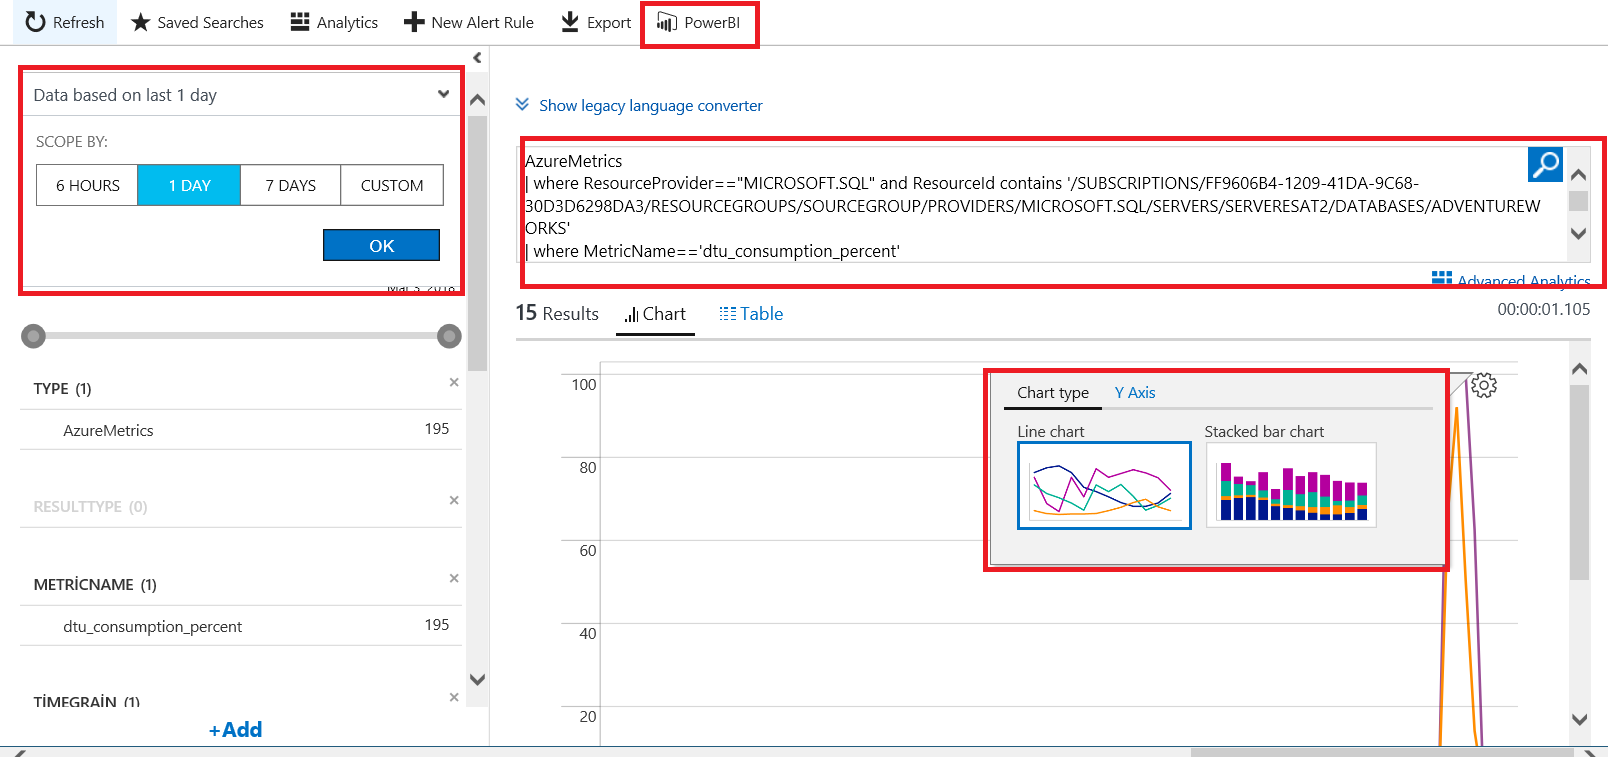
Now, create a custom Power BI report for Database Throughput Unit utilization.
- Click PowerBI and download Power Query.
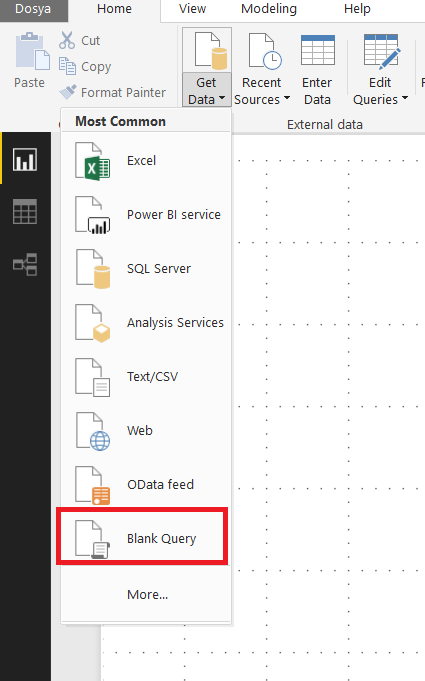
- Open Power BI and open blank query.
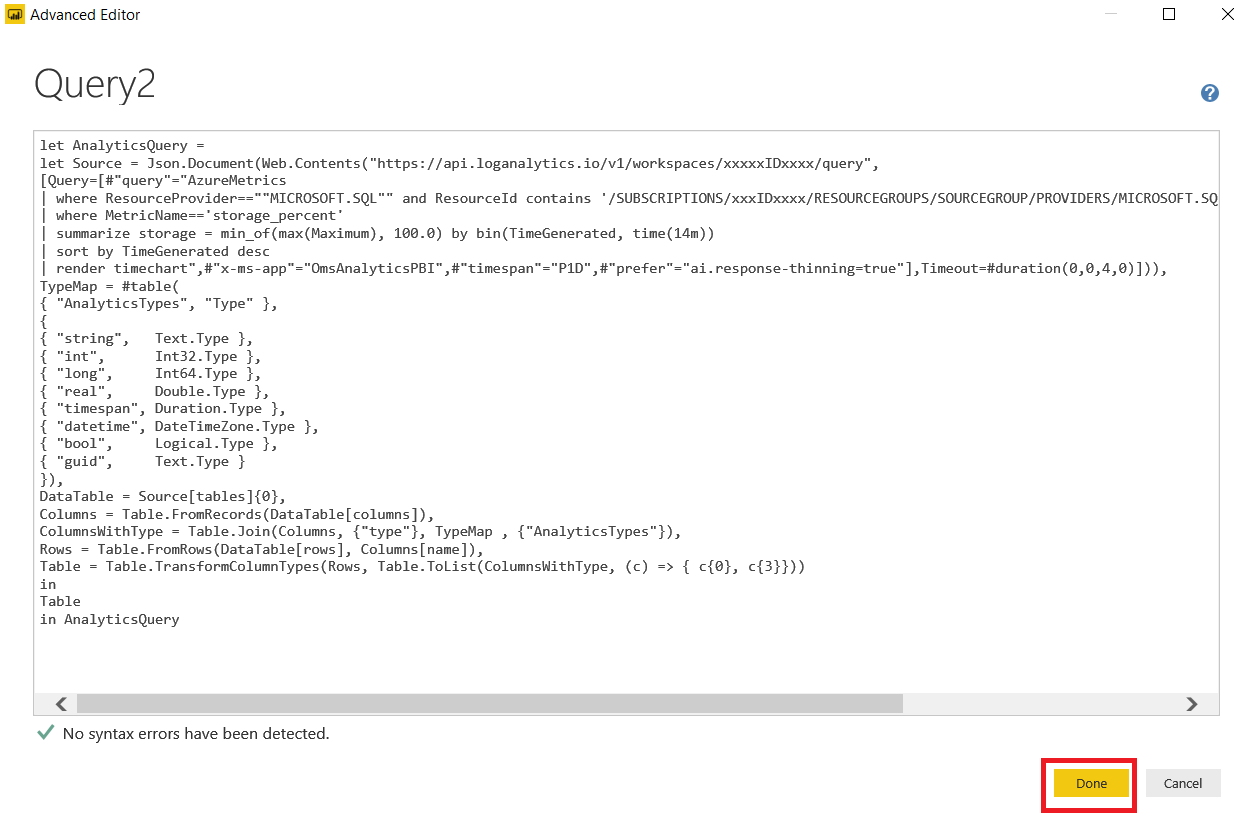
- Click “Advanced Editor” and paste the query to this screen.
The exported Power Query Formula Language (M Language) can be used with Power Query in Excel and Power BI Desktop.
For Power BI Desktop, follow the instructions below:
- Download Power BI Desktop from https://powerbi.microsoft.com/desktop/
- In Power BI Desktop select: ‘Get Data’, then ‘Blank Query’, and then ‘Advanced Query Editor’
- Paste the M Language script into the Advanced Query Editor and select ‘Done’
let AnalyticsQuery =
let Source = Json.Document(Web.Contents("https://api.loganalytics.io/v1/workspaces/xxxxxIDxxxx/query",
[Query=[#"query"="AzureMetrics
| where ResourceProvider==""MICROSOFT.SQL"" and ResourceId contains '/SUBSCRIPTIONS/xxxIDxxxx/RESOURCEGROUPS/SOURCEGROUP/PROVIDERS/MICROSOFT.SQL/SERVERS/SERVERESAT2/DATABASES/ADVENTUREWORKS'
| where MetricName=='storage_percent'
| summarize storage = min_of(max(Maximum), 100.0) by bin(TimeGenerated, time(14m))
| sort by TimeGenerated desc
| render timechart",#"x-ms-app"="OmsAnalyticsPBI",#"timespan"="P1D",#"prefer"="ai.response-thinning=true"],Timeout=#duration(0,0,4,0)])),
TypeMap = #table(
{ "AnalyticsTypes", "Type" },
{
{ "string",   Text.Type },
{ "int",      Int32.Type },
{ "long",     Int64.Type },
{ "real",     Double.Type },
{ "timespan", Duration.Type },
{ "datetime", DateTimeZone.Type },
{ "bool",     Logical.Type },
{ "guid",     Text.Type }
}),
DataTable = Source[tables]{0},
Columns = Table.FromRecords(DataTable[columns]),
ColumnsWithType = Table.Join(Columns, {"type"}, TypeMap , {"AnalyticsTypes"}),
Rows = Table.FromRows(DataTable[rows], Columns[name]),
Table = Table.TransformColumnTypes(Rows, Table.ToList(ColumnsWithType, (c) => { c{0}, c{3}}))
in
Table
in AnalyticsQuery
Let’s transform the “TimeGenerated” column to hour and click “Close & Apply”.
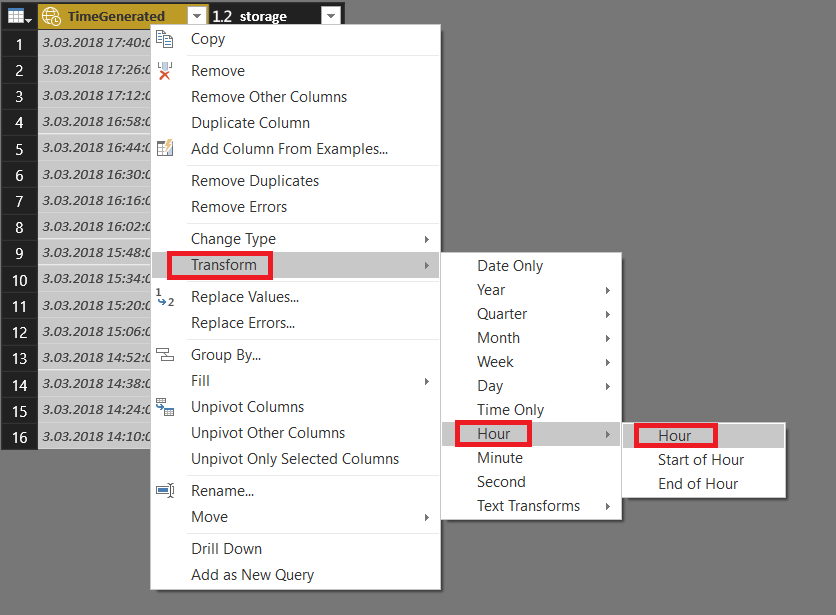
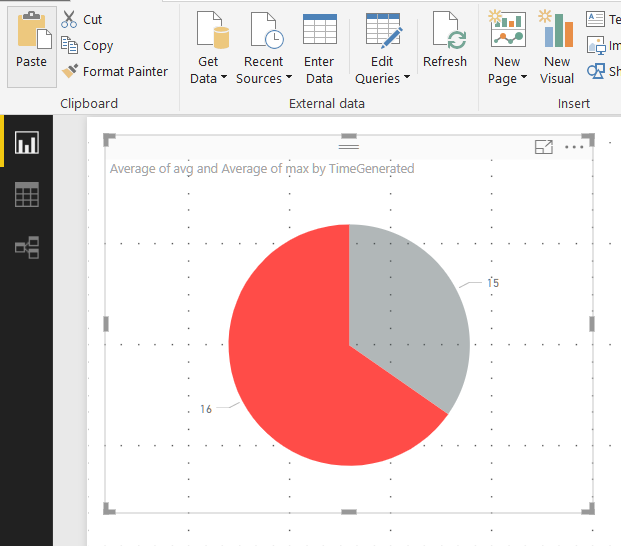
Add a pie chart and then drag and drop columns to this chart.
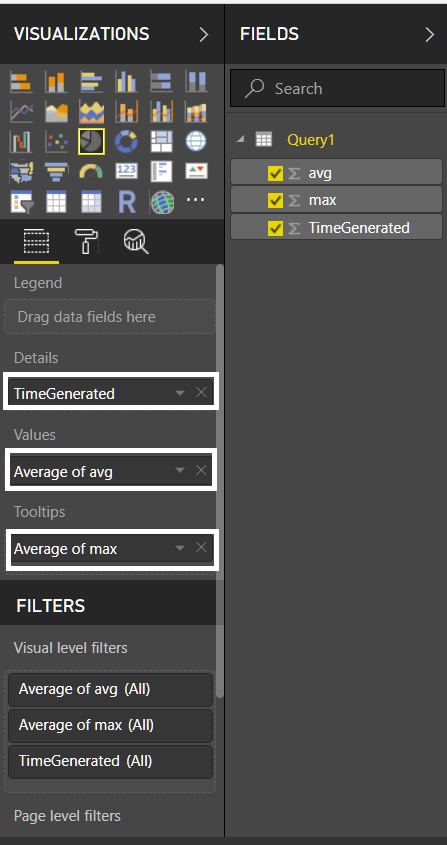
The pie chart will show utilization DTU by hours.
Now, let’s examine “LOG ANALYTICS”. We can find several performance counters in here. Some of these are queries, data waits, events, and SQLInsights.
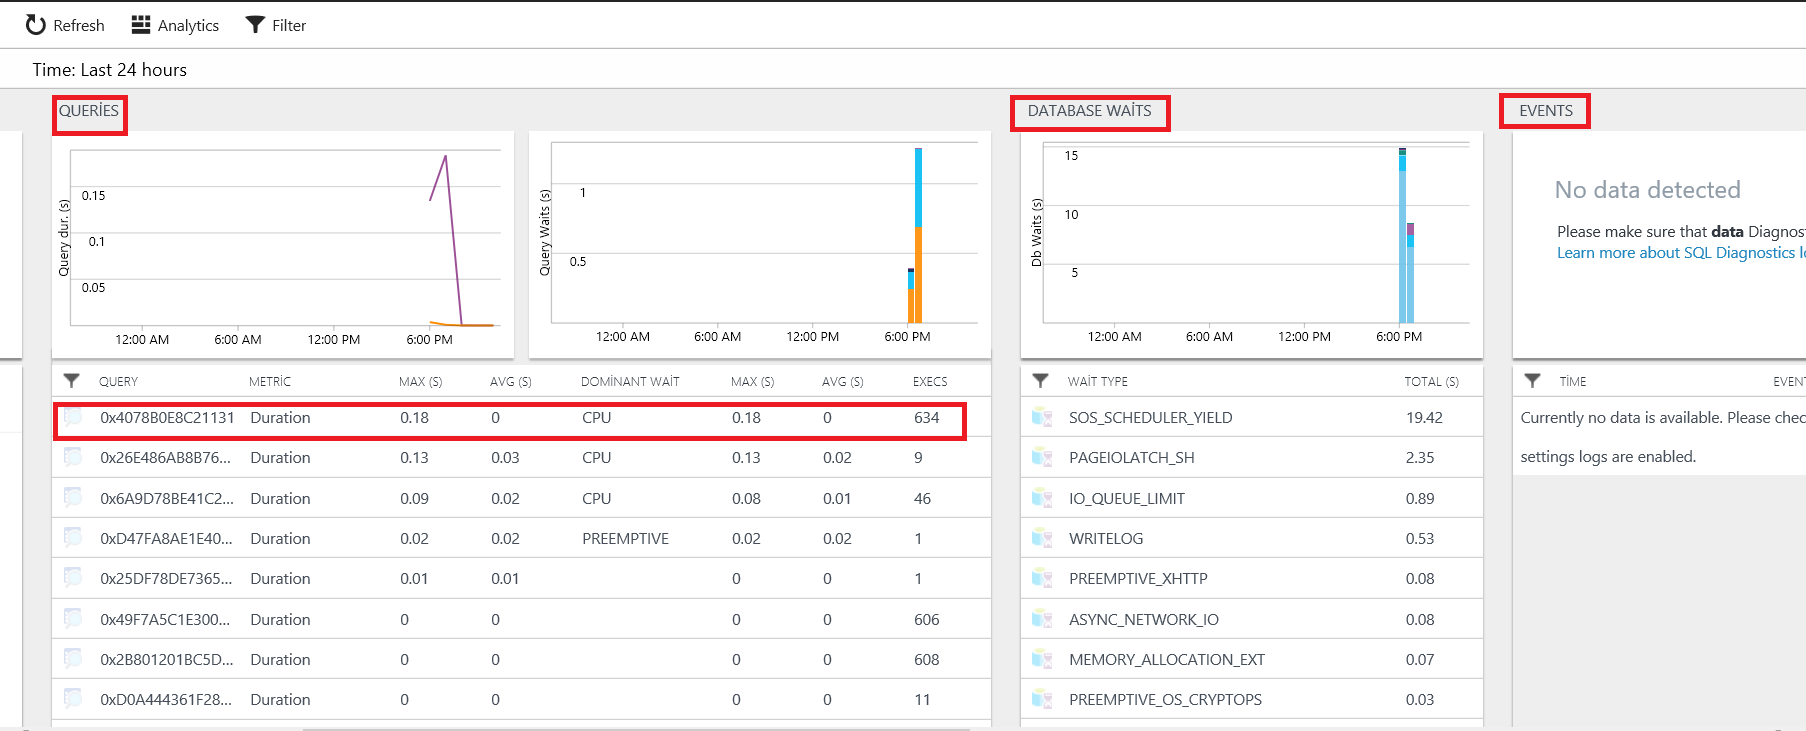
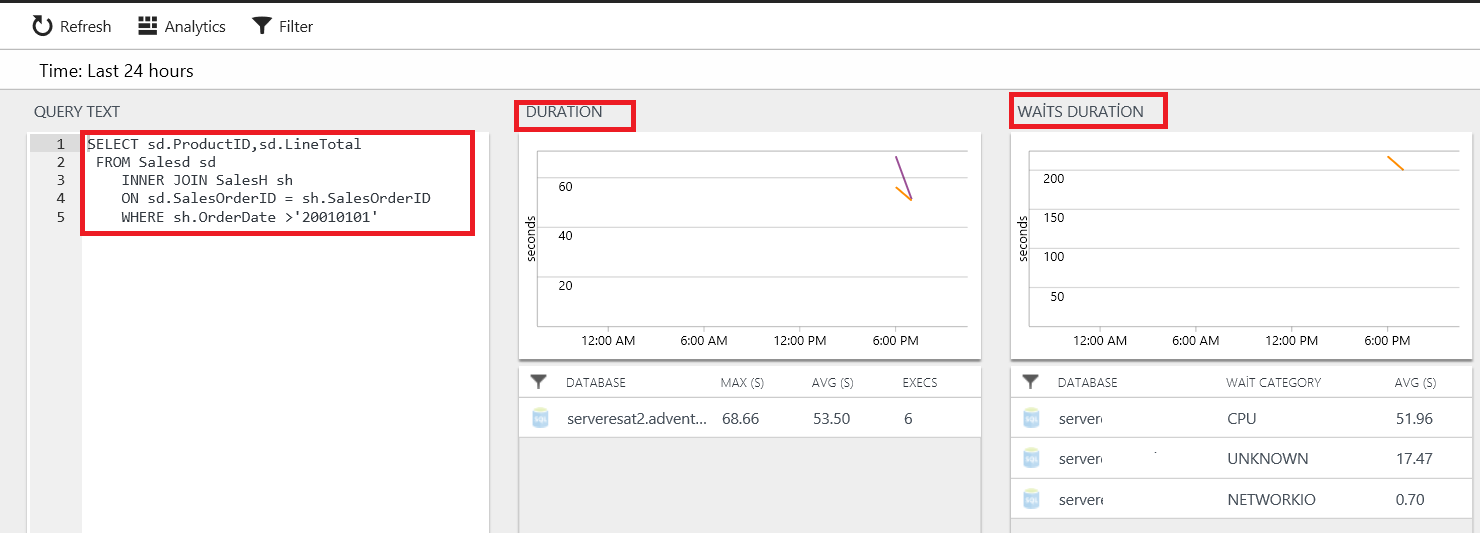
When we click rows on this screen, we can find a lot of details about this measurement.
Conclusion
In this article, we discussed Azure SQL Analytics. Azure SQL Analytics offers performance monitoring in Azure SQL Servers and Azure SQL databases. This feature is very impressive for performance monitoring because you can measure and monitor the main metrics about SQL Azure. At the same time, you can integrate performance counters to Power BI and you can create your custom graphics and dashboards.
References
Monitor Azure SQL Database using Azure SQL Analytics (Preview) in Log Analytics
Tags: azure sql, performance Last modified: October 06, 2022