In this article, we will examine Database Scoped Configurations and SQL Server 2017 Automatic Plan Correction. Microsoft added new features to SQL Server 2017 that improved the query performance.
SQL Server query performance is related to quality and accuracy of the execution plan. When we run a query, the query optimizer analyzes a lot of execution plans and then decides on the optimal query execution plan.
Legacy Cardinality Estimation: The Cardinality Estimator predicts how many rows the query will return, as well as determines the memory allocation of the query.
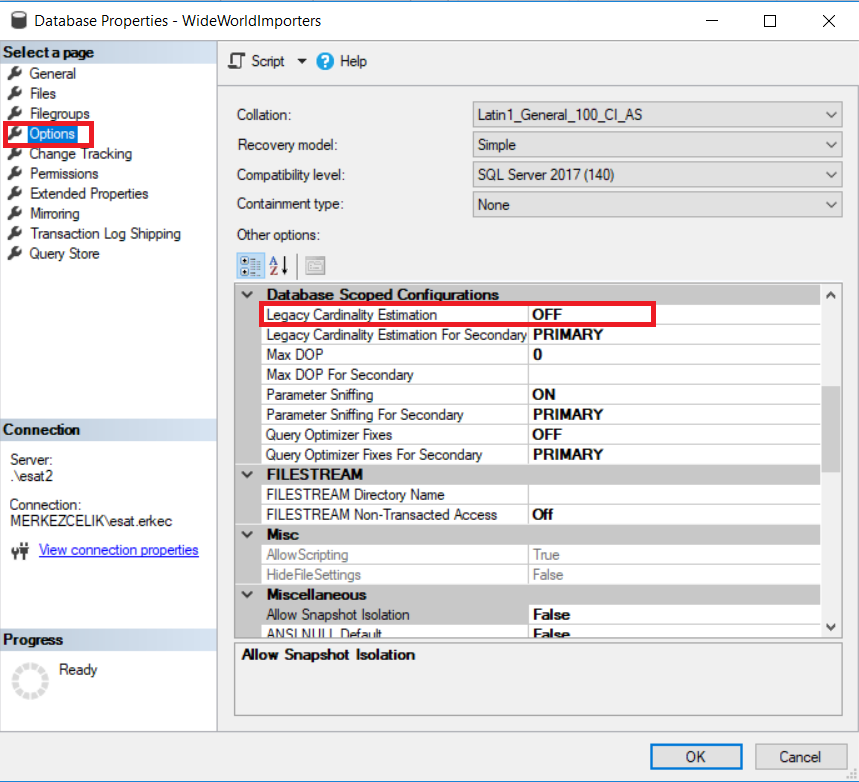
In SQL Server 2017, the default Cardinality Estimation Model Version is 14.0, but if you want to use the older version 7.0 of the Cardinality Estimator, you can do this by changing the Legacy Cardinality Estimation option in the Database Scoped Configurations section.
The default value of the Legacy Cardinality Estimation is OFF. Thus if you want to use the older version, you have to switch it to ON.
Alternatively, you can change this property in T-SQL.
ALTER DATABASE
    SCOPED CONFIGURATION
        SET LEGACY_CARDINALITY_ESTIMATION = OFF|ON;
However, if you enable this setting, it will affect all the queries. As a result, this may damage the query performance. To prevent this, you can use the FORCE_LEGACY_CARDINALITY_ESTIMATION hint.
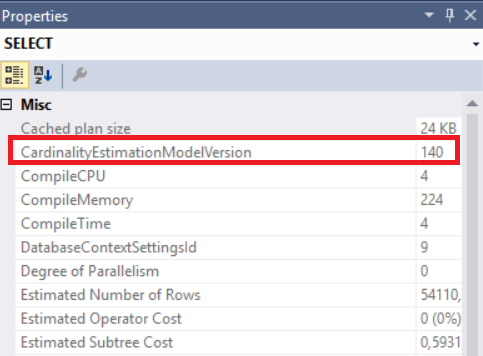
When we run this query in the WideWorldImporters database, it will automatically use a new version of the cardinality estimation.
SELECT
    [o].[CustomerID],
    o.LastEditedBy ,
    [o].[OrderDate]


FROM Sales.Orders o

WHERE [o].[OrderDate] >= '20140101'
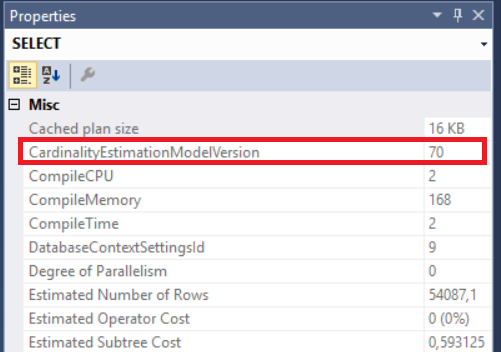
When we add FORCE_LEGACY_CARDINALITY_ESTIMATION to the query, the query optimizer will use the previous or oldest version of the cardinality estimation.
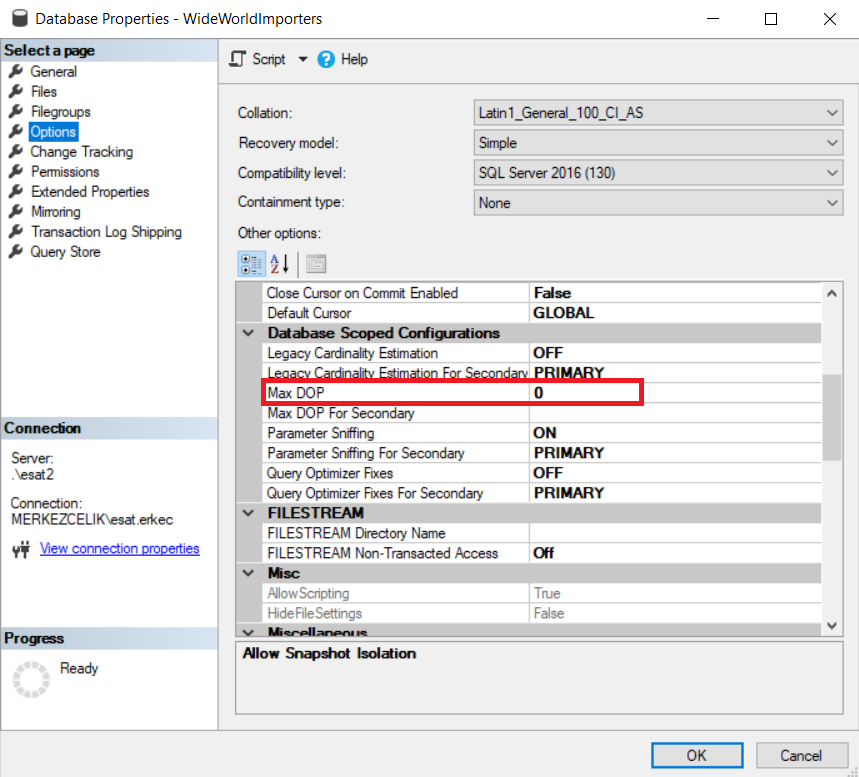
MAXDOP: we can set the maximum degree of parallelism for an individual database. Before this feature had been created, we could only configure the MAXDOP server level.
The MAXDOP query hint allows us to run queries in parallel.
ALTER DATABASE  SCOPED CONFIGURATION
 SET MAXDOP = 4;
 GO
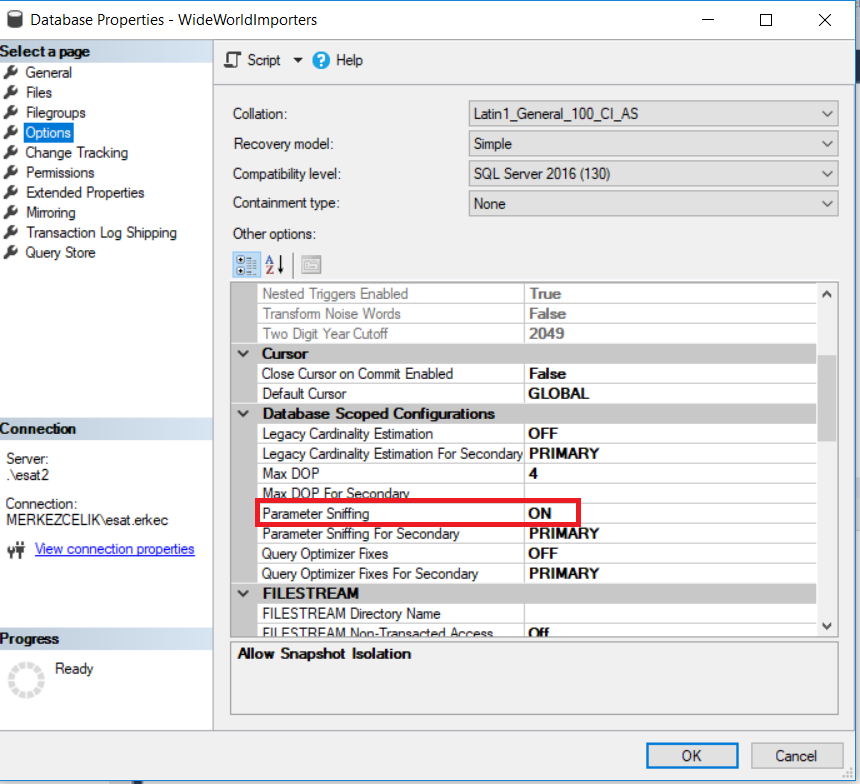
Parameter Sniffing: When a query execution time changes dramatically and this time change is related to the query parameter, it is called a parameter sniffing.
Now, we will create a stored procedure on the AdventureWorks database. We will send different parameters and compare execution plans.
DROP PROCEDURE IF EXISTS Get_Orders
GO
CREATE PROCEDURE Get_Orderes
@ProductID INT
AS
SELECT SalesOrderDetailID, OrderQty
FROM Sales.SalesOrderDetail
WHERE ProductID = @ProductID;

GO
/*******
Don t use this script in production servers!
*******/
DBCC FREEPROCCACHE
--Query Mars
EXEC Get_OrderID_OrderQty @ProductID=870
DBCC FREEPROCCACHE
--Query Venus
EXEC Get_OrderID_OrderQty @ProductID=897
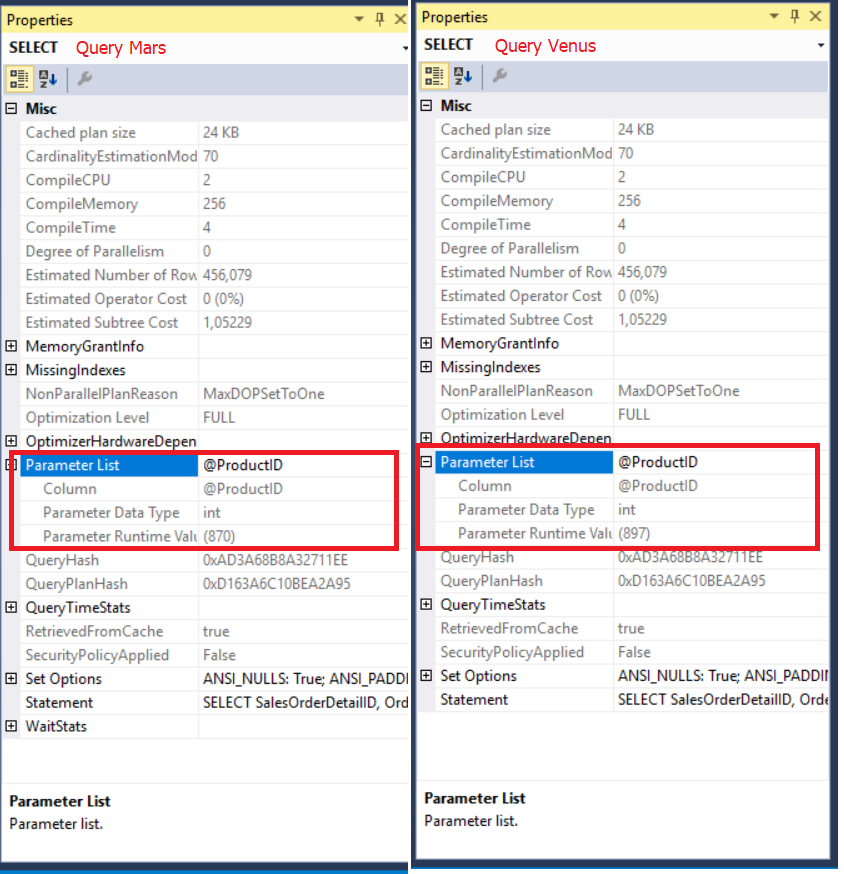
As shown in the below image, SQL Server generates a different execution plan for the same query. The Query Mars execution plan recommends an index. The query parameter changes the optimal execution plan.
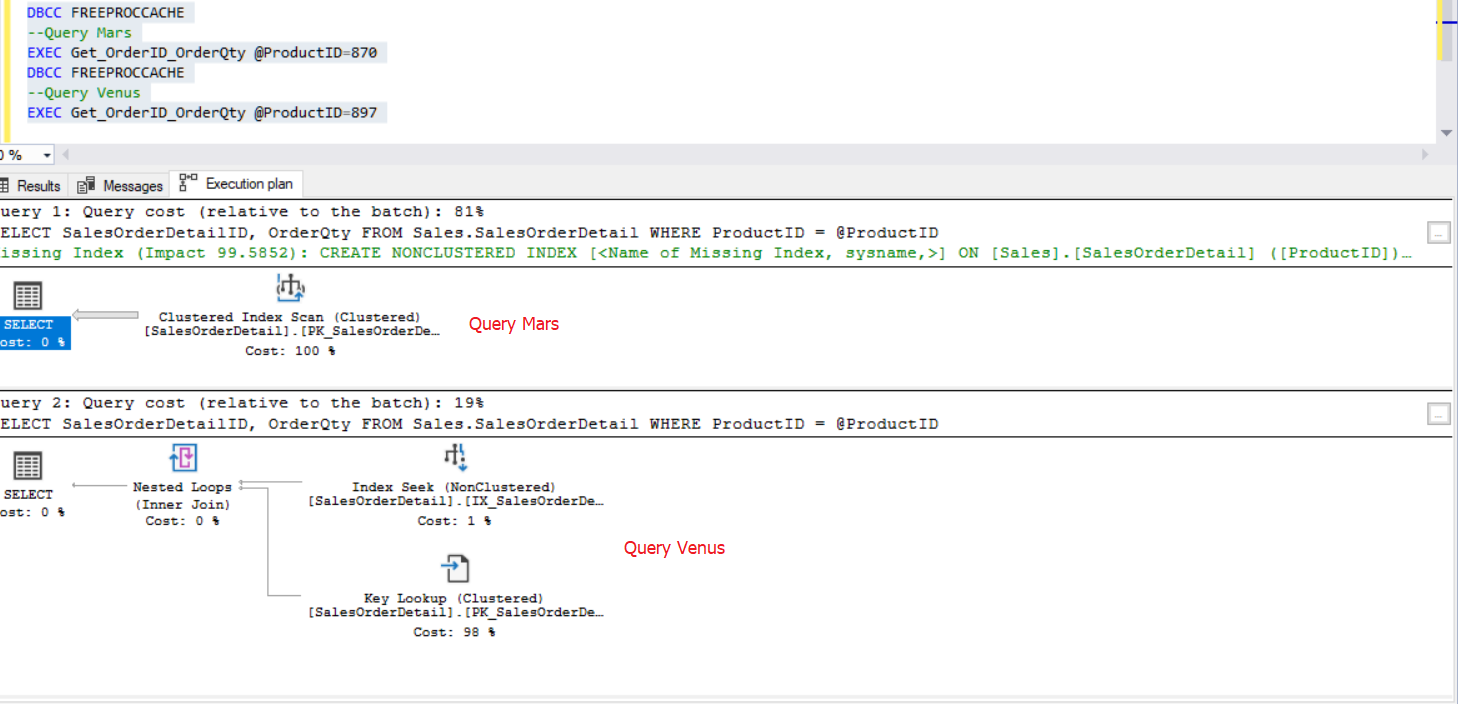
Execute this query and look at the execution plans.
DBCC FREEPROCCACHE
--Query Mars
EXEC Get_OrderID_OrderQty @ProductID=870

--Query Venus
EXEC Get_OrderID_OrderQty @ProductID=897
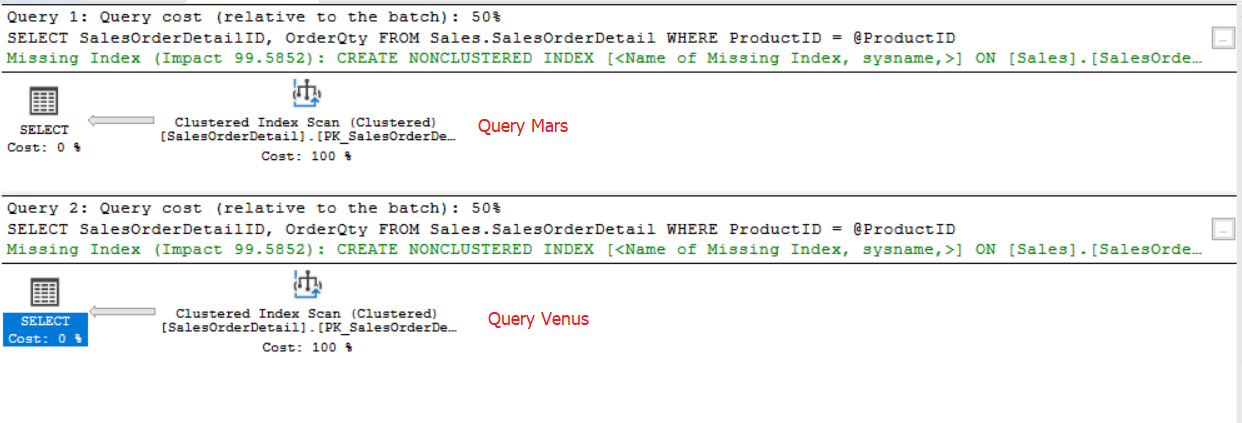
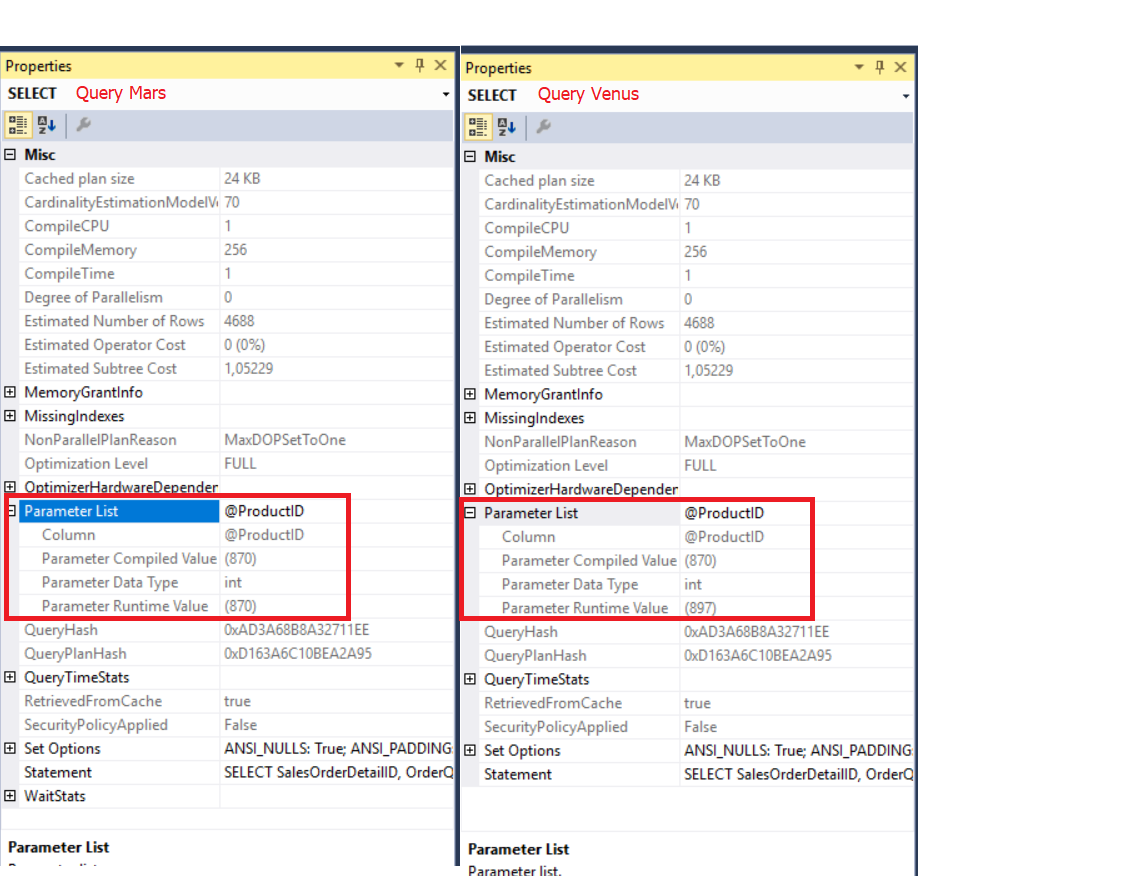
The Query Venus execution plan is the same as the Query Mars execution plan. This is the parameter sniffing because the cached execution plan is compiled for the Query Mars execution plan. For this reason, Query Venus uses the same execution plan.
Now, we will disable parameter sniffing and run the same queries.
ALTER DATABASE SCOPED CONFIGURATION SET PARAMETER_SNIFFING =OFF;
DBCC FREEPROCCACHE
--Query Mars
EXEC Get_OrderID_OrderQty @ProductID=870

--Query Venus
EXEC Get_OrderID_OrderQty @ProductID=897
Let’s examine:
The SQL Server Query optimizer generated the optimal execution plan for Query Venus and Query Mars. This approach provides the optimum performance to the query.
There are some options to avoid this issue:
- OPTION(RECOMPILE)
- OPTION (OPTIMIZE FOR(@VARIABLE=UNKNOWN))
Automatic Plan Correction
SQL Server 2017 includes a new feature called Automatic Plan Correction. When we execute a query, the query optimizer creates an execution plan. For some reasons, the query optimizer chooses wrong execution plans. Some of the reasons are as follows:
- A query that does not meet performance criteria
- Out of date statistics
- Unsuitable indexes
When the SQL Server query optimizer decides to change the execution plan and this execution plan damages the performance, the query performance is called the plan regression. A new feature comes with SQL Server 2016. This tool helps in monitoring and troubleshooting query performance and at the same time stores performance metrics and counters of the query execution.
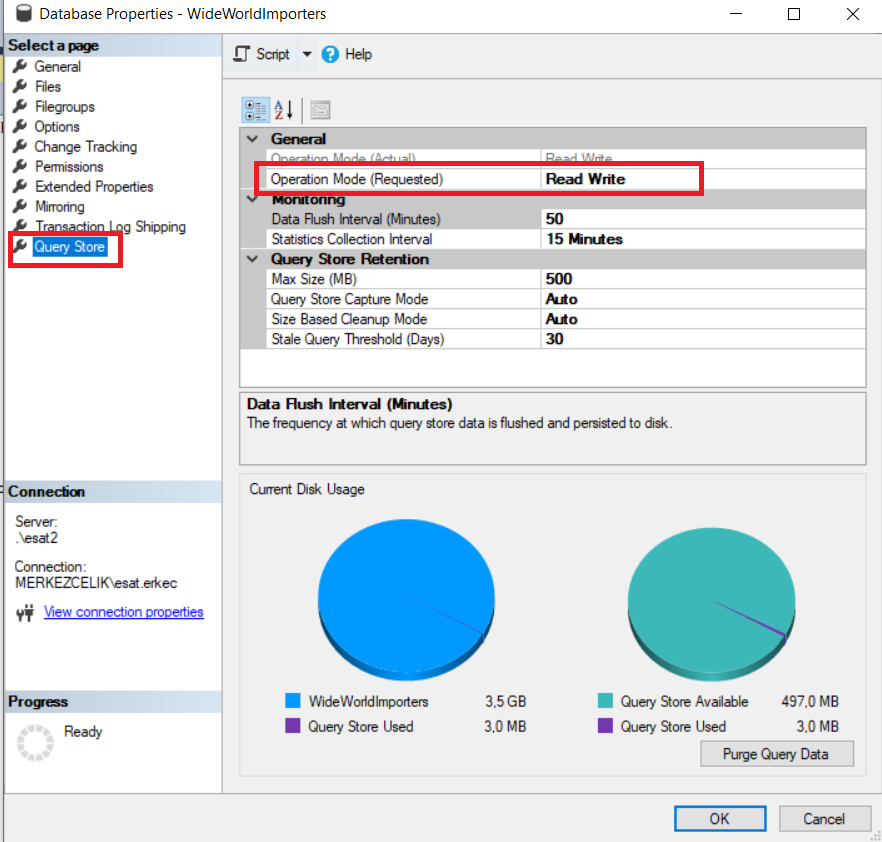
We can enable these options under database properties.
Now, we are going to make a demo of this feature. First of all, clear the procedure cache and create a stored procedure.
/****************************************
Don t use this script in production servers
*****************************************/

USE WideWorldImporters
ALTER DATABASE WideWorldImporters SET QUERY_STORE = ON;
ALTER DATABASE [WideWorldImporters] SET QUERY_STORE CLEAR ALL
DBCC FREEPROCCACHE  --This command will clear all procedure cache in SQL Server. Dont try in production envoierment--
ALTER DATABASE WideWorldImporters SET AUTOMATIC_TUNING (FORCE_LAST_GOOD_PLAN = OFF);
 DROP PROCEDURE IF EXISTS Test_CoddingSight2
 GO
 CREATE PROC Test_CoddingSight2
 @Id AS INT
 AS
 select sum([UnitPrice]*[Quantity])
 from Sales.OrderLines O
 INNER JOIN sales.Orders o1 ON o1.OrderID = o.OrderID
 where o.PackageTypeID = @Id
At this step, we will execute this procedure with different parameters and find the execution time difference.
--Query Alpha
DBCC FREEPROCCACHE
EXEC Test_CoddingSight2 7
GO 80

DBCC FREEPROCCACHE
EXEC Test_CoddingSight2 -1
--Query Beta
EXEC Test_CoddingSight2 7
GO 80
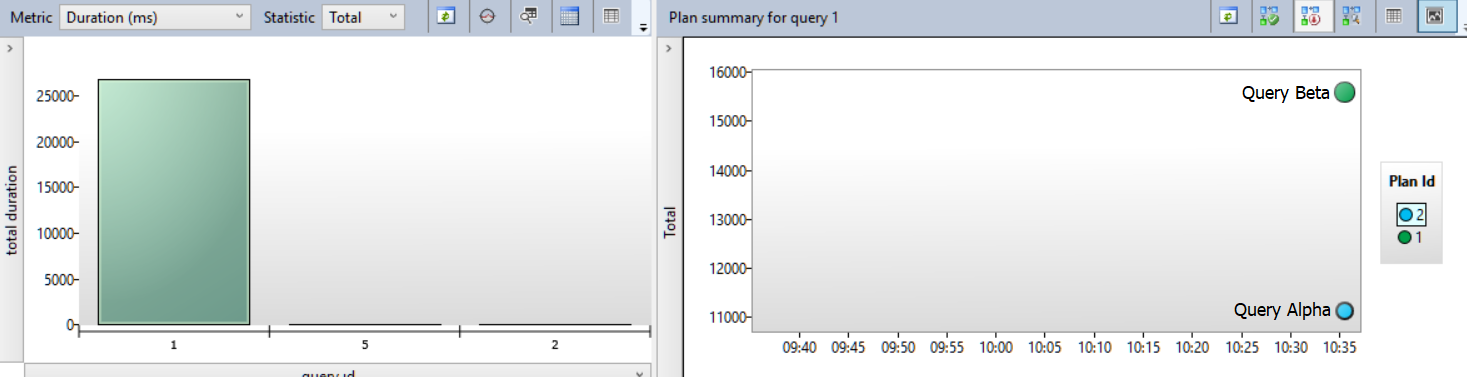
As you can see, the first query was completed in 12 sec, while the second one was done in 33 sec. The reason for this dramatic difference is that the query optimizer chooses an unsuitable execution plan for Query Beta.
Let’s compare the execution plans of Query Alpha and Query Beta.
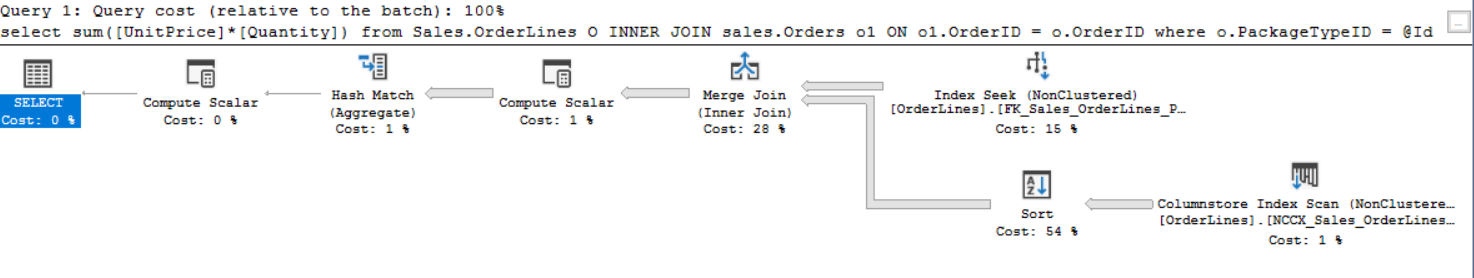
Execution plan of Query Alpha
Execution plan of Query Beta
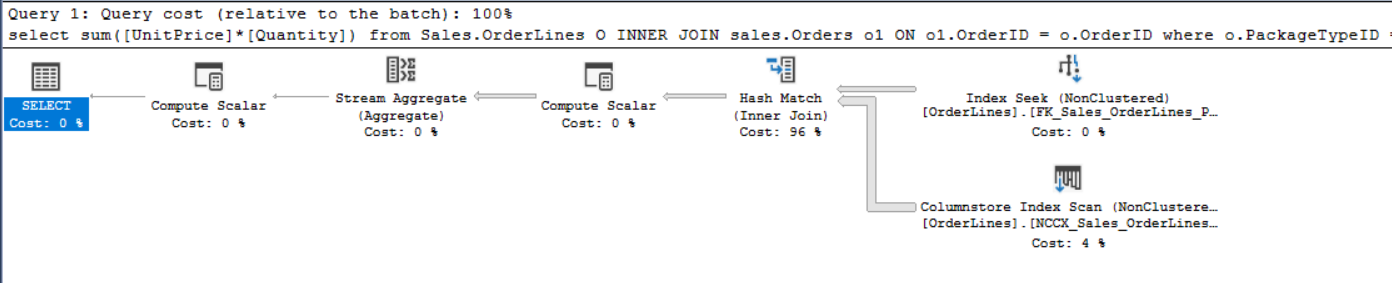
In the images above, the query optimizer creates different execution plans for the same query. When we look at Top Resources Consuming Queries, we can see that Query Beta consumes more resources than Query Alpha.
The below query will return detailed information on the tuning recommendations.
SELECT name, reason, score,
JSON_VALUE(details, '$.implementationDetails.script') as script,
        details.*
FROM sys.dm_db_tuning_recommendations
    CROSS APPLY OPENJSON(details, '$.planForceDetails')
                WITH (  query_id int '$.queryId',
                        regressed_plan_id int '$.regressedPlanId',
                        last_good_plan_id int '$.recommendedPlanId') as details
WHERE JSON_VALUE(state, '$.currentValue') = 'Active'
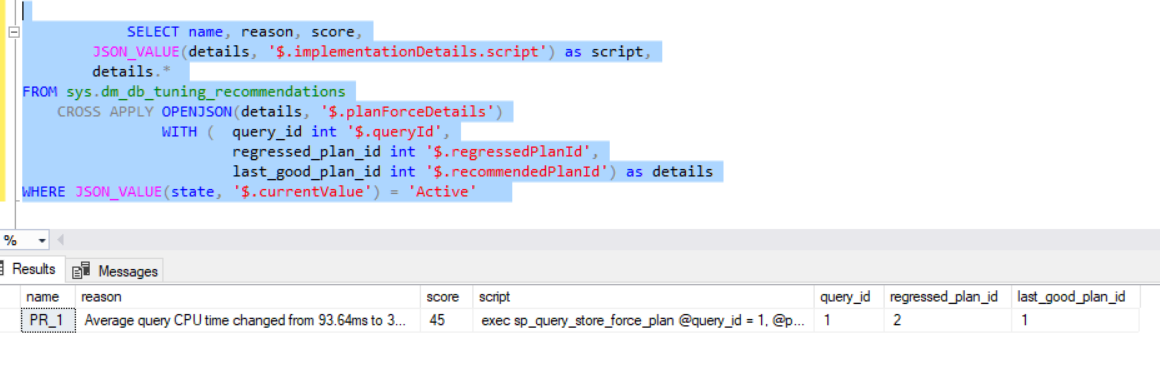
The reason column shows why we have to apply this recommendation.
Now, we will re-run Query Alpha and Query Beta with the automatic plan correction enabled.
/****************************************
Don't use this script in production servers
*****************************************/

ALTER DATABASE [WideWorldImporters] SET QUERY_STORE CLEAR ALL
DBCC FREEPROCCACHE

/****************************************
Enable Automatic Plan Correction
*****************************************/


ALTER DATABASE WideWorldImporters SET AUTOMATIC_TUNING (FORCE_LAST_GOOD_PLAN = ON);

--Query Alpha
DBCC FREEPROCCACHE
EXEC Test_CoddingSight2 7
GO 80


DBCC FREEPROCCACHE
EXEC Test_CoddingSight2 -1
--Query Beta
EXEC Test_CoddingSight2 7
GO 80
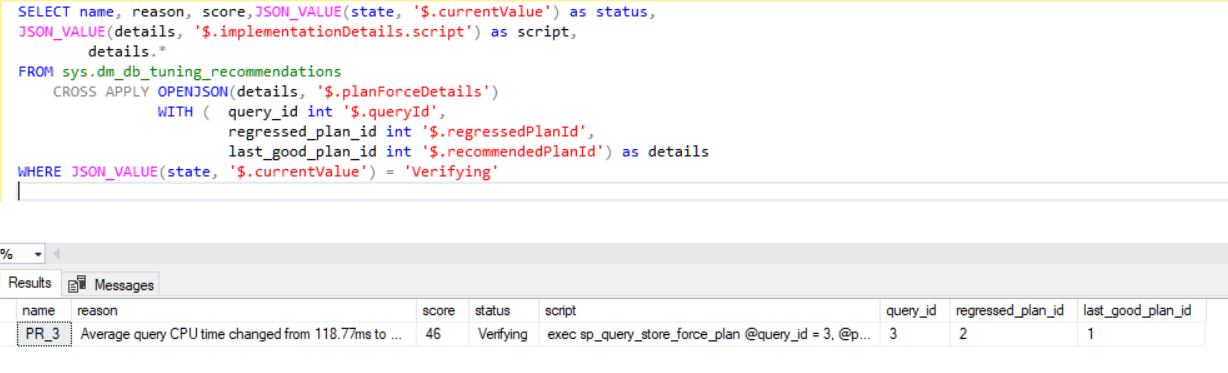
After this demo, the Query Alpha execution plan is applied to the Query Beta. Additionally, the Query Alpha and Query Beta execution times are close to each other. The below query will return the automatic plan correction status.
SELECT name, reason, score,JSON_VALUE(state, '$.currentValue') as status,
JSON_VALUE(details, '$.implementationDetails.script') as script,
        details.*
FROM sys.dm_db_tuning_recommendations
    CROSS APPLY OPENJSON(details, '$.planForceDetails')
                WITH (  query_id int '$.queryId',
                        regressed_plan_id int '$.regressedPlanId',
                        last_good_plan_id int '$.recommendedPlanId') as details
WHERE JSON_VALUE(state, '$.currentValue') = 'Verifying'
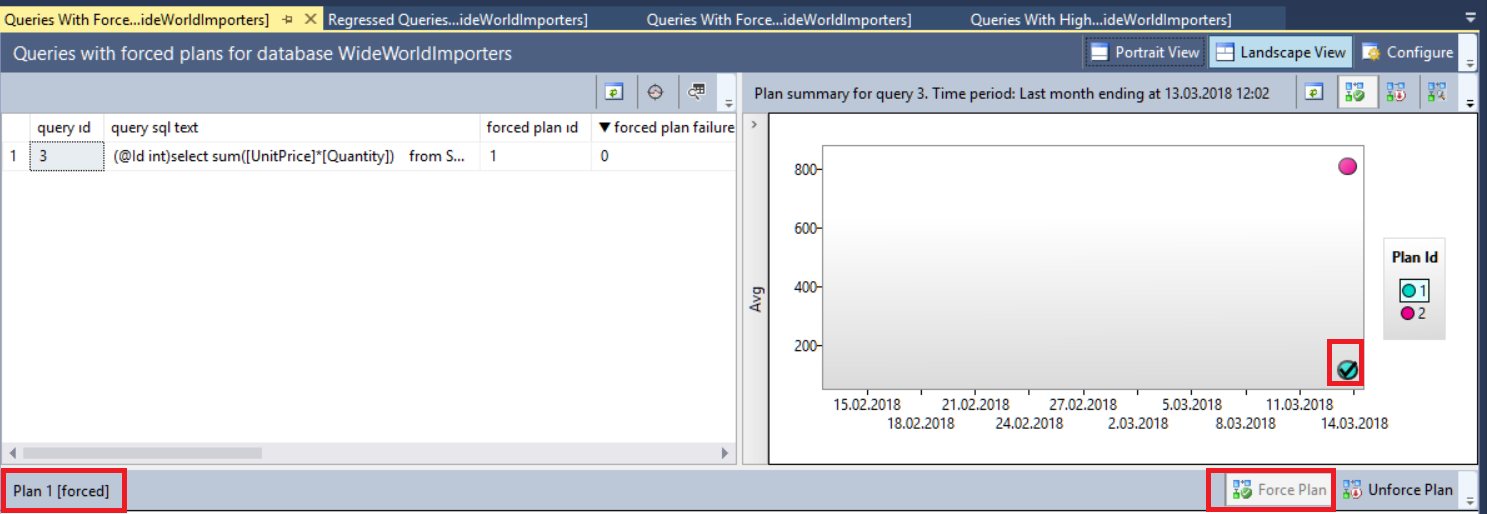
Also, we can find some graphical information in Queries with Forced Plans. This graph defines the forced query plans and query.
References
Automatic plan correction in SQL Server 2017
Tags: execution plan, query performance, sql server 2017 Last modified: September 22, 2021