Let us start our SQL journey to understand aggregating data in SQL and types of aggregations including simple and sliding aggregations.
Before we jump to the aggregations, it is worth considering interesting facts often missed by some developers when it comes to SQL in general and the aggregation in particular.
In this article, SQL refers to T-SQL which is the Microsoft version of SQL and has more features than the standard SQL.
Maths behind SQL
It is very important to understand that T-SQL is based on some solid maths concepts although it is not a rigid maths based language.
According to the book “Microsoft_SQL_Server_2008_T_SQL_Fundamentals” by Itzik Ben-Gan, SQL is designed to query and manage data in a relational database management system (RDBMS).
The relational database management system itself is based on two solid mathematical branches:
- Set Theory
- Predicate Logic
Set Theory
Set theory, as the name indicates, is a branch of mathematics about sets which can also be called collections of definite distinct objects.
In short, in set theory, we think of things or objects as a whole in the same way we think of an individual item.
For example, a book is a set of all the definite distinct books, so, we take a book as a whole which is enough to get details of all the books in it.
Predicate Logic
Predicate logic is a Boolean logic which returns true or false depending on the condition or values of the variables.
Predicate logic can be used to enforce integrity rules (price must be greater than 0.00) or filter data (where price is more than 10.00), however, in the context of T-SQL, we have three logic values as follows:
- True
- False
- Unknown (Null)
This can be illustrated as follows:
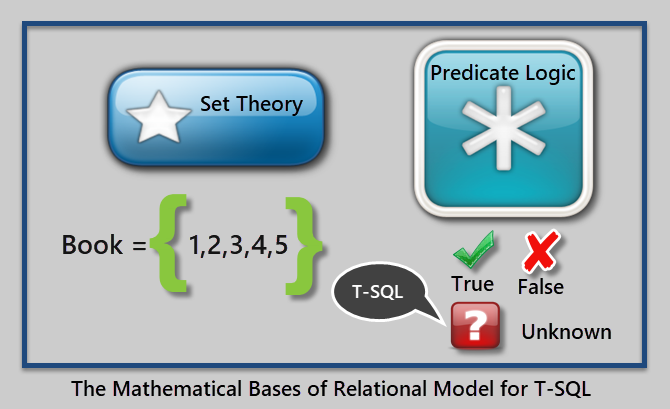
An example of a predicate is “Where Price of Book is greater than 10.00”.
That’s enough about maths, but please keep in mind that I am going to refer to it later in the article.
Why Aggregating Data in SQL is Easy
Aggregating data in SQL in its simplest form is all about getting to know about the totals in one go.
For example, if we have a customer table which contains a list of all the customers along with their details then aggregated data of the customer table can give us the total number of customers we have got.
As discussed earlier, we think of a set as a single item so we simply apply an aggregate function to the table to get the totals.
Since SQL is originally a set based language (as discussed earlier), so it is relatively easier to apply aggregate functions to it as compared to other languages.
For example, if we have a product table which has records of all the products in the database then we can straight away apply the count function to a product table to get the total number of products rather than counting them one by one in a loop.
Data Aggregation Recipe
In order to aggregate data in SQL, we need the following things at the minimum:
- Data (table) with columns which when aggregated makes sense
- An aggregate function to be applied on the data
Preparing Sample Data (Table)
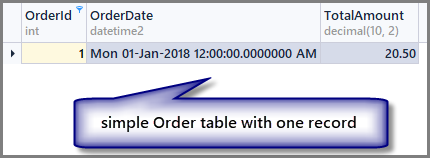
Let us take an example of a simple order table which contains three things (columns):
- Order number (OrderId)
- Date when order was placed (OrderDate)
- Amount of the order (TotalAmount)
Let us create the AggregateSample database to proceed further:
-- Create aggregate sample database
CREATE DATABASE AggregateSample
Now create the order table in the sample database as follows:
-- Create order table in the aggregate sample database
USE AggregateSample

CREATE TABLE SimpleOrder
  (OrderId INT PRIMARY KEY IDENTITY(1,1),
  OrderDate DATETIME2,
  TotalAmount DECIMAL(10,2)
  )
Populating Sample Data
Populate the table by adding one row:
INSERT INTO dbo.SimpleOrder
(
  OrderDate
 ,TotalAmount
)
VALUES
(
  '20180101' -- OrderDate - datetime2
 ,20.50 -- TotalAmount - decimal(10, 2)
);
GO
Let us look at the table now:
-- View order table
SELECT OrderId ,OrderDate ,TotalAmount FROM SimpleOrder
Please note that I am using dbForge Studio for SQL Server in this article so only the output look may differ if you run the same code in SSMS (SQL Server Management Studio), there is no difference as far as scripts and their results are concerned.
Basic Aggregate Functions
The basic aggregate functions that can be applied to the table are as follows:
- Sum
- Count
- Min
- Max
- Average
Aggregating Single Record Table
Now the interesting question is, “can we aggregate (sum or count) data (records) in a table if it has only one row as in our case?” The answer is “Yes”, we can, although it does not make much sense but it can help us to understand how data gets ready for aggregation.
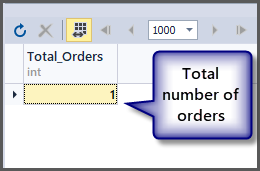
In order to get the total number of orders, we use the count() function with the table, as discussed earlier, we can simply apply the aggregate function to the table since SQL is a set based language and operations can be applied to a set directly.
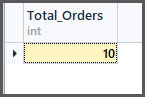
-- Getting total number of orders placed so far
SELECT COUNT(*) AS Total_Orders FROM SimpleOrder
Now, what about the order with a minimum, maximum and average amount for a single record:
-- Getting order with minimum amount, maximum amount, average amount and total orders
SELECT
  COUNT(*) AS Total_Orders
 ,MIN(TotalAmount) AS Min_Amount
 ,MAX(TotalAmount) AS Max_Amount
 ,AVG(TotalAmount) Average_Amount
FROM SimpleOrder
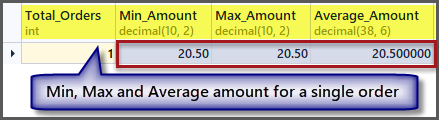
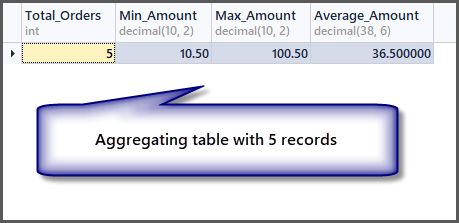
As we can see from the output, the minimum, maximum and average amount is the same if we have a single record, so applying an aggregate function to a single record is possible but it gives us the same results.
We need at least more than one record to make sense of the aggregated data.
Aggregating Multiple Records Table
Let us now add four more records as follows:
INSERT INTO dbo.SimpleOrder
(
  OrderDate
 ,TotalAmount
)
VALUES
(
  '20180101' -- OrderDate - datetime2
 ,20.50 -- TotalAmount - decimal(10, 2)
),
(
  '20180102' -- OrderDate - datetime2
 ,30.50 -- TotalAmount - decimal(10, 2)
),
(
  '20180103' -- OrderDate - datetime2
 ,10.50 -- TotalAmount - decimal(10, 2)
),
(
  '20180110' -- OrderDate - datetime2
 ,100.50 -- TotalAmount - decimal(10, 2)
);

GO
The table now looks as follows:
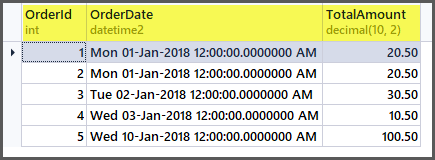
If we apply the aggregate functions to the table now, we are going to get good results:
-- Getting order with minimum amount, maximum amount, average amount and total orders
SELECT
  COUNT(*) AS Total_Orders
 ,MIN(TotalAmount) AS Min_Amount
 ,MAX(TotalAmount) AS Max_Amount
 ,AVG(TotalAmount) Average_Amount
FROM SimpleOrder
Grouping Aggregated Data
We can group the aggregated data by any column or set of columns to get aggregates based on that column.
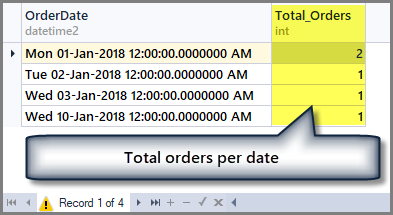
For example, if we want to know the total number of orders per date, we have to group the table by date using Group by clause as follows:
-- Getting total orders per date
SELECT
  OrderDate
 ,COUNT(*) AS Total_Orders
FROM SimpleOrder
GROUP BY OrderDate
The output is as follows:
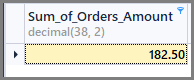
So if we want to see the sum of all the order amount, we can simply apply the sum function to the total amount column without any grouping as follows:
-- Sum of all the orders amount
SELECT
  SUM(TotalAmount) AS Sum_of_Orders_Amount
FROM SimpleOrder
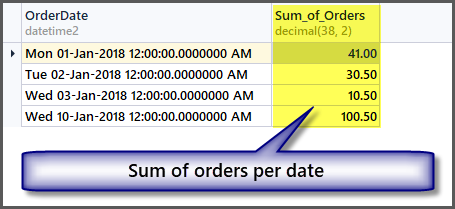
In order to get the sum of orders amount per date, we simply add group by date to the above SQL statement as follows:
-- Sum of	all	the	orders amount per date
SELECT
  OrderDate
 ,SUM(TotalAmount) AS Sum_of_Orders
FROM SimpleOrder
GROUP BY OrderDate
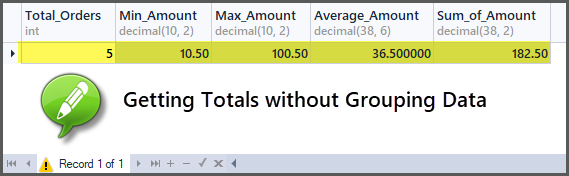
Getting Totals without Grouping Data
We can straight away get totals such as total orders, maximum order amount, minimum order amount, sum of orders amount, average order amount without the need of grouping it if the aggregation is meant for all the tables.
-- Getting order with minimum amount, maximum amount, average amount, sum of amount and total orders
SELECT
  COUNT(*) AS Total_Orders
 ,MIN(TotalAmount) AS Min_Amount
 ,MAX(TotalAmount) AS Max_Amount
 ,AVG(TotalAmount) AS Average_Amount
 ,SUM(TotalAmount) AS Sum_of_Amount
FROM SimpleOrder
Adding Customers to the Orders
Let us add some fun by adding customers in our table. We can do this by creating another table of customers and passing customer id to the orders table, however to keep it simple and to mock data warehouse style (where tables are denormalised), I am adding the customer name column in the order table as follows:
-- Adding CustomerName column and data to the order table
ALTER TABLE SimpleOrder
ADD CustomerName VARCHAR(40) NULL
  GO

UPDATE SimpleOrder
SET CustomerName = 'Eric'
WHERE OrderId = 1
GO

UPDATE SimpleOrder
SET CustomerName = 'Sadaf'
WHERE OrderId = 2
GO

UPDATE SimpleOrder
SET CustomerName = 'Peter'
WHERE OrderId = 3
GO

UPDATE SimpleOrder
SET CustomerName = 'Asif'
WHERE OrderId = 4
GO

UPDATE SimpleOrder
SET CustomerName = 'Peter'
WHERE OrderId = 5
GO
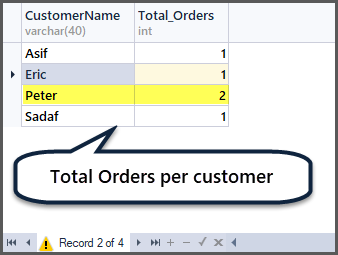
Getting Total Orders per Customer
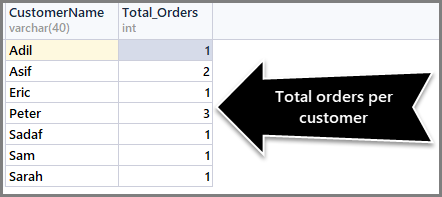
Can you guess now how to get total orders per customer? You need to group by customer (CustomerName) and apply the aggregate function count() to all the records as follows:
-- Total orders per customer
  SELECT CustomerName,COUNT(*) AS Total_Orders FROM SimpleOrder
    GROUP BY CustomerName
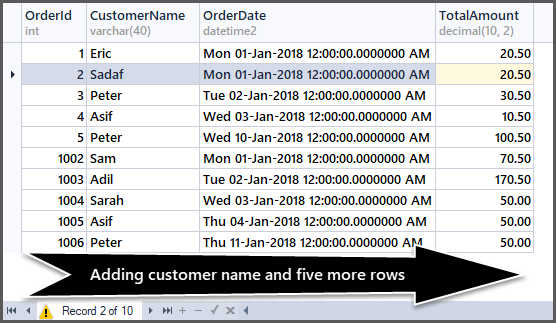
Adding Five More Records to the Order Table
Now we are going to add five more rows to the simple order table as follows:
-- Adding 5 more records to order table
INSERT INTO SimpleOrder (OrderDate, TotalAmount, CustomerName)
  VALUES
  ('01-Jan-2018', 70.50, 'Sam'),
  ('02-Jan-2018', 170.50, 'Adil'),
  ('03-Jan-2018',50.00,'Sarah'),
  ('04-Jan-2018',50.00,'Asif'),
  ('11-Jan-2018',50.00,'Peter')
GO
Have a look at the data now:
-- Viewing order table after adding customer name and five more rows
SELECT OrderId,CustomerName,OrderDate,TotalAmount FROM SimpleOrder
GO
Getting Total Orders per customer sorted by maximum to minimum orders
If you are interested in the total orders per customer sorted by maximum to minimum orders, it is not at all a bad idea to break this into smaller steps as follows:
-- (1) Getting total orders
SELECT COUNT(*) AS Total_Orders FROM SimpleOrder
-- (2) Getting total orders per customer
SELECT CustomerName,COUNT(*) AS Total_Orders FROM SimpleOrder
GROUP BY CustomerName
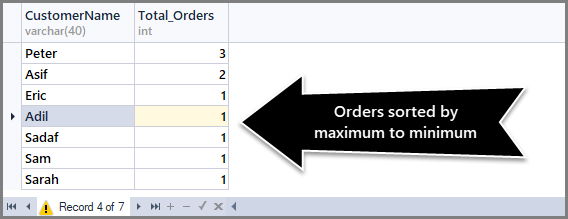
To sort orders count from maximum to minimum, we need to use the Order By DESC (descending order) clause with count() at the end as follows:
-- (3) Getting total orders per customer from maximum to minimum orders
SELECT CustomerName,COUNT(*) AS Total_Orders FROM SimpleOrder
GROUP BY CustomerName
ORDER BY COUNT(*) DESC
Getting Total Orders per date sorted by most recent order first
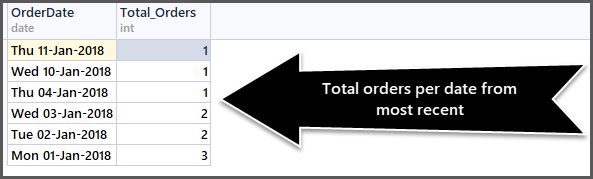
Using the above method we can now find out the total orders per date sorted by most recent order first as follows:
-- Getting total orders per date from most recent first
SELECT CAST(OrderDate AS DATE) AS OrderDate,COUNT(*) AS Total_Orders FROM SimpleOrder
GROUP BY OrderDate
ORDER BY OrderDate DESC
The CAST function helps us to get the date part only. The output is as follows:
You can use as many combinations as possible as long as they make sense.
Running Aggregations
Now that we are familiar with applying aggregate functions to our data, let us move on to the advanced form of aggregations and one such aggregation is the running aggregation.
Running aggregations are the aggregations applied to a subset of data rather than to the whole dataset which helps us to create small windows on the data.
So far we have seen all the aggregate functions are applied to all the rows of the table which can be grouped by some column such as order date or customer name, but with running aggregations we have the freedom to apply the aggregate functions without grouping the whole dataset.
Obviously, this means we can apply the aggregate function without using the Group By clause which is somewhat strange to those SQL beginners (or sometimes some developers overlook this) who are not familiar with the windowing functions and running aggregations.
Windows on Data
As said earlier, the running aggregation is applied to a subset of dataset or (in other words) on small windows of data.
Think of windows as a set(s) within a set or a table(s) within a table. A good example of windowing on data in our case is, we have the order table which contains orders placed on different dates, so what if each date is a separate window, then we can apply aggregate functions on each window the same way we applied to the table.
If we sort the order table (SimpleOrder) by order date (OrderDate) as follows:
-- View order table sorted by order date
SELECT so.OrderId
      ,so.OrderDate
      ,so.TotalAmount
      ,so.CustomerName FROM SimpleOrder so
  ORDER BY so.OrderDate
Windows on data ready for running aggregations can be see below:
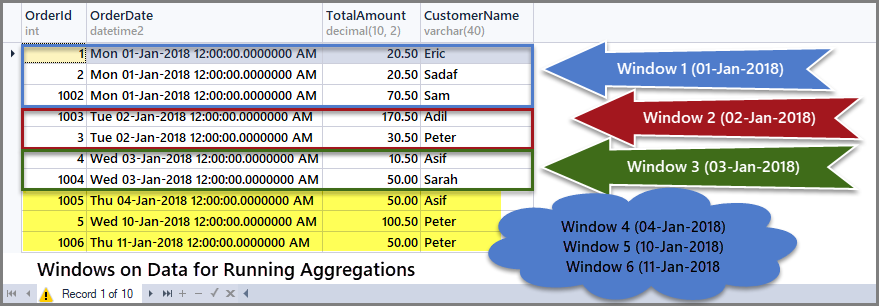
We can also consider these windows or subsets as six mini order date based tables and aggregates can be applied on each of these mini tables.
Use of Partition By inside OVER() Clause
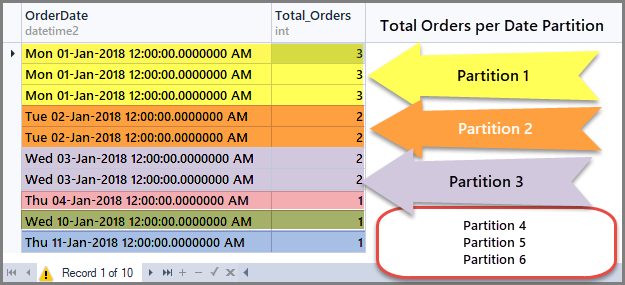
Running aggregations can be applied by partitioning the table using “Partition by” inside OVER() clause.
For example, if we want to partition the order table by dates such as each date is a sub-table or window on dataset, then we have to Partition data by order date and this can be achieved by using an aggregate function such as COUNT() with OVER() and Partition by inside OVER() as follows:
-- Running Aggregation on Order table by partitioning by dates
SELECT OrderDate, Total_Orders=COUNT(*) OVER(PARTITION BY OrderDate)  FROM SimpleOrder
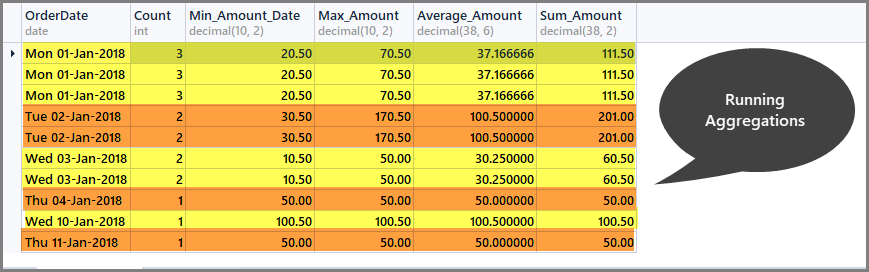
Getting Running Totals per Date window (Partition)
Running aggregations help us to limit the aggregation scope to the defined window only and we can get running totals per window as follows:
-- Getting total orders, minimum amount, maximum amount, average amount and sum of all amounts per date window (partition by date)
SELECT CAST (OrderDate AS DATE) AS OrderDate,
  Count=COUNT(*) OVER (PARTITION BY OrderDate),
  Min_Amount=MIN(TotalAmount) OVER (PARTITION BY OrderDate) ,
  Max_Amount=MAX(TotalAmount) OVER (PARTITION BY OrderDate) ,
  Average_Amount=AVG(TotalAmount) OVER (PARTITION BY OrderDate),
  Sum_Amount=SUM(TotalAmount) OVER (PARTITION BY OrderDate)
  FROM SimpleOrder
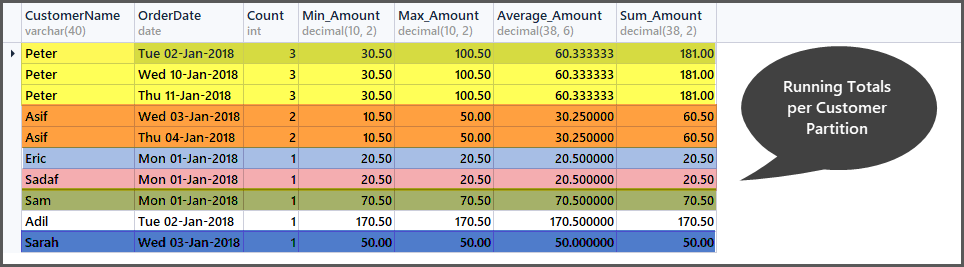
Getting Running Totals per Customer Window (Partition)
Just like the running totals per date window, we can also compute running totals per customer window by partitioning the order set (table) into small customers subsets (partitions) as follows:
-- Getting total orders, minimum amount, maximum amount, average amount and sum of all amounts per customer window (partition by customer)
SELECT CustomerName,
CAST (OrderDate AS DATE) AS OrderDate,
  Count=COUNT(*) OVER (PARTITION BY CustomerName),
  Min_Amount=MIN(TotalAmount) OVER (PARTITION BY CustomerName) ,
  Max_Amount=MAX(TotalAmount) OVER (PARTITION BY CustomerName) ,
  Average_Amount=AVG(TotalAmount) OVER (PARTITION BY CustomerName),
  Sum_Amount=SUM(TotalAmount) OVER (PARTITION BY CustomerName)
  FROM SimpleOrder
  ORDER BY Count DESC,OrderDate
Sliding Aggregations
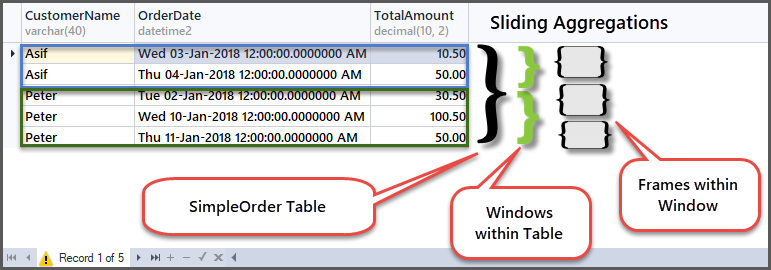
Sliding aggregations are the aggregations that can be applied to the frames within a window that means narrowing the scope further within the window (partition).
In other words, running totals give us totals (sum, average, min, max, count) for the whole window (subset) we create within a table, while sliding totals give us totals (sum, average, min, max, count) for the frame (subset of subset) within the window (subset) of the table.
For example, if we create a window on data based on (partition by customer) customer then we can see customer “Peter” has three records in its window and all the aggregations are applied to these three records. Now if we want to create a frame for two rows only at a time that means aggregation is further narrowed down and it is then applied to the first and second rows and then the second and third rows and so on.
Use of ROWS <Number> PRECEEDING with Order By inside OVER() Clause
Sliding aggregations can be applied by adding ROWS <number of rows> PRECEEDING with Order By (after Partition By) while ROWS <number> PRECEEDING determine the scope of Frame within the window.
For example, if we want to aggregate data for only two rows at a time for each customer then we need sliding aggregations to be applied to the order table as follows:
-- Getting minimum amount, maximum amount, average amount per frame per customer window
SELECT CustomerName,
 Min_Amount=Min(TotalAmount) OVER (PARTITION BY CustomerName ORDER BY OrderDate ROWS 1 PRECEDING),
 Max_Amount=Max(TotalAmount) OVER (PARTITION BY CustomerName ORDER BY OrderDate ROWS 1 PRECEDING) ,
 Average_Amount=AVG(TotalAmount) OVER (PARTITION BY CustomerName ORDER BY OrderDate  ROWS 1 PRECEDING)
 FROM SimpleOrder so
 ORDER BY CustomerName
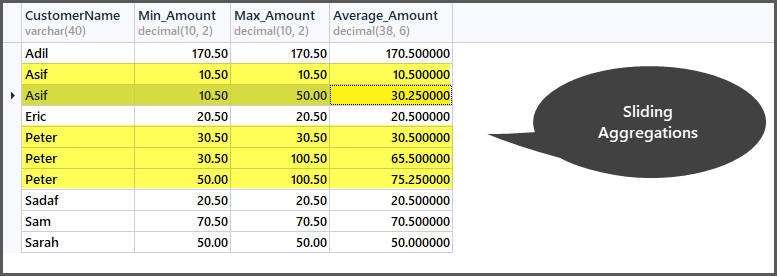
In order to understand how it works, let us look at the original table in the context of frames and windows:
In the first row of customer Peter window, he placed an order having the amount of 30.50 as this is the beginning of the frame within the customer window, so min and max are the same as there is no previous row to compare with.
Next, the minimum amount remains same but the maximum becomes 100.50 as the previous row (first row) amount is 30.50 and this row amount is 100.50, so the maximum of the two is 100.50.
Next, moving to the third row, the comparison will take place with the second row so the minimum amount of the two is 50.00 and the maximum amount of the two rows is 100.50.
MDX Year to Date (YTD) Function and Running Aggregations
MDX is a multidimensional expression language used to query multidimensional data (such as cube) and is used in business intelligence (BI) solutions.
According to https://docs.microsoft.com/en-us/sql/mdx/ytd-mdx, the Year to Date (YTD) function in MDX works the same way as running or sliding aggregations work. For example, YTD often used in combination with no parameter supplied displays a running total to date.
This means if we apply this function on year it gives all the year data, but if we drill down to March it is going to give us all the totals from the beginning of the year till March and so on.
This is very useful in SSRS reports.
Things to Do
That’s it! You are ready to do some basic data analysis after going through this article and you can improve your skills further by the following things:
- Please try to write a running aggregates script by creating windows on other columns such as Total Amount.
- Please also try to write a sliding aggregates script by creating frames on other columns such as Total Amount.
- You can add more columns and records to the table (or even more tables) to try other aggregation combinations.
- The example scripts mentioned in this article can be turned into stored procedures to be used in SSRS reports behind dataset(s).