Introduction
SQL query describes the expected result, not the way to get the result. The set of specific steps the server must take to return the result is called the query execution plan. The plan is built by the optimizer. Selection of a plan affects execution speed, what makes it one of the most important elements of the query performance problem analysis.
Execution plan comprises operators and their properties that are interrelated with each other in the form of the tree structure. Each operator is responsible for a separate logical or physical operation. All together, they ensure the result described in the query text. Inside the tree, operators are represented by the class objects in the memory of SQL Server. Server users (that is, you and me) see the description generated in XML format with a specific schema, that is displayed graphically by the SQL Server Management Studio (SSMS) environment.
There are many various plan operators and even more properties. Besides, new ones emerge from time to time. This article does not dare to describe all possible variety of operators. Instead, I would like to share the most interesting additions in this subject and to remind some old but useful elements.
Server Version
Sometimes you can find requests for the server version on the forums, even if the query plan is provided in the correct format (XML). Instead, you can save time and open execution plan as XML. And the first element describing the plan will show you the server version in the Build property.
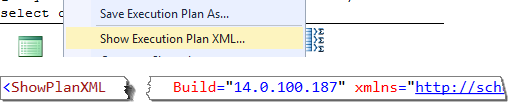
This method does not allow retrieving full information about the server edition, but in most cases, it is enough to understand what we deal with.
Number of Table Rows
The second frequent question is “How much rows does your table contain?”. This information can also be retrieved from the query plan (as from server version 2008). For this, we need to select the data access operator (Scan or Seek) of a table in question and take a look at the TableCardinality property. There is one more interesting property, Estimated Row Size, for specification of the row size and approximate evaluation of the table or index size (given that the table is not compressed).
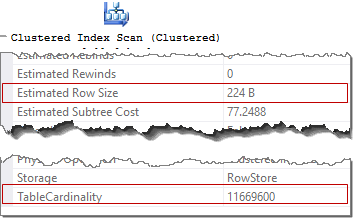
I’d like to note that this is not a real number of rows in a table, but data from the objects statistics. However, this data is the basis for the decisions the optimizer makes when building a query.
Context
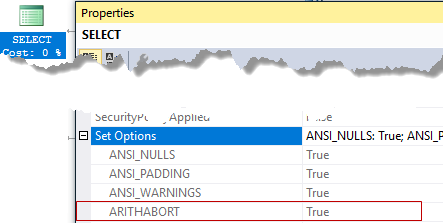
Query plan saves notable SET settings for which it was built for. To view the settings, you need to select a root element in the plan and expand the Set Options property. For example, we can learn whether the plan was built with the ARITHABORT option enabled (difference of this setting often leads to two different plans and situations with bad parameter sniffing).
Number of CPUs
We can retrieve the number of processors that are available for the optimizer. For this, we need to open the OptimizerHardwareDependentProperties -> EstimatedAvailableDegreeOfParallelism parameter in the same root element and multiply it by 2. If only one processor is available, there is no need in multiplying.
![]()
2*2 = 4, 4 CPUs are available. Indeed, I have a 4 core processor on my computer, and all 4 cores are available for the server. This information can help you to detect the machine on which the plan was generated.
Cardinality Estimator Version
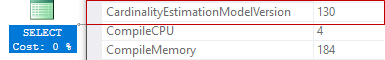
As from SQL Server 2014, several versions of Cardinality Estimator (RU) have become available. This mechanism affects most decisions optimizer takes when selecting a plan. You can retrieve the version of Cardinality Estimator from the CardinalityEstimationModelVersion property of the root operator.
- 0 – SQL Server <= 2012
- 120 – SQL Server 2014
- 130 – SQL Server 2016
- 140 – SQL Server vNext
Query Execution Time and Wait Time
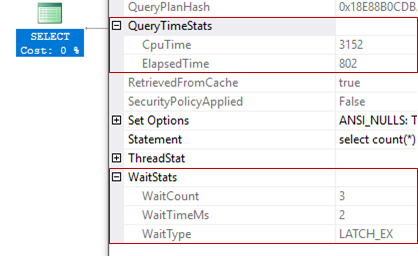
As from SQL Server 2016 SP1, the actual query plan features information about execution time and processor time. To retrieve this data, you need to expand the QueryTimeStats property in the root element and view the values of CpuTime and ElapsedTime. We don’t need to enable the collection of execution time or ask “how long was the query executed?” anymore – all this information is included in the plan.
The second notable improvement is top 10 of the longest waits during query execution. For this, we need to expand the WaitStats property in the root element. This addition allows getting more exact reasons of slow query execution and significantly simplifies diagnostics.
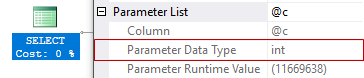
Parameter Types
The Parameter List property, that lists parameters used in the query, existed in the plan long ago. However, as from SQL Server 2016 SP1, the Parameter Data Type property has been added to the parameter definition. This property stores data type of the parameter. It can be useful for understanding issues with the type conversion.
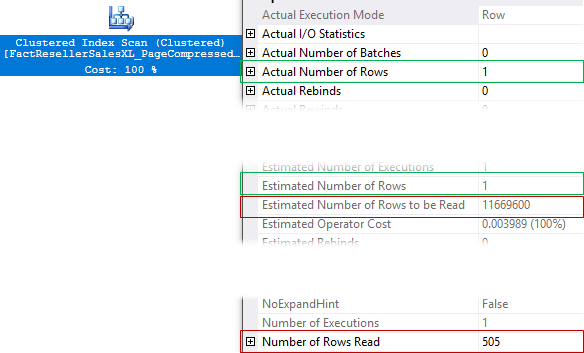
Number of Rows Read and Estimated Number of Rows to be Read
Execution plan includes two very important properties, Actual Number Of Rows and Estimated Number of Rows. These properties contain information about the number of rows returned by the data read operator, but not the number of rows it actually has read. The Number of Rows Read and Estimated Number of Rows to be Read properties answer this question and allow retrieving the number of rows that server has actually read or is going to read. The ActualRowsRead (Number of Rows Read in SSMS) property is available as from SQL Server 2012 SP3, 2014 SP2, 2016 SP1. The EstimatedRowsRead (Estimated Number of Rows to be Read in SSMS) property is available as from SQL Server 2016 SP1.
IO Statistics and Operator Execution Time
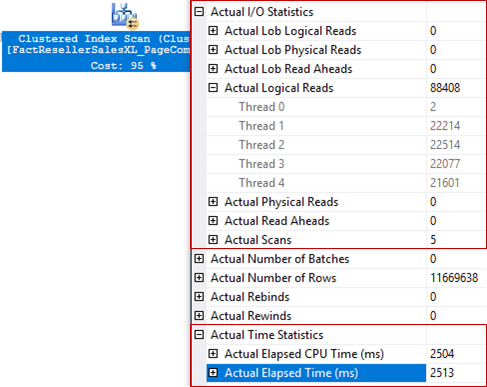
There are several very useful properties established in SQL Server 2016, 2014 SP2 and available in the actual query plan. They are IO metrics (if an operator has IO) – Actual IO Statistics, CPU and execution time metrics – Actual Time Statistics, and memory metrics (as from 2016 SP1, if an operator requires memory).
The properties include the following new metrics that can be divided into threads in case of the parallel plan:
- ActualElapsedms
- ActualCPUms
- ActualScans
- ActualLogicalReads
- ActualPhysicalReads
- ActualReadAheads
- ActualLobLogicalReads
- ActualLobPhysicalReads
- ActualLobReadAheads
- InputMemoryGrant
- OutputMemoryGrant
- UsedMemoryGrant
As you can see from the list above, you can retrieve comprehensive information about the execution of any given operator, consumed IO and memory. In the last versions of SSMS, these metrics are represented in the properties window. If you use an old version of SSMS, you can retrieve them by opening plan as XML. In my opinion, now there is everything for showing percents not by estimated cost, but by actual resources elapsed (I created a suggestion at Connect. So, you if like the idea, please vote for it).
Information about Enabled Trace Flags
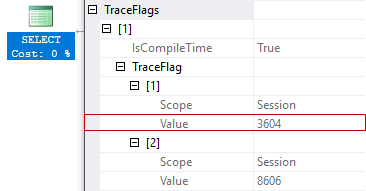
Trace flags in SQL Server are special ‘switches’ from the default server behavior to some different behavior. As from SQL Server 2014 SP2 and 2016 SP1, information about enabled trace flags is available in the TraceFlags property of the specific element. It can include up to 100 simultaneously enabled flags at the moment of query building.
Information about Data Spill to tempdb
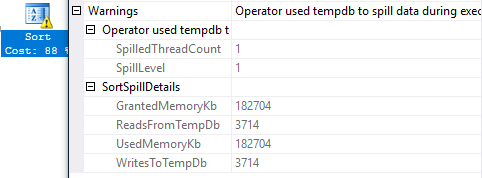
Some plan operators, for example, such as Sort or Hash Match, require memory during query execution. However, the memory volume is calculated at the moment of compilation. Due to various reasons (e.g. incorrect evaluation of supposed number or rows), the memory volume can be calculated incorrectly. If less memory is allocated than it is required for execution, the server will have to spill data to tempdb. It slows down query execution. Caution about such situation was introduced in server 2012, but as from SQL Server 2012 SP3, 2014 SP2, 2016, the diagnostic information has been expanded, and now it includes the volume of spilled data and read data. So, you can evaluate the problem and take the proper measures.
Conclusion
Execution plan includes lots of useful information, actual query plan includes yet more information, and actual query plan in the last versions of SQL Server is just a mine of useful information. This article is not intended for teaching someone to analyze query plans. Instead, I considered the most interesting plan properties, including new properties and old, but underrated ones. I hope this article will help you next time when you will need to analyze the query performance.
The article was translated by Codingsight team with the permission of the author.
Useful tool:
dbForge Query Builder for SQL Server – allows users to build quickly and easily complex SQL queries via an intuitive visual interface without manual code writing.