
What is query optimization in SQL Server? It’s a big topic. Each technique or problem needs a separate article to cover the bases. But when you’re just starting to level up your game with queries, you need something simpler to rely on. This is the goal of this article.
You might say your queries are optimal, everything performs well, and users are happy. Of course, performance isn’t everything. The results should also be correct. Whether it’s a join, a subquery, a synonym, a CTE, a view, or whatever, it must perform acceptably.
And at the end of the day, you can go home with your users. You don’t want to stay in the office fixing the slow-running queries overnight.
Before we begin, let me assure you that the journey won’t be rough. This will just be a primer. We’ll have examples that won’t be too alien to you too. Finally, when you are ready for a deeper study, we’ll present some links you can check out.
Let’s begin.
1. SQL Query Optimization Starts from Design and Architecture
Surprised? SQL query optimization is not an afterthought or a band-aid when something breaks. Your query runs as quickly as your design allows. We’re talking about normalized tables, the right data types, the use of indexes, archiving of old data, and any of the best practices you can think of.
A good database design works in synergy with the right hardware and SQL Server settings. Did you design it to run smoothly for several years and still feel new? That’s a big dream, but we only have a certain (usually – short) amount of time to think about it.
It won’t be perfect on day 1 in production, but we should have covered the bases. We’ll minimize technical debt. If you’re working with a team, that’s great compared to a one-man show. You can cover much of the bells and whistles.
Still, what if the database is running live and you hit the performance wall? Here are some SQL query optimization tips and tricks.
2. Spot Problematic Queries with SQL Server Standard Report
When you are coding, it’s easy to spot a long series of code or a stored procedure. You can debug it line by line. The line that lags is the one to fix.
But what if your helpdesk threw a dozen of tickets because it’s slow? Users can’t pinpoint the exact location in the code, and neither can the helpdesk. Time is your worst enemy.
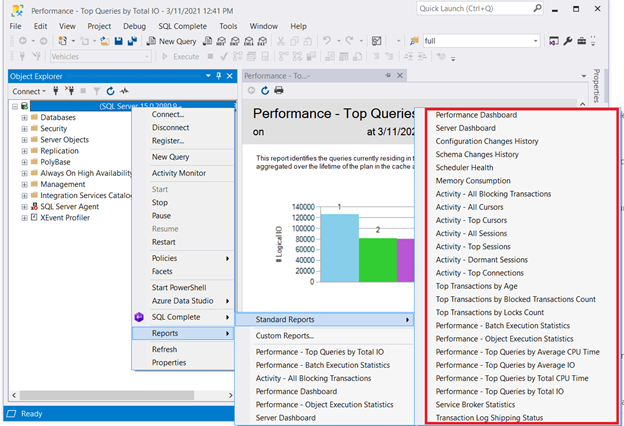
One solution that won’t require coding is checking the SQL Server’s standard reports. Right-click the necessary server in SQL Server Management Studio > Reports > Standard Reports. Our point of interest may be Performance Dashboard or Performance – Top Queries by Total I/O. Pick the first query that performs badly. Then start the SQL query optimization or SQL performance tuning from there.
3. SQL Query Tuning with STATISTICS IO
After pinpointing the query in question, you can start checking logical reads in STATISTICS IO. This is one of the SQL query optimization tools.
There are a few I/O points, but you should focus on logical reads. The higher the logical reads are, the more problematic the query performance is.
By reducing the following 3 factors, you can speed up the performance tuning queries in SQL:
- high logical reads,
- high LOB logical reads,
- or high WorkTable/WorkFile logical reads.
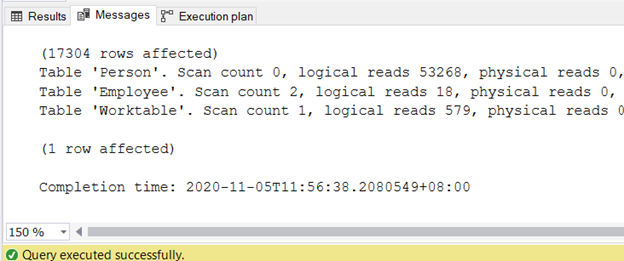
To get the information on logical reads, turn on STATISTICS IO in the SQL Server Management Studio query window.
SET STATISTICS IO ON
You can get the output in the Messages tab after the query is done. Figure 2 displays the sample output:
I have written a separate article about reducing logical reads in 3 Nasty I/O Statistics that Lag SQL Query Performance. Refer to it for the exact steps and code samples with high logical reads and ways to reduce them.
4. SQL Query Tuning with Execution Plans
Logical reads alone won’t give you the whole picture. The series of steps chosen by the query optimizer will tell the story of your result set. How does it all start after you execute the query?
Figure 3 below is a diagram of what happens after you trigger the execution till the moment you get the result set.
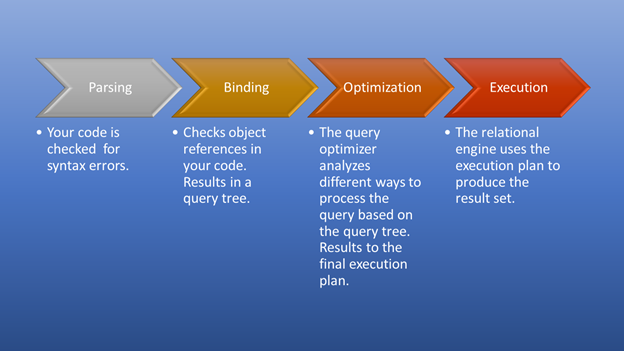
Parsing and binding will happen in a flash. The awesome part is the optimization stage, which is our focus. At this stage, the query optimizer plays a pivotal role in selecting the best possible execution plan. Though this part needs some resources, it saves a lot of time when it picks an efficient execution plan. This happens dynamically, as the database changes over time. This way, the programmer can focus on how to form the final result.
Each plan the query optimizer considers has its query cost. Among many options, the optimizer will choose the plan with the most reasonable cost. Note: Reasonable cost is not equal to the least cost. It also needs to consider which plan will produce the fastest results. The plan with the least cost is not always the fastest one. For example, the optimizer may choose to utilize several processor cores. We call this parallel execution. This will consume more resources but run faster in comparison to serial execution.
Another point to consider is statistics. The query optimizer relies on it to create execution plans. If the statistics are outdated, don’t expect the best decision from the query optimizer.
When the plan is decided and execution proceeds, you will see the results. What now?
Inspect the Query Execution Plan in SQL Server
When you form a query, you want to see the results first. The results have to be correct. When it is, you’re done.
Is that so?
If you are short of time, and the job is at stake, you may agree to that. Besides, you can always come back. However, if other problems arise, you can forget them again and again. And then, the ghost of the past will hunt you down.
Now, what’s the best thing to do after getting the correct results?
Inspect the Actual Execution Plan or the Live Query Statistics!
The latter is good if your query runs slow and you want to see what happens every second as the rows are processed.
At times, the situation will force you to inspect the plan immediately. To start, press Control-M or click Include Actual Execution Plan from the toolbar of SQL Server Management Studio. If you prefer dbForge Studio for SQL Server, go to Query Profiler – it provides the same info + some bells and whistles that you can’t find in SSMS.
We’ve seen the Actual Execution Plan. Let’s proceed further.
Is There a Missing Index or Index Recommendations?
A missing index is easy to spot – you get the warning immediately.
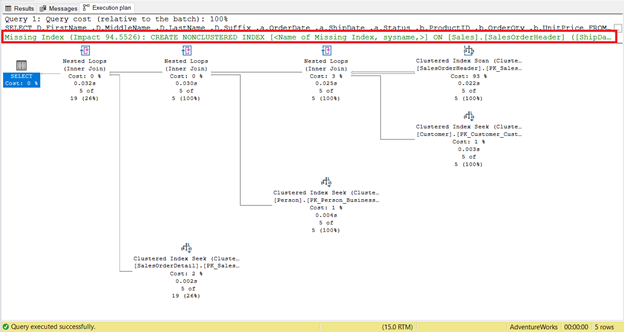
To get an instant code to create the index, right-click the Missing Index message (boxed in red). Then select Missing Index Details. A new query window with the code to create the missing index will appear. Create the index.
This part is easy to follow. It is a good starting point to achieve faster execution. But in some cases, there will no effect. Why? Some columns needed by your query are not in the index. Therefore, it will revert to a Clustered Index Scan.
You need to re-inspect the execution plan after creating the index to see if Included columns are needed. Then, adjust the index accordingly and re-run your query. After that, check the execution plan again.
But what if there’s no missing index?
Read the Execution Plan
You need to know a few basic things to get you started:
- Operators
- Properties
- Reading direction
- Warnings
OPERATORS
The query optimizer uses some sort of mini-programs called operators. You have seen some of them in Figure 4 – Clustered Index Seek, Clustered Index Scan, Nested Loops, and Select.
To get a comprehensive list with names, icons, and descriptions, you can check this reference from Microsoft.
PROPERTIES
Graphical diagrams are not enough to understand what is happening behind the scenes. You need to dig deeper into each operator’s properties. For example, the Clustered Index Scan in Figure 4 has the following Properties:
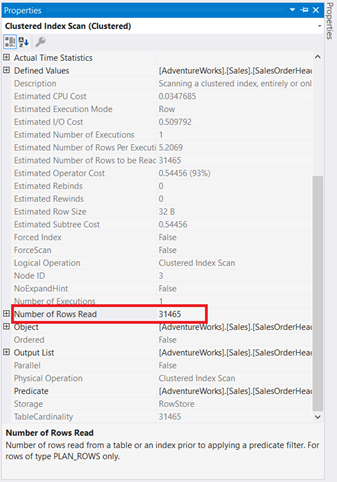
If you will examine it carefully, the Clustered Index Scan operator is terrible. As Figure 5 shows, it read 31,465 rows, but the final result set is just 5 rows. That’s why there is an index recommendation in Figure 4 to reduce the number of rows read. The logical reads of the query are also high and this explains why.
To know more of these properties, check out the list of common operator properties and plan properties.
READING DIRECTION
Generally, it’s like reading Japanese manga – from right to left. Follow the arrows which are pointing to the left. Here’s a simple example from dbForge Studio for SQL Server.
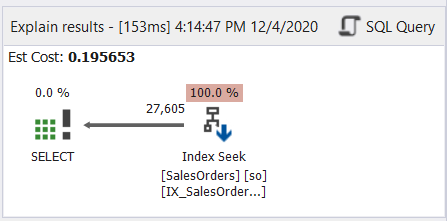
As Figure 6 demonstrates, the arrow points to the left from the Index Seek operator to the SELECT operator.
However, reading right to left may not always correct. See Figure 7 with an example from SSMS:
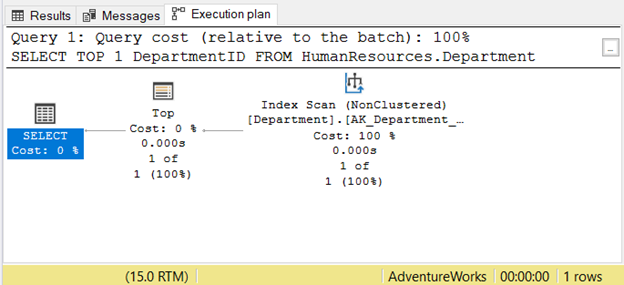
If you read it from right to left, you will see that the Index Scan operator output is 1 of 1 row. How could it know just 1 row to fetch? It is because of the Top operator. This will confuse us if we read it from right to left.
To understand this case better, read it as “the SELECT operator uses Top to fetch 1 row using Index Scan”. That is left to right.
What should we use? Right to left or left to right?
It’s kind of both – whichever helps you understand the plan.
While the arrow gives us the direction of the data flow, its thickness gives us some hints about the size of the data. Let’s refer to Figure 4 again.
The Clustered Index Scan going to the Nested Loop has a thicker arrow compared to the others. The Properties details of Index Scan in Figure 5 tell us why it’s thick (31,465 rows read for a final result of 5 rows).
WARNINGS
A warning icon appearing in the execution plan operator tells us that something bad has happened in that operator. This can hamper your SQL query optimization by consuming more resources.
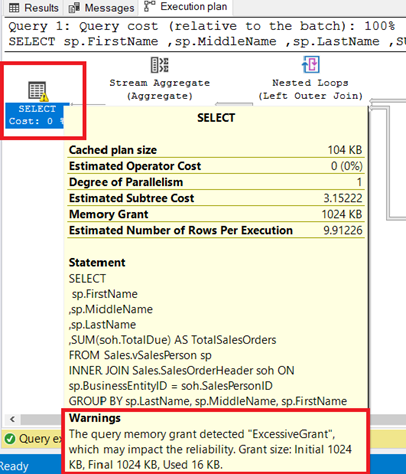
You can see the warning in the SELECT operator. Hovering to that operator reveals the warning message. An ExcessiveGrant has caused this warning.
ExcessiveGrant happens when less memory is used than was reserved for the query. For more information, refer to this Microsoft documentation.
Figure 8 shows the query used as an INNER JOIN of a view to a table. You can remove the warning by joining base tables instead of the view.
Now that you have a basic idea of reading execution plans, how to define what makes your query slow?
Know the 5 Common Plan Operator Rogues
The lag in your query execution is like a crime. You need to chase and arrest these rogues.
1. Clustered or Non-Clustered Index Scan
The first rogue that everyone learns about is Clustered or Non-Clustered Index Scan. Its common knowledge in SQL query optimization that scans are bad and seeks are good. We’ve seen one in Figure 4. Because of the missing index, the Clustered Index Scan reads 31,465 to get 5 rows.
However, it is not always the case. Consider 2 queries on the same table in Figure 9. One will have a seek and another has a scan.
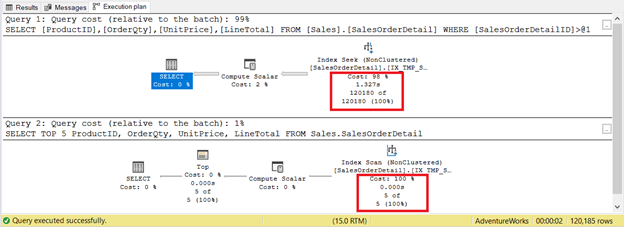
If you only base the criteria on the number of records, the index scan wins with only 5 records vs. 120,180. The index seek will take longer to execute.
Here’s another instance where either scan or seek almost doesn’t matter. They return the same 6 records from the same table. The logical reads are the same and the elapsed time is zero in both cases. The table is very small with 6 records only. Include the Actual Execution Plan and run the statements below.
-- Run this with Include Actual Execution Plan
USE AdventureWorks
GO

SET STATISTICS IO ON
GO

SELECT AddressTypeID, Name
FROM Person.AddressType
WHERE AddressTypeID >= 1
ORDER BY AddressTypeID DESC
Then, save the execution plan for comparison later. Right-click the execution plan > Save Execution Plan As.
Now, run the below query.
SELECT AddressTypeID, Name
FROM Person.AddressType
ORDER BY AddressTypeID DESC

SET STATISTICS IO OFF
GO
Next, right-click the Execution Plan and select Compare Showplan. Then, select the file you saved earlier. You should have the same output as in Figure 10 below.
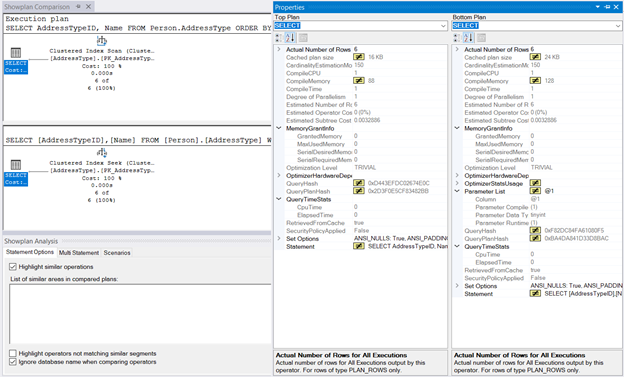
The MemoryGrant and QueryTimeStats are the same. The 128KB CompileMemory used in the Clustered Index Seek compared to 88KB of the Clustered Index Scan is almost negligible. Without these figures to compare, the execution will feel the same.
2. Avoiding Table Scans
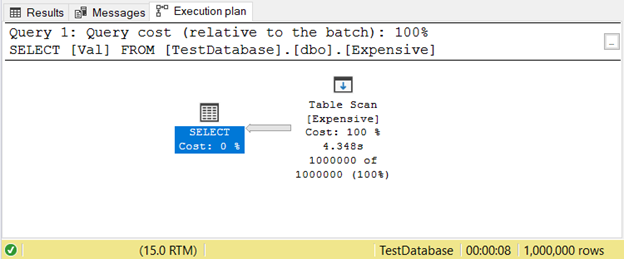
This happens when you don’t have an index. Instead of seeking values using an index, SQL Server will scan rows one by one until it gets what you need in your query. This will lag a lot on large tables. The simple solution is to add the appropriate index.
Here’s an example of an execution plan with Table Scan operator in Figure 11.
3. Managing Sort Performance
As it comes from the name, it changes the order of rows. This can be an expensive operation.
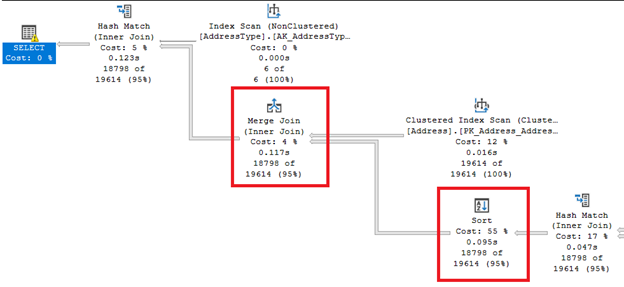
Look at those fat arrow lines from the right and left of the Sort operator. Since the query optimizer decided to do a Merge join, a Sort is required. Notice also that it has the highest percentage cost of all operators (55%).
Sort can be more troublesome if SQL Server needs to order rows several times. You can avoid this operator if your table is pre-sorted basing on the query requirement. Or you can break a single query into multiple ones.
4. Eliminate Key Lookups
In Figure 4 before, SQL Server recommended adding another index. I did it, but it did not give me exactly what I wanted. Instead, it gave me an Index Seek to the new index paired with a Key Lookup operator.
So, the new index added an extra step.
What does this Key Lookup operator do?
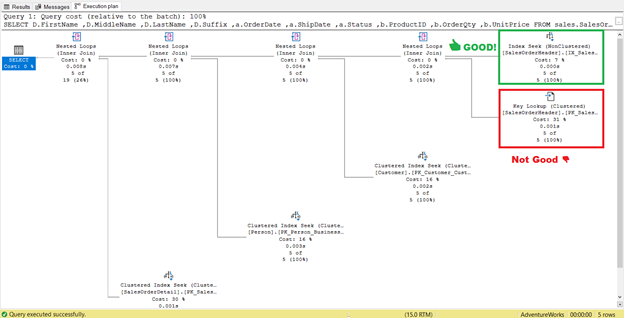
The query processor used a new non-clustered index boxed in green in Figure 13. As our query requires columns that are not in the new index, it needs to get those data with the help of a Key Lookup from the clustered index. How do we know this? Hovering your mouse to the Key Lookup reveals some of its properties and proves our point.
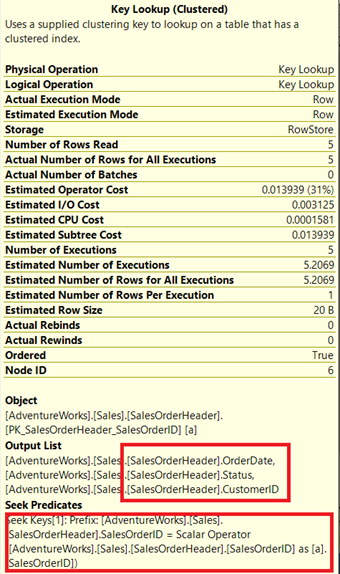
In Figure 14, notice the Output List. We need to retrieve 3 columns using the PK_SalesOrderHeader_SalesOrderID clustered index. To remove this, you need to include these columns in the new index. Here’s the new plan once these columns are included.
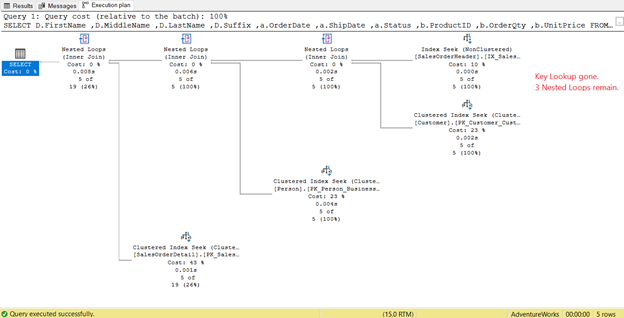
In Figure 14, we saw 4 Nested Loops. The fourth one is needed for the added Key Lookup. But after adding 3 columns as Included columns into the new index, only 3 Nested Loops remain, and the Key Lookup is removed. We don’t need any extra steps.
5. Parallelism in SQL Server Execution Plan
So far, you saw execution plans in serial execution. But here’s the plan that leverages parallel execution. This means that more than 1 processor is utilized by the query optimizer to run the query. When we use parallel execution, we see Parallelism operators in the plan, and other changes too.
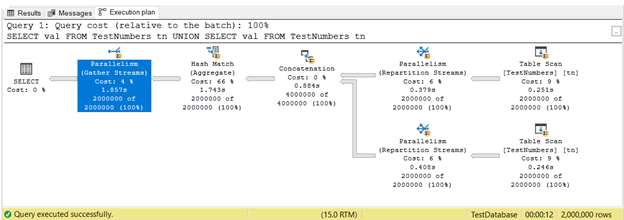
In Figure 16, 3 Parallelism operators were used. Notice also that the Table Scan operator icon is a bit different. This happens when parallel execution is used.
Parallelism is not inherently bad. It increases the speed of queries by utilizing more processor cores. However, it uses more CPU resources. When a lot of your queries use parallelisms, it slows the server down. You may want to check the cost threshold for parallelism setting in your SQL Server.
5. Best Practices for SQL Query optimization
So far, we have dealt with SQL query optimization with methods that unearth problems that are hard to spot. But there are ways to spot it in code. Here are some code smells in SQL.
Using SELECT *
In a hurry? Then typing * can be easier than specifying column names. However, there’s a catch. Columns you don’t need will lag your query.
There is proof. The sample query I used for Figure 15 is this:
USE AdventureWorks
GO

SELECT
 d.FirstName
,d.MiddleName
,d.LastName
,d.Suffix
,a.OrderDate
,a.ShipDate
,a.Status
,b.ProductID
,b.OrderQty
,b.UnitPrice
FROM sales.SalesOrderHeader a
INNER JOIN sales.SalesOrderDetail b ON a.SalesOrderID = b.SalesOrderID
INNER JOIN Sales.Customer c ON a.CustomerID = c.CustomerID
INNER JOIN Person.Person d ON c.PersonID = d.BusinessEntityID
WHERE a.ShipDate = '07/11/2011'
We’ve already optimized it. But let’s change it to SELECT *
USE AdventureWorks
GO

SELECT *
FROM sales.SalesOrderHeader a
INNER JOIN sales.SalesOrderDetail b ON a.SalesOrderID = b.SalesOrderID
INNER JOIN Sales.Customer c ON a.CustomerID = c.CustomerID
INNER JOIN Person.Person d ON c.PersonID = d.BusinessEntityID
WHERE a.ShipDate = '07/11/2011'
It’s shorter alright, but check the Execution Plan below:
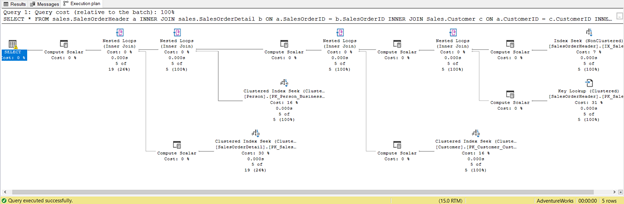
This is the consequence of including all columns, even those you don’t need. It returned Key Lookup and lots of Compute Scalar. In short, this query has a heavy load and will lag as a result. Notice the warning in the SELECT operator too. It wasn’t there before. What a waste!
Functions in a WHERE Clause or JOIN
Another code smell is having a function in the WHERE clause. Consider the following 2 SELECT statements having the same result set. The difference is in the WHERE clause.
SELECT
 D.FirstName
,D.MiddleName
,D.LastName
,D.Suffix
,a.OrderDate
,a.ShipDate
,a.Status
,b.ProductID
,b.OrderQty
,b.UnitPrice
FROM sales.SalesOrderHeader a
INNER JOIN sales.SalesOrderDetail b ON a.SalesOrderID = b.SalesOrderID
INNER JOIN Sales.Customer c ON a.CustomerID = c.CustomerID
INNER JOIN Person.Person d ON c.PersonID = D.BusinessEntityID
WHERE YEAR(a.ShipDate) = 2011
AND MONTH(a.ShipDate) = 7

SELECT
 D.FirstName
,D.MiddleName
,D.LastName
,D.Suffix
,a.OrderDate
,a.ShipDate
,a.Status
,b.ProductID
,b.OrderQty
,b.UnitPrice
FROM sales.SalesOrderHeader a
INNER JOIN sales.SalesOrderDetail b ON a.SalesOrderID = b.SalesOrderID
INNER JOIN Sales.Customer c ON a.CustomerID = c.CustomerID
INNER JOIN Person.Person d ON c.PersonID = D.BusinessEntityID
WHERE a.ShipDate BETWEEN '07/1/2011' AND '07/31/2011'
The first SELECT uses YEAR and MONTH date functions to indicate ship dates within July 2011. The second SELECT statement uses BETWEEN operator with date literals.
The first SELECT statement will have an execution plan similar to Figure 4 but without the index recommendation. The second will have a better execution plan similar to Figure 15.
The one optimized better is obvious.
Use of Wildcards
How wild can wildcards affect our SQL query optimization? Let’s have an example.
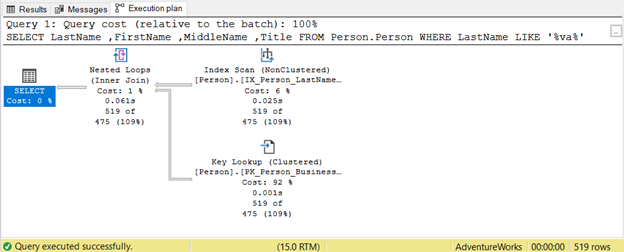
The query tries to look for a presence of a string within Lastname in any position. Hence, Lastname LIKE ‘%va%’. This is inefficient on large tables because rows will be inspected one by one for the presence of that string. That’s why an Index Scan is used. Since no index includes the Title column, a Key Lookup is also used.
This can be fixed by design.
Does the calling app require that? Or will it be enough to use LIKE ‘va%’?
LIKE ‘va%’ uses an Index Seek because the table has an index on lastname, firstname, and middlename.
Can you also add more filters in the WHERE clause to reduce the records’ read?
Your answers to these questions will help you how to fix this query.
Implicit Conversion
SQL Server does implicit conversion behind the scenes to reconcile data types when comparing values. For instance, it’s convenient to assign a number to a string column without quotes. But there’s a catch. The effect is similar when you use a function in a WHERE clause.
SELECT
 NationalIDNumber
,JobTitle
,HireDate
FROM HumanResources.Employee
WHERE NationalIDNumber = 56920285
The NationalIDNumner is NVARCHAR(15) but is equated to a number. It will run successfully because of implicit conversion. But notice the execution plan in Figure 19 below.
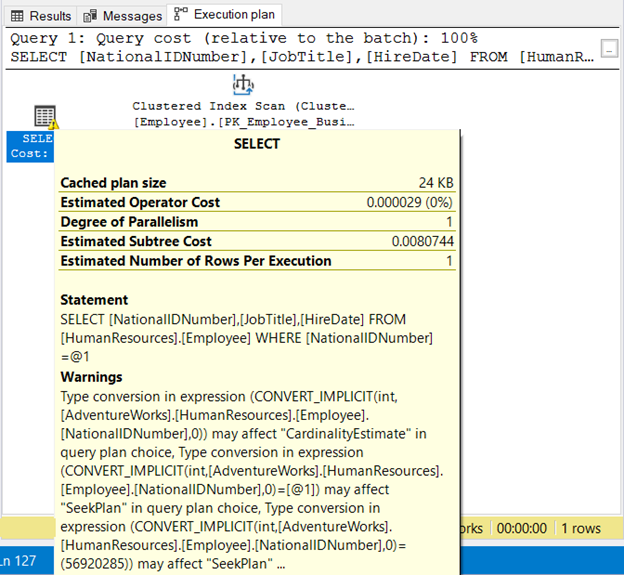
We see 2 bad things here. First, the warning. Then, the Index Scan. The index scan happened because of implicit conversion. Thus, make sure to enclose strings in quotes or test literal values with the same data type as the column.
SQL Query Optimization Takeaways
That’s it. Did the basics of SQL query optimization make you feel a bit ready for your queries? Let’s have a recap.
- If you want your queries optimized, start with a good database design.
- If the database is already in production, spot the problematic queries using SQL Server standard reports.
- Learn how big is the impact of the slow query with logical reads from STATISTICS IO.
- Dig deeper into the story of your slow query with Execution Plans.
- Watch 4 code smells that slow your queries down.
There are other SQL query optimization tips to make a slow query run fast. Like I said at the start, this is a big topic. So, let us know in the Comments section what else we missed.
And if you like this post, share it on your favorite social media platforms.
More SQL Query Optimization from Previous Articles
If you need more examples, here are some useful posts related to query optimization techniques in SQL Server.
- Are subqueries bad for performance? Check out The Easy Guide on How to Use Subqueries in SQL Server.
- Using HierarchyID vs. parent/child design – which is faster? Visit How to Use SQL Server HierarchyID Through Easy Examples.
- Can graph database queries outperform their relational equivalents in a real-time recommendation system? Check out How to Make Use of SQL Server Graph Database Features.
- Which is faster: COALESCE or ISNULL? Find out in Top Answers to 5 Burning Questions on SQL COALESCE Function.
- SELECT FROM View vs. SELECT FROM Base Tables – Which One Will Run Faster? Visit Top 3 Tips You Need to Know to Write Faster SQL Views.
- CTE vs. Temporary Tables vs. Subqueries. Know which one will win in Everything You Need to Know About SQL CTE in One Spot.
- Using SQL SUBSTRING in a WHERE Clause – A Performance Trap? See if it’s true with examples in How to Parse Strings Like a Pro Using SQL SUBSTRING() Function?
- SQL UNION ALL is Faster Than UNION. Know why in SQL UNION Cheat Sheet with 10 Easy and Useful Tips.