For reference, Power BI is a data visualization and analytics software developed by Microsoft. Power BI can be used for static as well as interactive data visualization. Before you can create actual visualizations with Power BI, you can perform data preprocessing using Power BI Query editor.
With query editor, you can perform various data transformation tasks, such as changing column types, handling missing values, deleting rows and columns, pivoting and unpivoting columns, splitting columns, etc.
In this article, you will see how to pivot, unpivot, and split columns using Power BI Query editor.
Importing A Data Set into the Query Editor
The dataset used as an example in this article is in a CSV file format that can be downloaded using this kaggle link. Download the CSV file into your local file system.
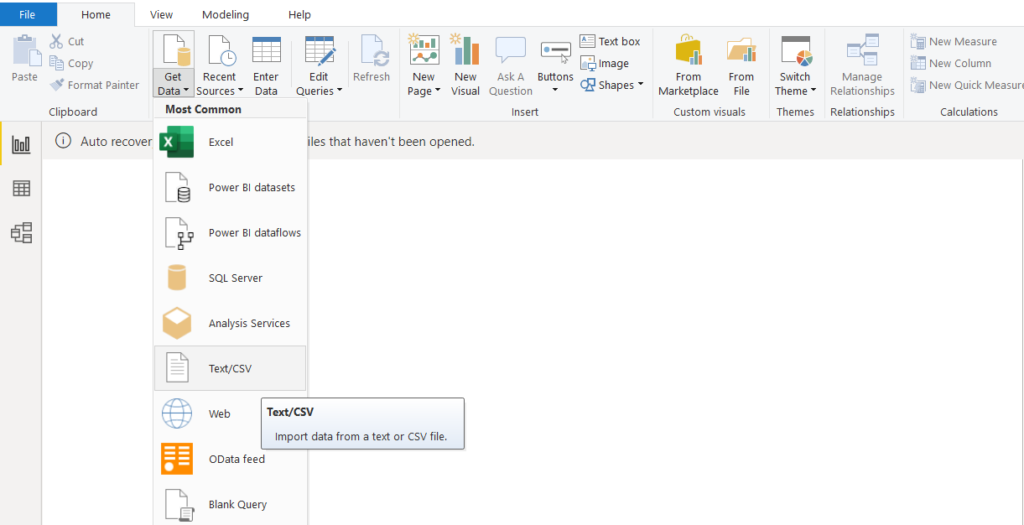
Next, open the Power BI Desktop, click on the “Get Data” button from the top menu. From the dropdown list, select “Text/CSV” as shown below.
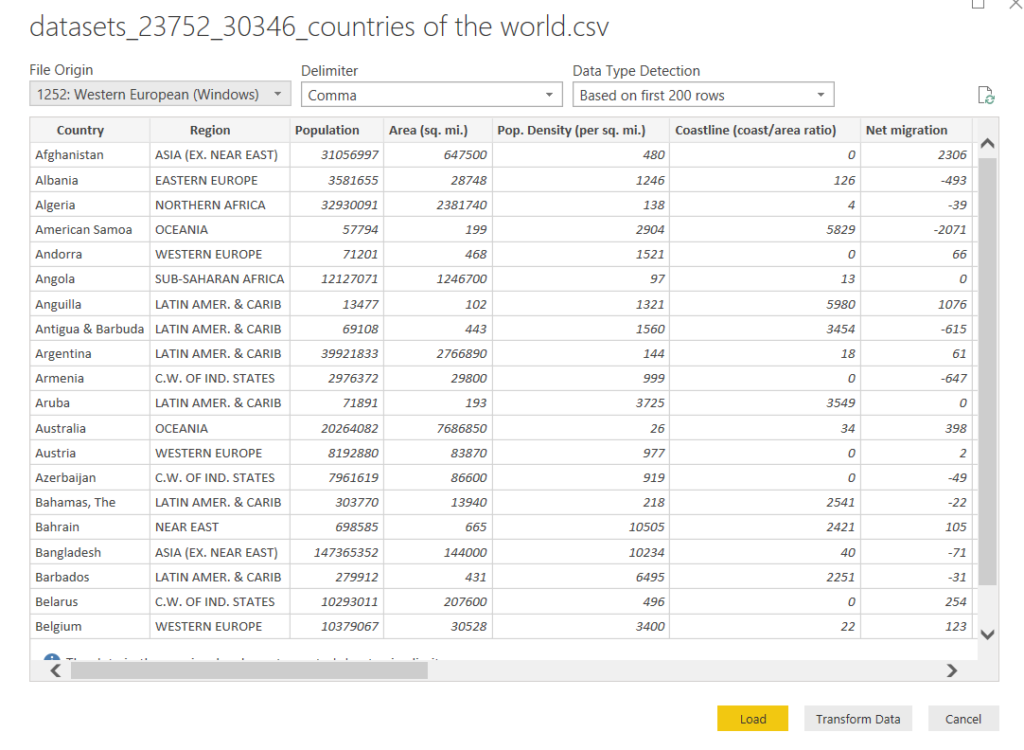
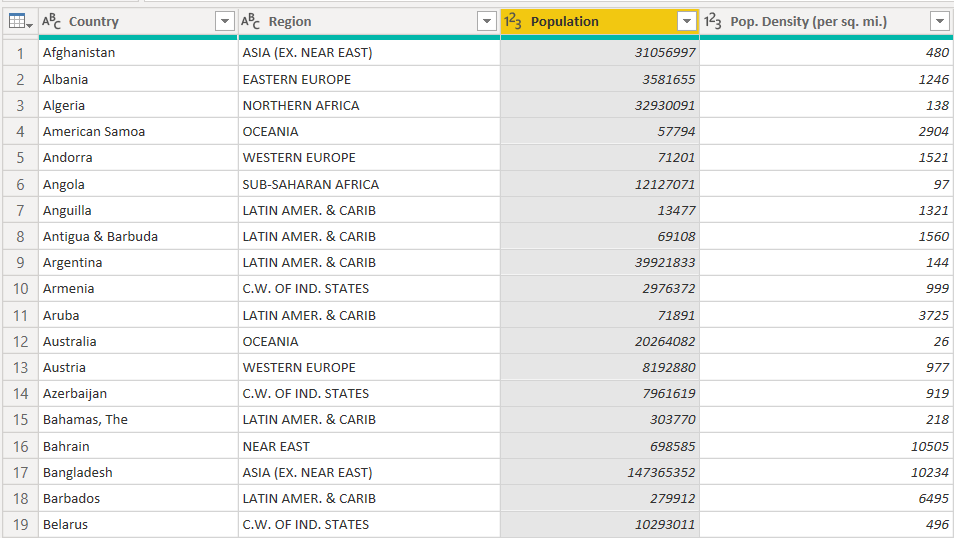
Power BI will take some time to import the data. Once the data is loaded, you should see the window below.
The dataset contains information about the Population, Area, Birth Rate, Death Rate, Population Density, GDP Per capita, Phones per 1000, etc. for all the countries in the world. To load the data into the query editor, click the “Transform Data” button.
The query editor looks like this:
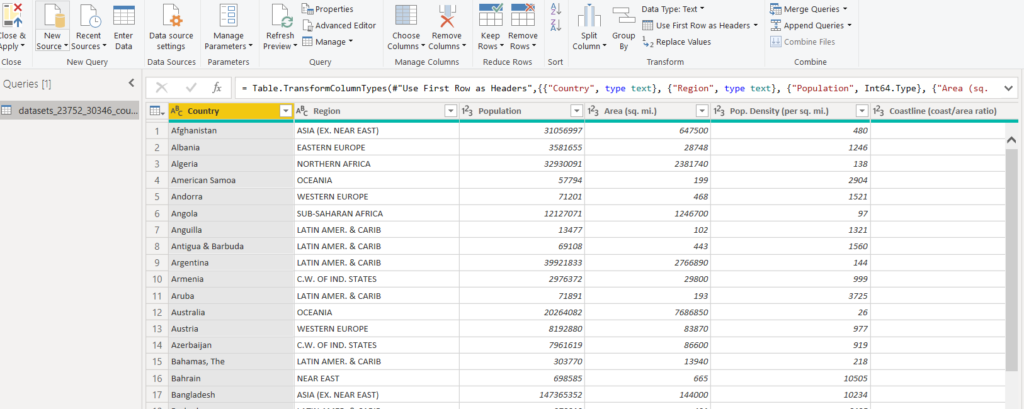
In the query editor, you can perform various preprocessing such as pivoting, unpivoting, and splitting columns.
Pivoting and Unpivoting Theory
Before we actually get down to pivoting and unpivoting columns with Power BI query editor. Let’s consider a very basic example of unpivoting.
Unpivoting
Assume you have a dataset that contains the following information. The rows in the following table correspond to countries, while the columns show information about the GDP Per Capita and Literacy Rate for corresponding countries in rows. (Note: These are just dummy values, not the actual values)
| Country | GDP Per Capita | Literacy Rate |
| France | 30,000 | 95% |
| Germany | 25,000 | 96% |
If you unpivot a single column, e.g., GDP Per Capita, the dataset with an unpivoted column will look like this.
| Country | Attribute | Value | Literacy |
| France | GDP Per Capita | 30,000 | 95% |
| Germany | GDP Per Capita | 25,000 | 96% |
You can see that the column GDP Per Capita has been replaced by two columns, i.e., Attribute and Value. The values in the “Attribute” column correspond to the column name that is unpivoted, whereas the “Value” column contains the values that previously existed in the unpivoted column. Since only a single column is unpivoted, the values in the “Attribute” column will always be the same. Also, the number of rows in the dataset with one unpivoted column will remain the same.
Let’s now try to see what happens when we unpivot two columns. We will unpivot both the GDP Per Capita and Literacy Rate columns in the original dataset. The dataset with two unpivoted columns looks like this.
| Country | Attribute | Value |
| France | GDP Per Capita | 30,000 |
| France | Literacy Rate | 95% |
| Germany | GDP Per Capita | 25,000 |
| Germany | Literacy Rate | 96% |
In the above dataset, you can see that for each country name, the “Attribute” column now contains two unique values: GDP Per Capita and Literacy Rate. The “Value” column contains the corresponding values for the Attributes. Notice that the number of rows has doubled. Similarly, if you unpivot three columns, the number of rows in a dataset increases by three times.
Pivoting
Pivoting, as the name suggests, refers to the process that is used to reverse an unpivoted dataset to its original form. For instance, in pivoting the input table looks like this:
| Country | Attribute | Value |
| France | GDP Per Capita | 30,000 |
| France | Literacy Rate | 95% |
| Germany | GDP Per Capita | 25,000 |
| Germany | Literacy Rate | 96% |
After applying pivoting on the “Attribute” and “Value” columns, the dataset takes the following form:
| Country | GDP Per Capita | Literacy Rate |
| France | 30,000 | 95% |
| Germany | 25,000 | 96% |
Now that we know what pivoting and unpivoting are, let’s see how to implement them with Power BI.
Pivoting and Unpivoting with Power BI
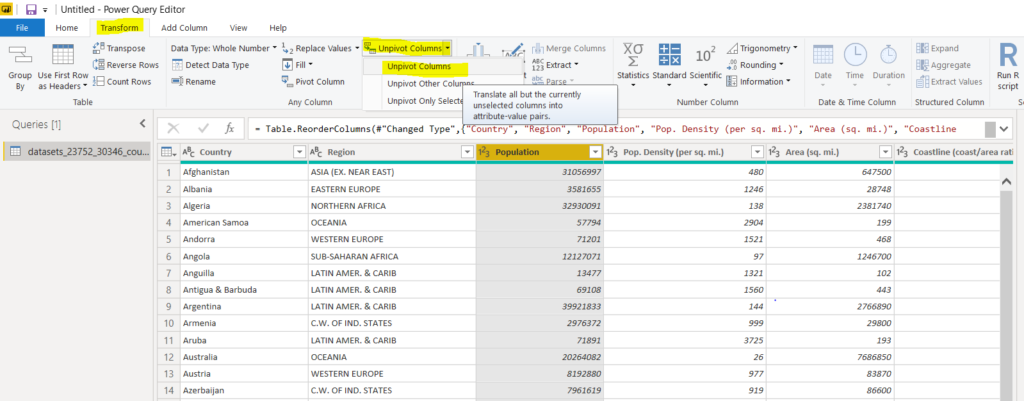
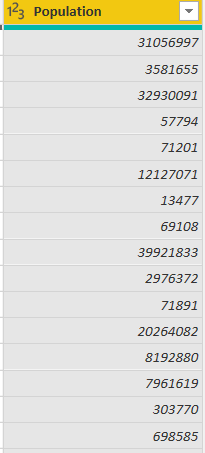
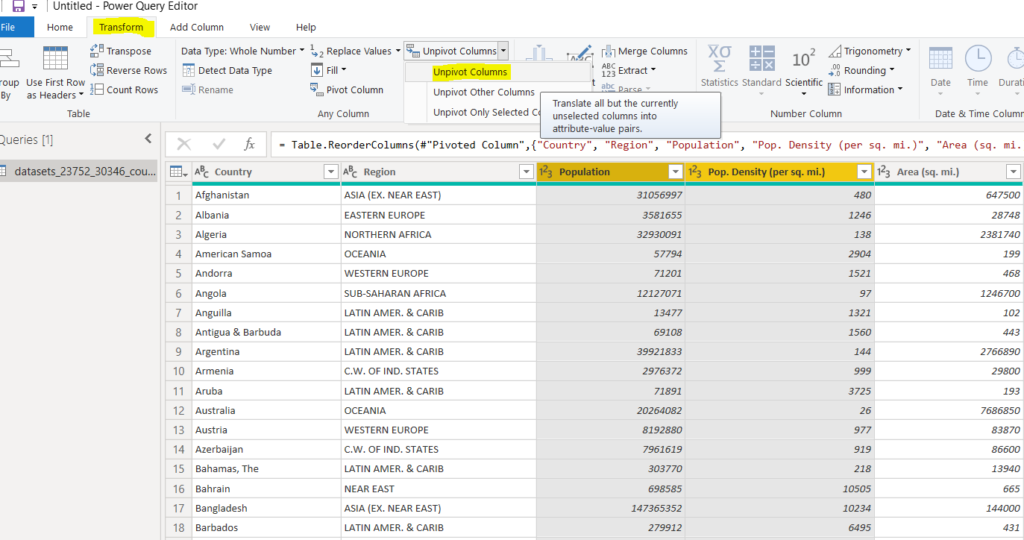
Let’s first see an example of how to unpivot a single column with Power BI query editor. If you look at the dataset, it contains a column named “Population”. To unpivot the “Population” column, click the column header and then select the “Transform” option from the top menu. You will see a new menu with several options appear at the top, click “Unpivot Columns” option from the menu and then click “Unpivot Columns” from the dropdown list, as shown below:
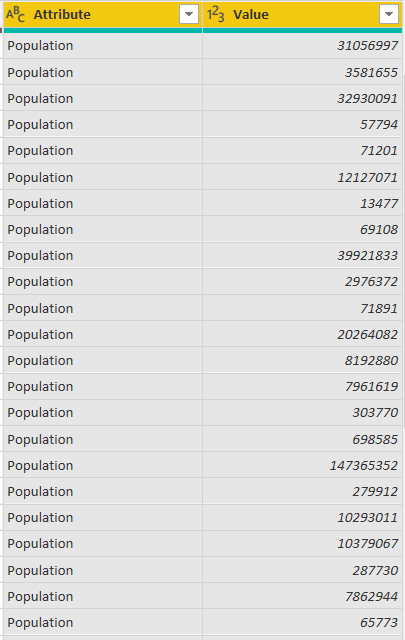
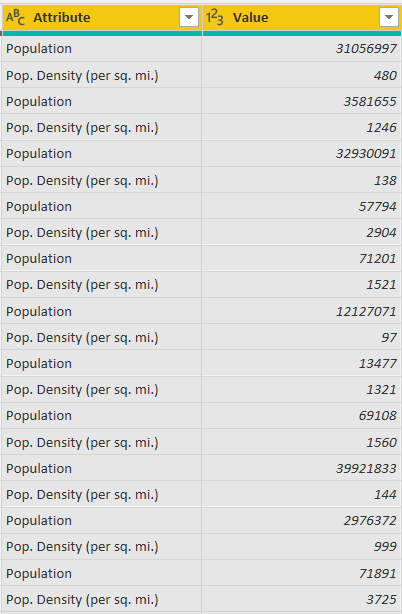
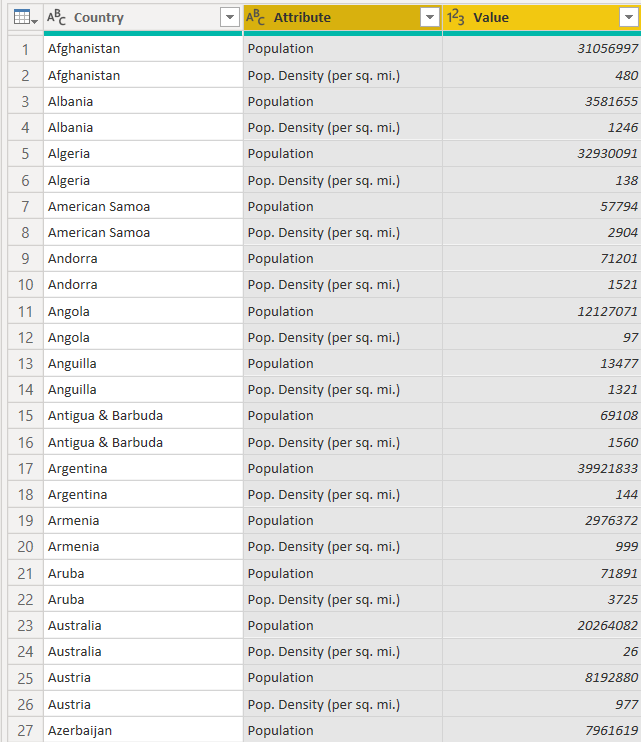
The “Population” column will be replaced by the “Attribute” and “Value” columns, as shown below:
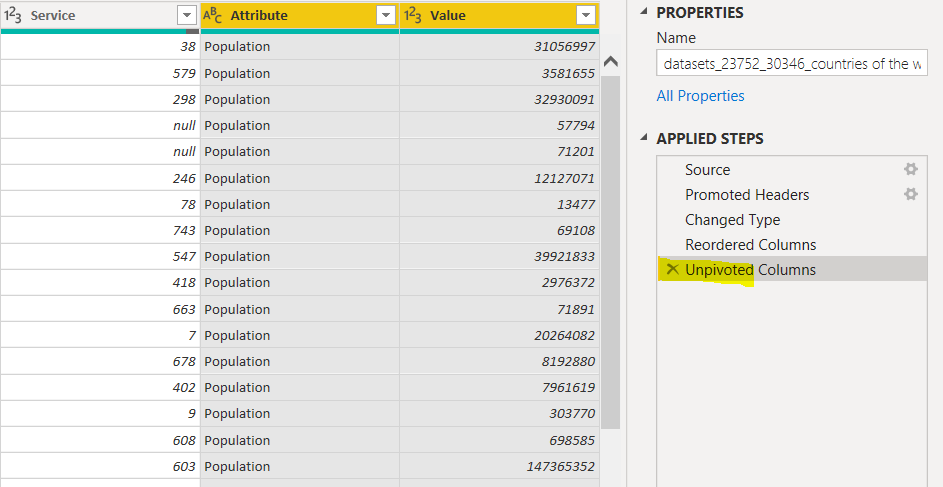
Now, to pivot a column, you have two options. You can click the “x Unpivoted Columns” option from the “Applied Steps” window, as shown in the following screenshot.
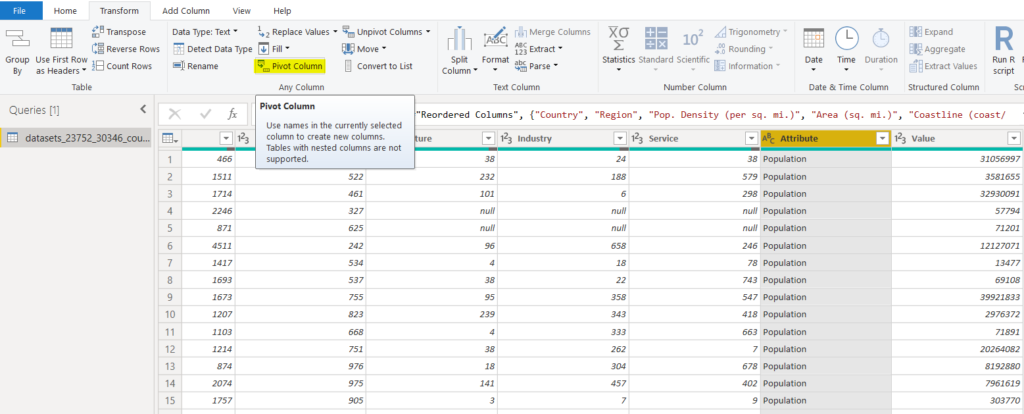
The other option is to select a column and then select “Transform -> Pivot Column” from the top menu, as shown below.
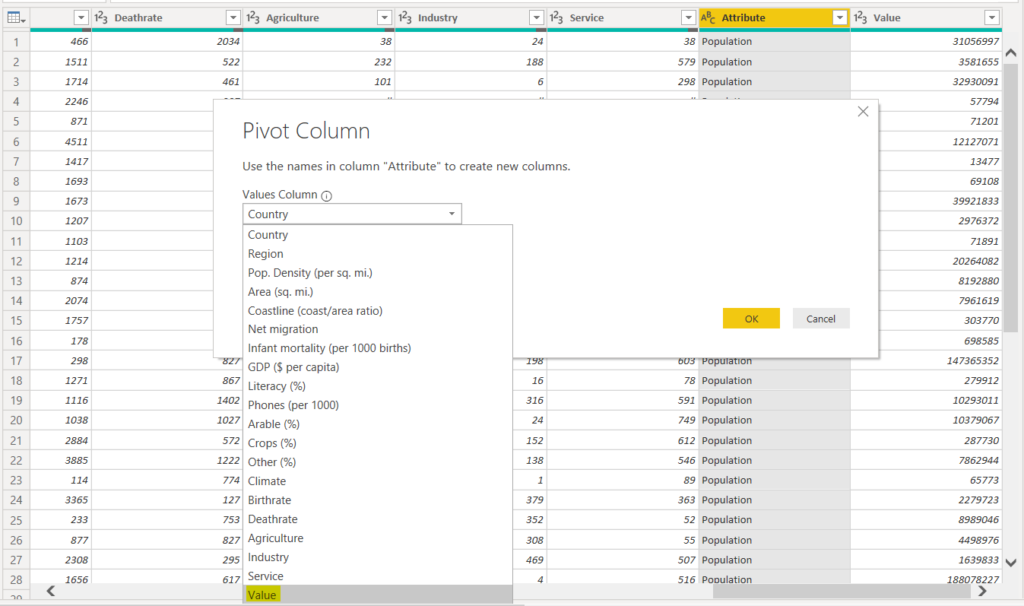
While pivoting a column, you have to specify the column that contains the values for the unpivoted column. In our case, the “Value” column contains values for the unpivoted “Attribute” column. Look at the following screenshot for reference.
The pivoted “Population” column looks like this:
Move the “Population” column just beside the “Pop. Density (per sq. mi.)” column by clicking the “Population” column header and dragging, as shown in the following screenshot.
Next, we will unpivot two columns, i.e., “Population” and “Pop. Density (per sq. mi.)”. Select both of the column headers and then unpivot them, as shown below:
After unpivoting, you should see the following two columns created in the dataset. You can see that the “Attribute” column now contains information about “Population” and “Pop. Density (per sq. mi.)”.
Select both the column headers (CTRL + Click) and then drag the columns just beside the “Country” column, as shown below.
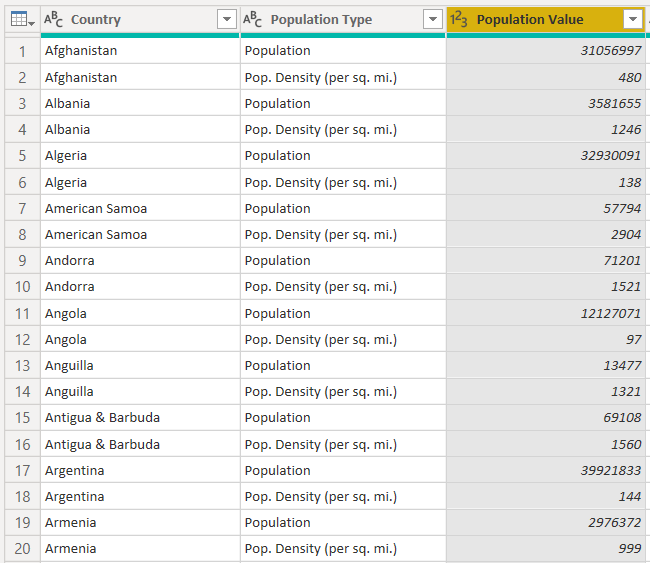
Now, you can see “Country” names, their total population and population density per square mile. Let’s change the name of the “Attribute” column to “Population Type” since the “Attribute” column shows two types of population: the total population and the population density per square mile. The dataset with an updated column header name looks like this:
Splitting Columns
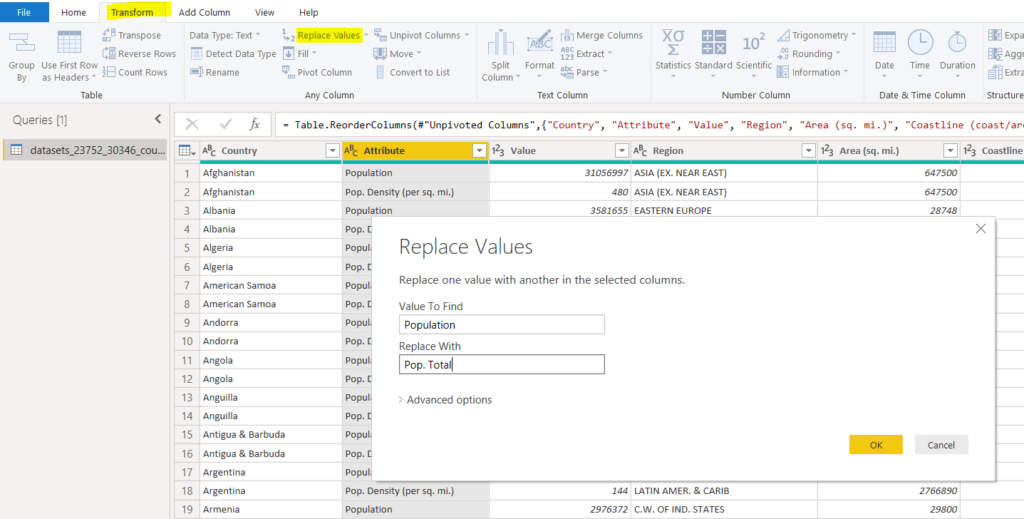
Before splitting columns, we will replace some values in the “Population Type” column.
The value “Population” in the “Population Type” column refers to the total population. We will replace the value “Population” with “Pop. Total” so that it has the same pattern as “Pop. Density (per sq. mi.)”. To replace values in columns, go to “Transform -> Replace Values”, as shown in the following screenshot.
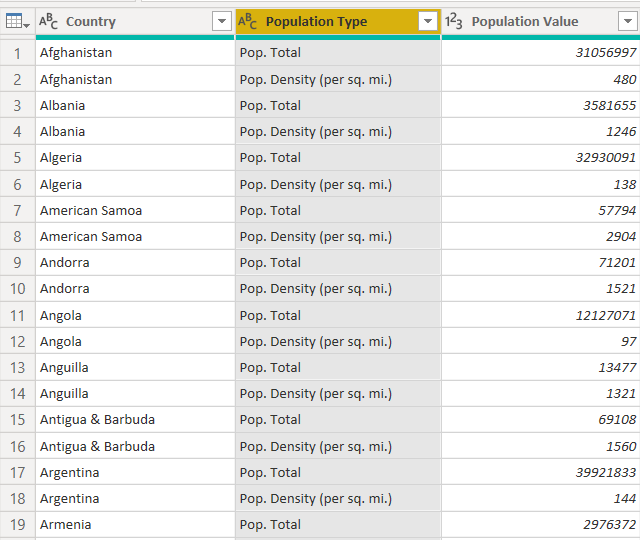
After replacing the values, the dataset looks like this.
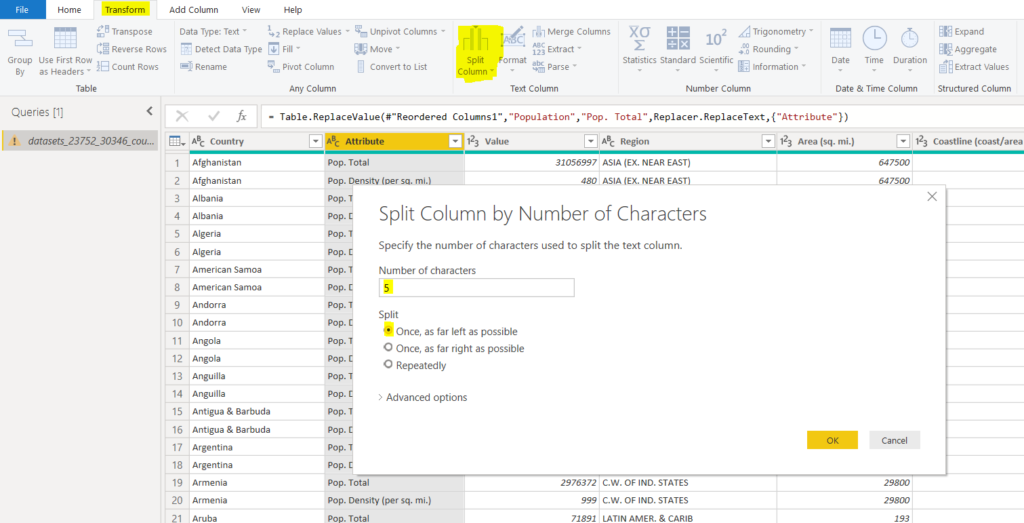
Now, we will split the “Population Type” column into two. Its first five characters will be added to the first column, while the remaining characters will be added to the other column. To split a column, go to “Transform -> Split Columns”. We will be splitting by first five characters, therefore, select the “Split by Number of Characters” option from the dropdown. We will split the column by first 5 leftmost characters. For reference, look at the following screenshot.
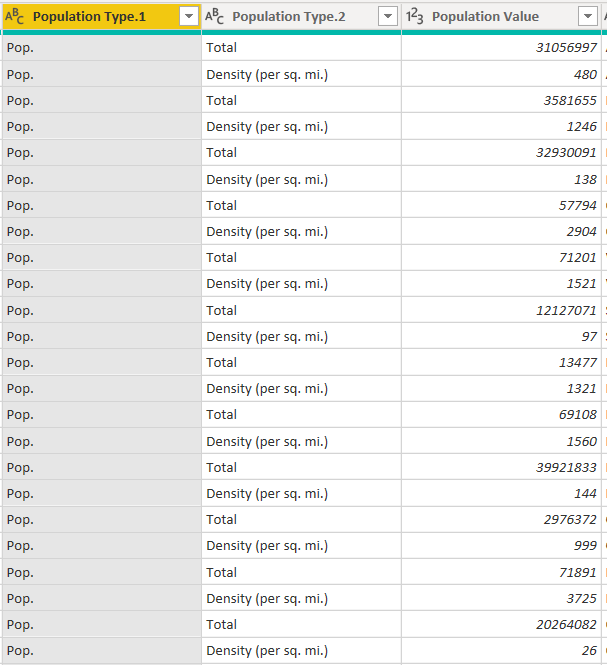
Once the columns are split, you should see the following two columns.
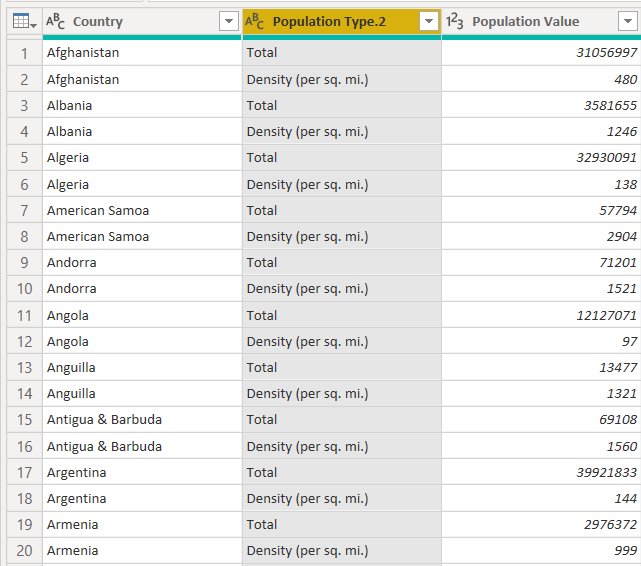
We only need the “Population Type.2” column since it contains information about the type or scale of the population. Click the “Population Type.1” column and then select “Delete”.
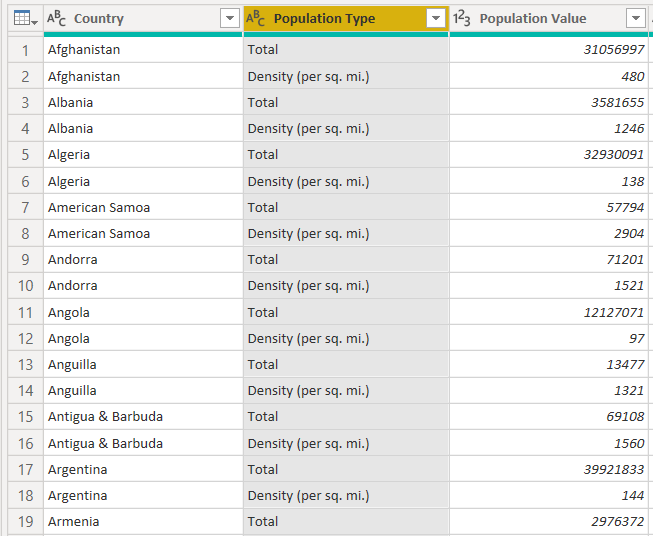
Finally, you can rename the “Population Type.2” column to “Population Type” as shown below.
From the following figure, you can see that there are two different types of population values for each country. The “Total” value in the “Population Type” column refers to the total population of the country. The actual value for the total population is stored in the “Population Value” column. Similarly, the value “Density (per sq. mi.)” shows that this population value refers to population density.
Conclusion
In summary, the article shows you how to perform pivoting and unpivoting in Power BI query editor. Additionally, it covers the basic theory behind pivoting and unpivoting columns illustrated by clear examples. Finally, the article explains how the process of splitting columns is implemented in Power BI query editor.
Tags: power bi, query editor, visualization Last modified: September 20, 2021