This article is about working with Microsoft Analysis Services and a little bit about the repository on Microsoft SQL Server that SSAS is working with. We’ll consider some interesting solutions that helped me easily do things that seemed sophisticated before.
Period average
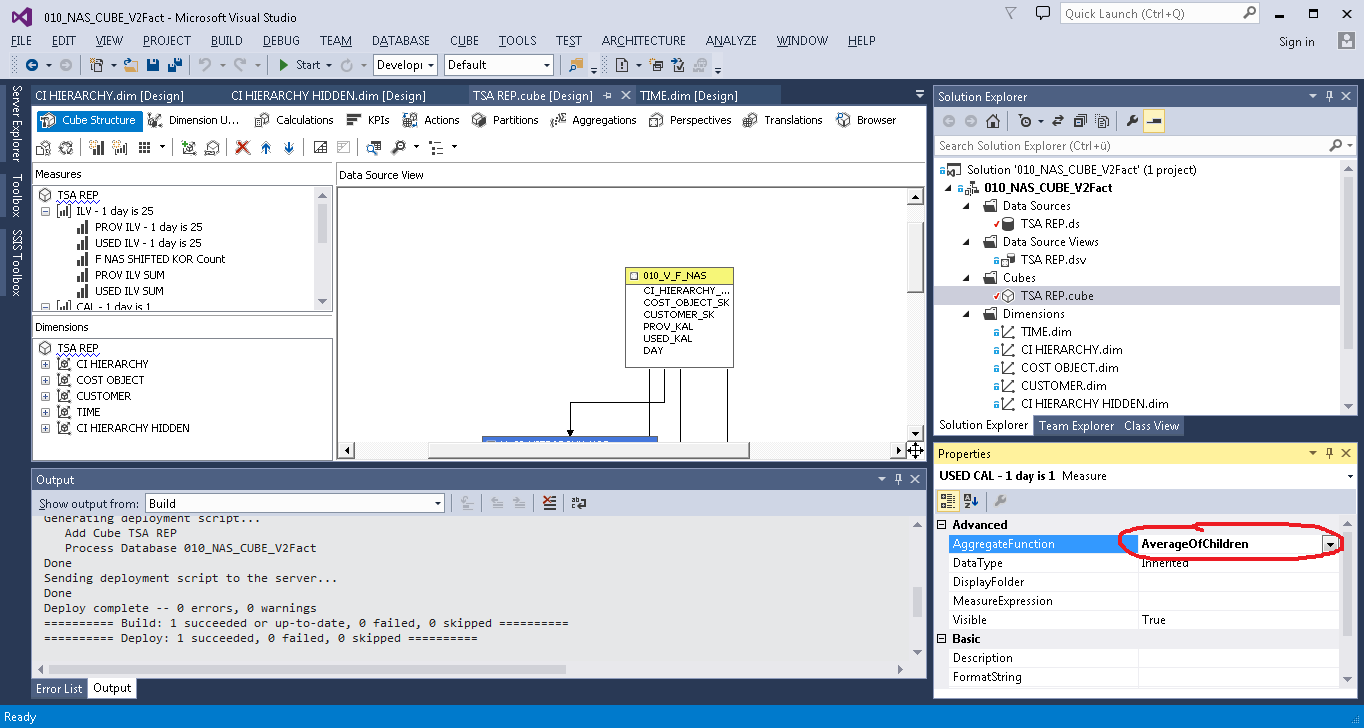
I had a task to calculate the average value for a period. In MS Analysis Services, there is the Average of Children function which counts the average of all non-empty values for the selected period.
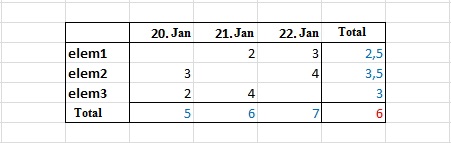
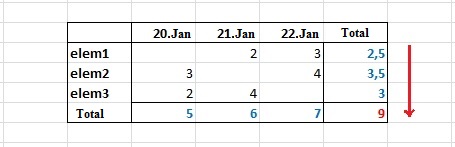
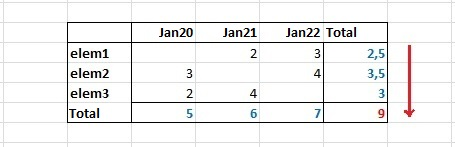
But the customer, after careful examination of the results, got questions. He showed me the following sample and said that it was incorrect:
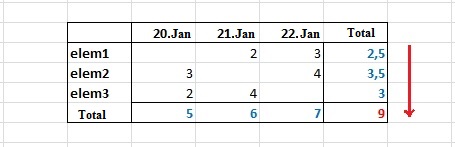
In his opinion, it should be like this:
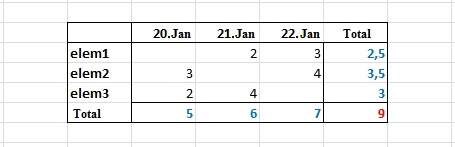
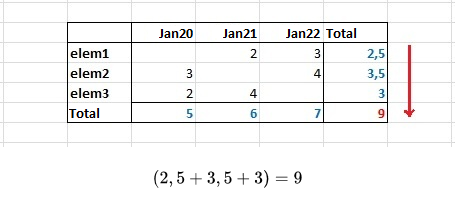
He told he needed not the average value for the period, but the sum of the average values for each element for the period.
NOT THIS WAY:
(5 + 6 + 7) / 3 = 6
BUT LIKE THIS:
(2.5 + 3.5 + 3) = 9
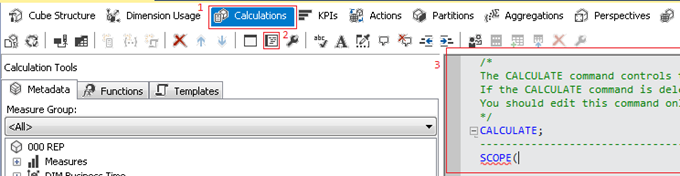
The decision was hardly obvious. In the Calculations section, I created Calculated Member and wrote an expression using functions iif, isleaf, and sum.
First option:
iif (
not isleaf([ELEM].[ELEM SK].currentmember),
sum(EXISTING [ELEM].[ELEM SK].currentmember.Children,[Measures].[FCT VAL]),
[Measures].[FCT VAL]
)
where [ELEM] is the measurement, and [ELEM SK] is its key.
The result was unexpected:
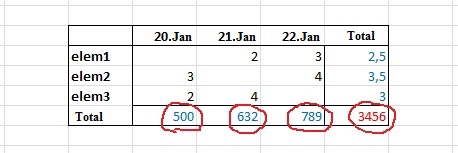
The strange numbers in the Results turned out to be the sums of all values of the elements in the measurement, no matter what values I chose in the filter. That is, there has always been a sum of all the elements, not just the selected ones.
The problem was not solved, and it took some time. The first solution was a variant with an additional hidden measurement. I created a copy of the [ELEM] measurement, changed the Visible property to False, and wrote this script:
iif (
not isleaf([ELEM].[ELEM SK].currentmember),
sum(EXISTING [ELEM COPY].[ELEM SK].currentmember.Children,[Measures].[FCT VAL]),
[Measures].[FCT VAL]
)
This result was as the customer wanted.
Later, I found a better solution. I created a Named Set.
CREATE DYNAMIC SET CURRENTCUBE.[Controller Set]
 AS  {
EXISTING [ELEM].[ELEM SK].currentmember.Children
};
And, I rewrote Calculated Member as follows:
iif (
not isleaf([ELEM].[ELEM SK].currentmember),
sum([Controller Set],[Measures].[FCT VAL]),
[Measures].[FCT VAL]
)
Thus, a copy of the [ELEM COPY] measurement was no longer needed.
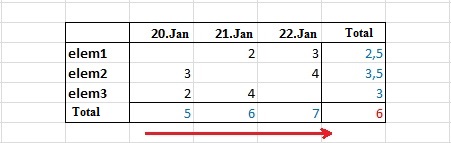
I presented this solution to the customer and got busy with other tasks. After some time, I received a new technical assignment, which featured a “statistical average”. To my question – What is this? He said that users do not need the sum of the average values for each element for the period, but the period average, that is, a usual Average of Children, but he asked me to keep my solution.
Additionally, he asked to add the period average taking into consideration all the days, not just those in which there are values.
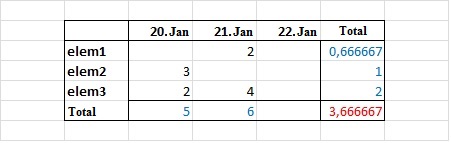
(5 + 6) / 3 = 3.666667
I solved the task with the help of an additional fact, which simply counted the number of lines in the table for Time Dimension (in this solution, there is always one record for each day in this table).
Further, I added the facts with aggregation – sum (AggregateFunction = Sum) and Calculated Member, in which the Sum was divided by the number of days.
[Measures].[Sum DATA]/[Measures].[TIME Count]Storage
We faced a more global task – to develop storage (Data Vault), but not a simple one. The first thing we were told is that now our Bible is “Building a Scalable Data Warehouse with Data Vault 2.0” and insisted on adding “Bitemporal Database Table Design“.
We were to build a cube with historicity based on the constructed storage. This cube should have 2 time dimensions. One would show a business date, and another – a transaction date. The essence of “Bitemporal Database Table Design” is that each record has 4 additional fields:
- Business_date_ from
- Business_date_to
- Transaction_date_from
- Transaction_date_to
The first two contain the interval of business dates – from which date and by which date a value did not change. The other 2 fields contain the interval of transaction dates. The period during which the value was not adjusted (as an option ante-dated) is stored in this interval.
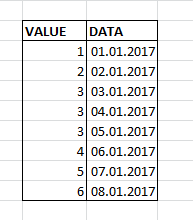
One of the problems in solving this task was the source data, more precisely their form. Data came as daily slices. There was the Date field which stored the date, the next day, a new value was in the Date field, and the data either changed that day or not.
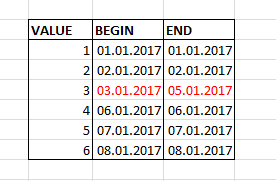
It was required to combine the data into periods. If, for example, a value remained unchanged for 3 days in a row, 3 lines must be saved as one with two columns BEGIN and END, instead of column DATA.
Data before conversion:
Data after conversion:
I solved this problem using functions LAG and LEAD. The essence of the solution is that if a value is not changed for 3 days in a row, the date from the current line minus the date from the previous one will equal 1:
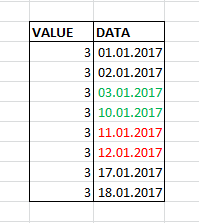
- If the data are in succession, then 01.2017 – 11.01.2017 = 1
- If there is a gap between the data, then 01.2017 – 03.01.2017 = 7
The result is:
SELECT * FROM (
		SELECT Volume
			,[Date] dt
		,DATEDIFF(day, LAG([Date], 1) OVER (PARTITION BY Volume ORDER BY [Date]), [Date]) difLag
,DATEDIFF(day, [Date], LEAD([Date], 1) OVER (PARTITION BY Volume ORDER BY [Date])) difLead
		FROM dbo.Test n
		) m
	WHERE ( difLag > 1 OR difLag IS NULL )
		OR ( difLead > 1 OR difLead IS NULL )
Next, we must somehow group this result, combine the pairs for those periods that lasted more than one day, and leave those, the period of which lasted one day.
I did the grouping, numbered the lines, and combined the even and odd ones.
WITH se AS (
	SELECT * FROM (
		SELECT Volume
			,[Date] dt
			,DATEDIFF(day, LAG([Date], 1) OVER (PARTITION BY Volume ORDER BY [Date]), [Date]) difLag
			,DATEDIFF(day, [Date], LEAD([Date], 1) OVER (PARTITION BY Volume ORDER BY [Date])) difLead
		FROM Test n
		) m
	WHERE (difLag > 1 OR difLag IS NULL) OR (difLead > 1 OR difLead IS NULL)
	)
,p1 AS --choose only one day periods (be careful)
	(
	SELECT Volume
		,dt AS VT_BEG
		,dt AS VT_END
	FROM se
	WHERE NOT (isnull(difLag, - 1) = 1 OR isnull(difLead, - 1) = 1)
	)
,p2 AS (
	SELECT Volume
		,CASE WHEN difLead IS NOT NULL AND (difLag IS NULL OR difLag > 1) THEN dt END AS VT_BEG
		,CASE WHEN difLag IS NOT NULL AND (difLead IS NULL OR difLead > 1) THEN dt END AS VT_END
		,row_number() OVER (ORDER BY Volume,dt) AS rn
	FROM se WHERE isnull(difLag, - 1) = 1 OR isnull(difLead, - 1) = 1
	)
SELECT *
FROM (
	SELECT
	     min(Volume) AS data
		,min(VT_BEG) AS VT_BEG
		,min(VT_END) AS VT_END
	FROM p2
	GROUP BY (CASE WHEN rn % 2 = 0 THEN rn ELSE rn + 1 END)

	UNION ALL

	SELECT Volume,VT_BEG,VT_END	FROM p1
	) g
ORDER BY VT_BEG	,data
Of course, there were a lot of routines, disputes, and other, not so original, solutions. Still, these were the most (in my opinion) interesting things that were in the project.
OLAP Cube – Period Average Sum
The next task is to provide a sum of average values for each element per period, as shown below:
The Solution – Variant 1
For this variant, we need to create a hidden measurement [ELEM COPY]. We create a copy of [ELEM] and assign False to the Visible property. Next, we need to select New Calculated Member in the Calculations section of the cube, as shown below:
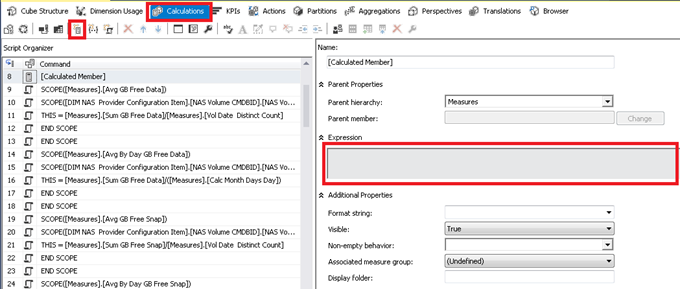
And write the following in the Expression text box:
iif (
not isleaf([ELEM].[ELEM SK].currentmember),
sum(EXISTING [ELEM COPY].[ELEM SK].currentmember.Children,[Measures].[FCT VAL]),
[Measures].[FCT VAL]
)
Where [ELEM COPY].[ELEM SK] – is the key attribute of the hidden dimension.
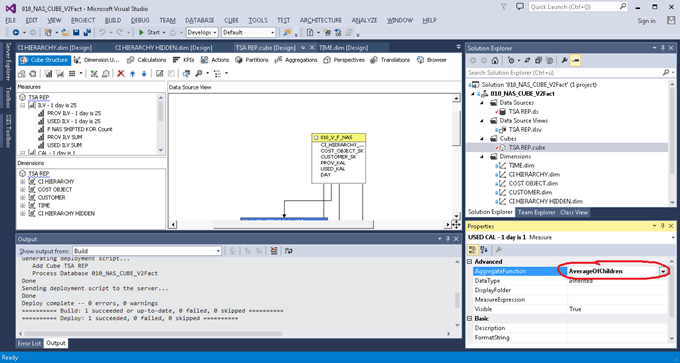
[Measures].[FCT VAL] – is the AvarageOfChildren aggregation, i.e. when assembling the cube, the measurement of the AvarageOfChildren type was created and the cube calculated it automatically. Here is an example of how to create the calculation with the AvarageOfChildren aggregation:
The Solution – Variant 2 with Scope
This solution was presented to me by a colleague of mine. In my opinion, it is simpler for understanding, though it is harder in terms of implementation.
We need to rewrite SELECT for the fact table. Instead of:
SELECT [DATE]
	,ID_CO
	,ID_CUST
	,ID_SYS
	,ID_VOL
	,ID_QUAL
	,GB_used_DATA
FROM [000_REP].NAS_FACTS
we must write the following:
SELECT [DATE]
	,ID_CO
	,ID_CUST
	,ID_SYS
	,ID_VOL
	,ID_QUAL
	,GB_used_DATA
	,CONVERT(VARCHAR(10), [DATE], 120) + '|' + CAST(ID_VOL AS VARCHAR(MAX)) AS VolDate
	,NULL AS Avg_GB_used_DATA
FROM [000_REP].NAS_FACTS
Where GB_used_DATA is the fact we want to add to the cube. We need to make a non-standard behavior for the dimension with the ID_VOL key.
As for the rest of the dimensions with keys ID_CO, ID_CUST, ID_SYS, and ID_QUAL, the behavior must remain standard. In our task, everything must be simply summed up. Only for ID_VOL, the period average must be calculated for each element, and the total for the ID_VOL elements must be summed up as well. The sum of average values for ID_VOL is expected as a result.
In the second query, we added 2 columns.
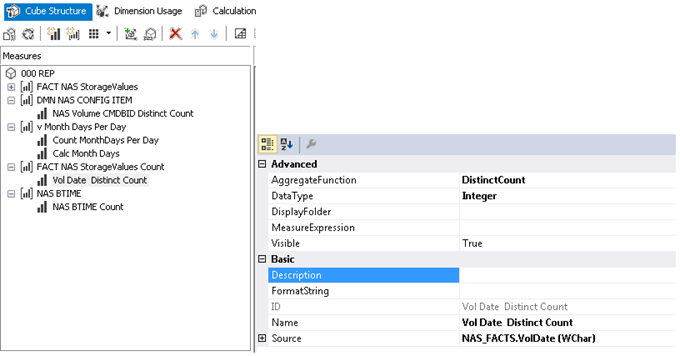
The first column uniquely determines the binding between the date and Id elements, for which the sum of average values must be calculated. A dimension with the DistinctCount aggregation function is added to the cube by this column. An example is below:
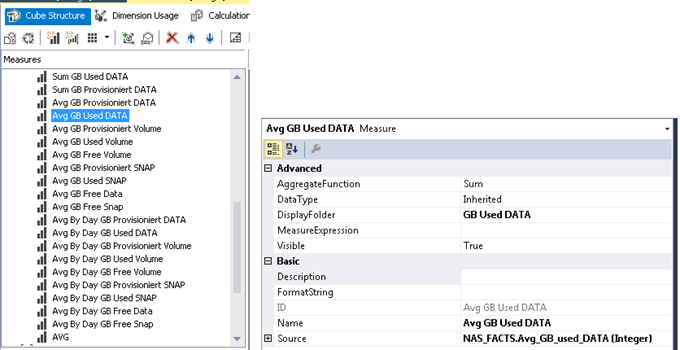
The second column always stores the NULL value in all rows of the table. Its name plays an important role – we require it to create a dimension in the cube we can use for binding with the SCOPE function. It is also important to use the Sum aggregation function for this dimension. See the example:
Next, in the Calculations section of the cube, we need to select Script View and put the following code into the text box:
SCOPE([Measures].[Avg GB Used DATA]);
        SCOPE([ID_VOL Items].[ID VOL].[ID VOL].MEMBERS);
            THIS = [Measures].[Sum GB Used DATA]/[Measures].[Vol Date  Distinct Count];
        END SCOPE;
END SCOPE;
[ID_VOL Items] is a calculation with the ID_VOL key.
See the sequence of steps to execute the task:
In this solution, we sum only the expression that is written in SCOPE. Without a formula in SCOPE, it will store the NULL value that comes from the query to the database.
Both solutions gave identical results and calculated the average sum, as required.
Statistical Average
After a while, the customer returned to the topic of calculation of average values. This time, he wanted a classical average instead of the average sum. Therefore, he needed the same functionality as the AVERAGE function in Excel. The customer constantly used the Statistical Average term to describe the task.
We needed to calculate the average value for the whole range. An average for all elements for each day is divided by the number of days in the period. As a result, we get the average values for one element per period. The following solution was supposed:
CREATE MEMBER CURRENTCUBE.[Measures].[Avg GB Used DATA (AvgAll Only valid days)]
as
[Measures].[Sum GB Used DATA]/[Measures].[Count VCMDB Only valid days],
VISIBLE = 1  ;

CREATE MEMBER CURRENTCUBE.[Measures].[Count VCMDB Only valid days]
as
Count(NonEmpty({crossjoin([DIM Business Time HD].[DAY].currentmember.Children,[DIM NAS  Provider Configuration Item HD].[NAS Volume CMDBID].currentmember.Children)}, [Measures].[Sum GB Free Data] )),
VISIBLE = 1  ;
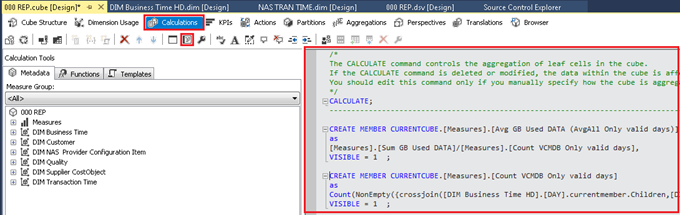
In this solution, we only use the day where the element values were present. Also, we use a trick with a hidden dimension (these are dimensions [DIM Business Time HD].[DAY] and [DIM NAS Provider Configuration Item HD].[NAS Volume CMDBID]). We got the number of days with the values with help of crossjoin.
To get the average for all values for all days, where the absence of values for a day is set equal to zero, I used the following expression:
CREATE MEMBER CURRENTCUBE.[Measures].[Count VCMDB All days]
as
[Measures].[NAS Volume CMDBID Distinct Count] * [Measures].[NAS BTIME Count],
VISIBLE = 1  ;
CREATE MEMBER CURRENTCUBE.[Measures].[Count VCMDB All days]
as
[Measures].[NAS Volume CMDBID Distinct Count] * [Measures].[NAS BTIME Count],
VISIBLE = 1  ;
[Measures].[NAS Volume CMDBID Distinct Count] and [Measures].[NAS BTIME Count] are measures of the cube built by the tables for dimensions (temporary dimension and element dimension):

One more useful function
It was required to change the calculation of values depending on the hierarchy level. If the days were selected, we would see the average per period. If months were selected, we would see the sum. It was done with help of the level function:
CREATE MEMBER CURRENTCUBE.[Measures].[ML]
as
 case
     when [DIM Business Time].[HIERARCHY CAL].currentmember.level is [DIM Business Time].[HIERARCHY CAL].[YEAR] then 3
     when [DIM Business Time].[HIERARCHY CAL].currentmember.level is [DIM Business Time].[HIERARCHY CAL].[PERIOD KAL] then 2
     when [DIM Business Time].[HIERARCHY CAL].currentmember.level is [DIM Business Time].[HIERARCHY CAL].[DAY] then 1
     else 4
 end,
VISIBLE = 1;
Conclusion
All our solutions fell under firm and rigorous testing. We had to go deep into the work and found our original solutions for the tasks set. This experience turned out useful for me, so I decided to share it with you.
Tags: sql server, ssas Last modified: October 13, 2021