
The centralized data modeling approach is really helpful in many practical scenarios. This article focuses on achieving it using Power BI Templates and sharing the centralized Power BI data model across the organization. In addition, we are going to highlight the importance of maintaining common reporting tables in a central location for better management.
In this article, we are going to explore the following topics:
- The Data Modeling Basics
- What Is Centralized Data Modeling?
- How Is the Data Loaded into Power BI?
- What is a Power BI Template?
- What is the Difference Between Power BI Template and Power BI Report?
- Can We Convert a Power BI Report into a Power BI Template?
- How to Centralize the Organizational Data Modeling with Power BI Template
- Prerequisites
- The Sample Organization Business Requirement and Proposed Solution
- Visualizing the Data Source
- Manually Populating Data Source Tables
- The Data Model Design Check
- Editing the Product (ProductWFH) and Sales (FACT Sales) Table Relationship
- Export the Power BI Report as the Power BI Template
- Using the Power BI Template to Build New Reports
- Professional Life Tip
- Things to Do
The Data Modeling Basics
Power BI Data modeling is the way you can arrange and link your organizational data (typically in the form of tables) for reporting and analysis.
In other words, it is the strategy of lining tables with each other to get useful information by following the standard practices and domain knowledge of the organization.
There are several Power BI data modeling best practices that allow for performance improvement.
Traditionally, it stands for implementing the star or snowflake schema from the perspective of the data warehouse BI solution.
What Is Centralized Data Modeling?
Centralized data modeling means a generic data model consisting of some commonly used tables, relationships, and hierarchies that are shared across the organization. These elements are the starting point for Power BI report development to anyone eligible, interested, and capable to do so. They can be kept on the Power BI report server.
How Is the Data Loaded into Power BI?
Data can be loaded into the Power BI report by importing it from another source, such as the data warehouse database specially optimized for business intelligence operations.
Note: There is a Power BI data model size limit which is 1 GB per dataset that is imported into Power BI. If the Excel experience is kept, instead of importing the data, the limit is 250 MB for the dataset.
Also, you can author the paginated reports with Power BI Report Builder.
What is a Power BI Template?
A Power BI Template is a template/general structure that the Power BI user or developer can build to share across all members of the organization and create other reports by using it.
What is the Difference Between Power BI Template and Power BI Report?
- A Power BI report is a single standalone report that can you can publish for multiple business users to view.
- A Power BI Template is a structure that contains some generally used tables and their relationships. These elements can be shared with other internal users or developers to build further reports. In some cases, you provide such templates to business users who are capable of building reports.
The major difference between the Power BI Template and the Power BI report is that the template does not hold any (imported) data. The report does.
In other words, the Power BI Template is a structure of the data (database) without the data ready for reporting. The Power BI report is a report that has both the structure and the data arranged as tables with relationships and hierarchies.
Can We Convert a Power BI Report into a Power BI Template?
Yes, we can do it. In fact, it is a standard way of creating a Power BI template.
How to Centralize the Organizational Data Modeling with Power BI Template
There does not seem to be any direct method to create a new Power BI Template in Power BI Desktop. So, we begin with a Power BI report that we’ll turn into a template by simply exporting it as a template file.
However, this sample export must be strong and solid enough to present a template for the organization’s centralized Power BI data modeling strategy.
Prerequisites
- Knowledge of the database and data warehouse basic concepts
- Understanding the Power BI reports
- Power BI Desktop must be installed on your PC/Laptop
The Sample Organization Business Requirement and Proposed Solution
Our sample organization is called Work From Home. It offers a smart range of products suitable for work from home to both private and business clients.
This company asked its report developer to build a centralized data model. This model is going to be used by internal users for making Power BI reports based on the commonly used data structure.
The report developer has come up with the idea of using the Power BI Template to form a centralized data modeling strategy.
Visualizing the Data Source
Let us assume the company has a fully functional data warehouse database consisting of the following tables:
- ProductsWFH
- ClientsWFH
- FACT Sales
Manually Populating Data Source Tables
We are going to manually create and populate the main tables of the data warehouse database to save additional steps required to import data from a database.
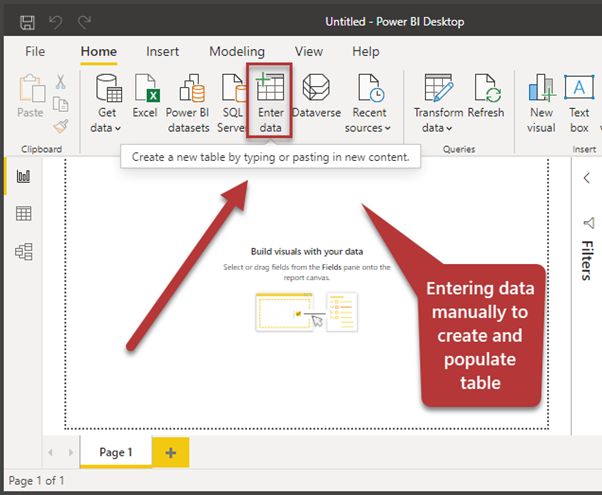
Open your Power BI Desktop and close the data import window that shows up straight away.
On the Home tab click Enter data:
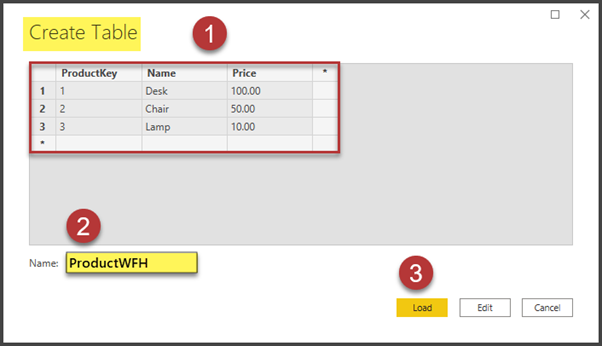
Create a blank table called ProductWFH by entering the following data:
| ProductKey | Name | Price |
| 1 | Desk | 100 |
| 2 | Chair | 50 |
This is illustrated as follows:
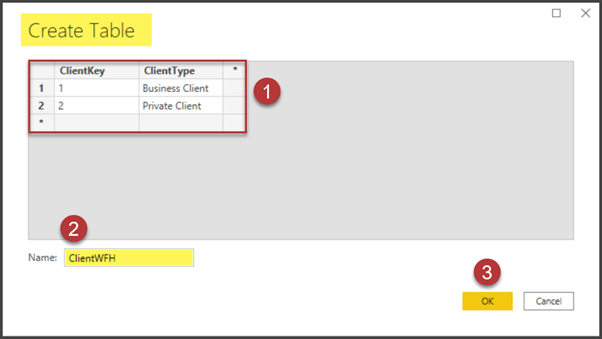
Similarly, enter data for another table called ClientWFH:
| ClientKey | Type |
| 1 | Private Client |
| 2 | Business Client |
The output is:
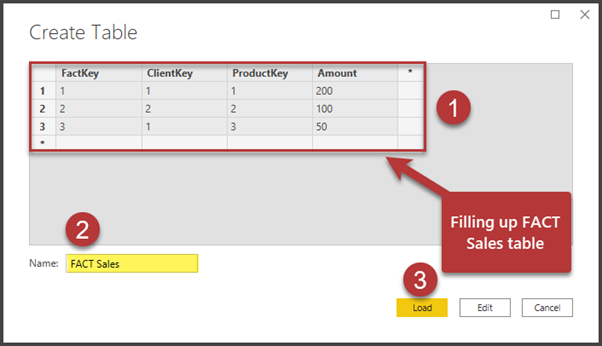
Finally, let us set up the FACT table as per standard practices of a data warehouse business intelligence solution. We’ll call it FACT Sales and enter the following data:
| FactKey | ClientKey | ProductKey | Amount |
| 1 | 1 | 1 | 200 |
| 2 | 2 | 2 | 100 |
| 3 | 1 | 3 | 50 |
This is shown as below:
The Data Model Design Check
If we switch to the Model view by clicking the Model icon on the left navigation bar in Power BI Desktop, we’ll see that our data model has already been set up along with relationships.
This automated step took place because Power BI is smart enough to detect keys to build a relationship. As long as we follow this standard pattern, we do not need to join tables manually via keys:
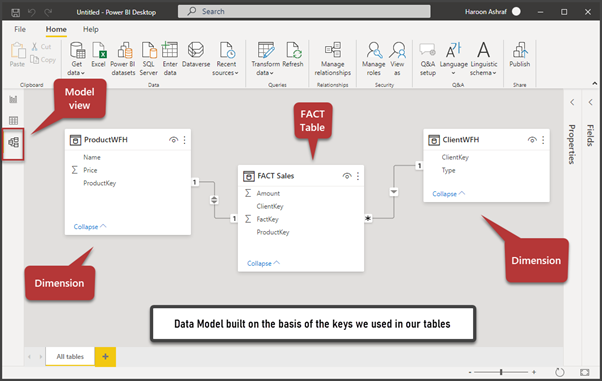
There is one small potential problem in the above design, however. It is that the relationship between Product and Sales is one-to-one. We must resolve it.
Editing the Product (ProductWFH) and Sales (FACT Sales) Table Relationship
As we had input the data manually into the FACT table, the system assumed that Sales has a one-to-one relationship with Product automatically.
Switch to the Data view and click on FACT Sales to see this table:
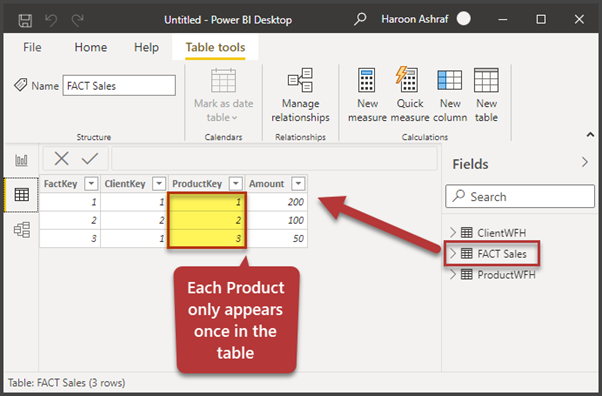
Unlike ClientKey (client), our ProductKey (product) occurs only once for each row. That is why Product and FACT Sales have a one-to-one relationship. But we know that one product may be ordered by many clients. This is our issue to fix.
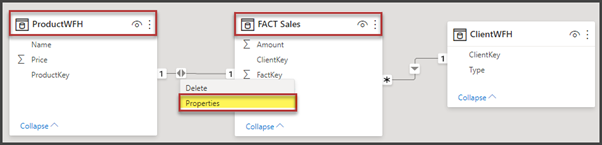
Switch to the Model view, right-click on the relationship between ProductWFH and FACT Sales, and click Properties:
Change the Cardinality to One-to-many (1:*). Then select the Single Cross filter direction and click OK:
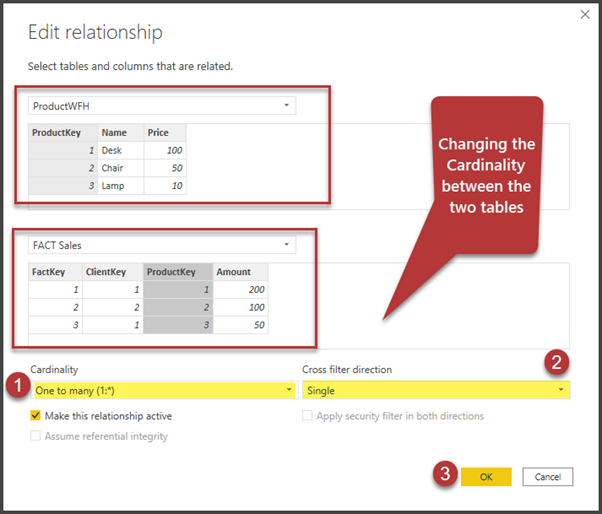
Check the changes to see the updated tabular relationships:
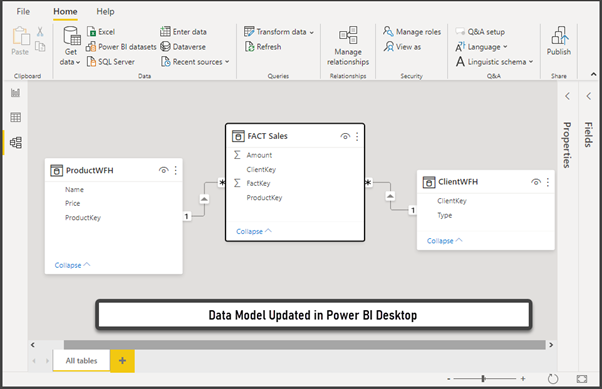
The Data Model is ready to become the standard centralized framework that we can share across the organization to build the Power BI reports. We see that the same client can place many orders, and the same product can be ordered by many clients.
Export the Power BI Report as the Power BI Template
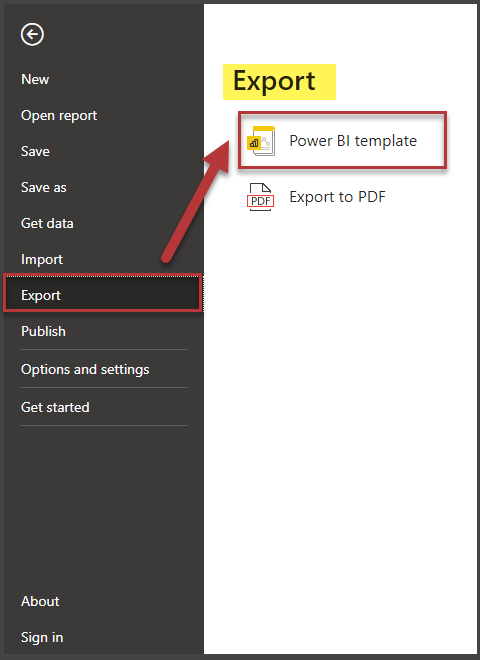
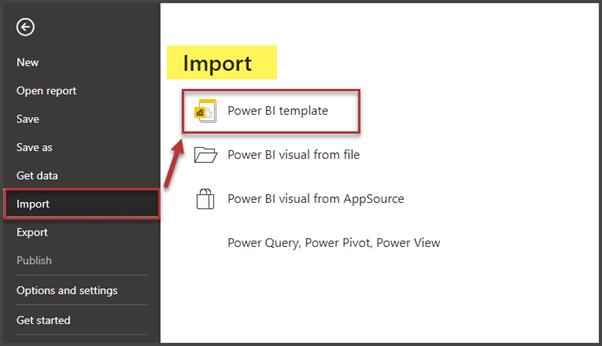
Now is the time to turn our Power BI file into a Power BI template. On the File tab, click Export and select Power BI Template:
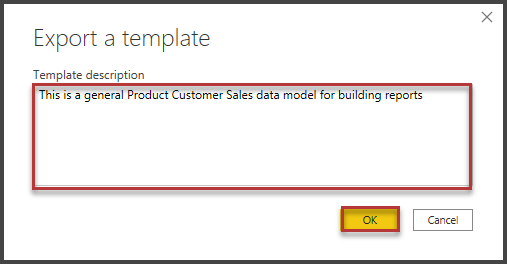
Add some description and click OK:
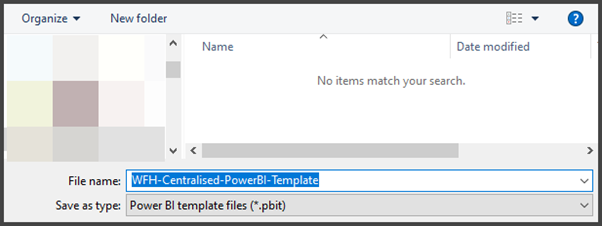
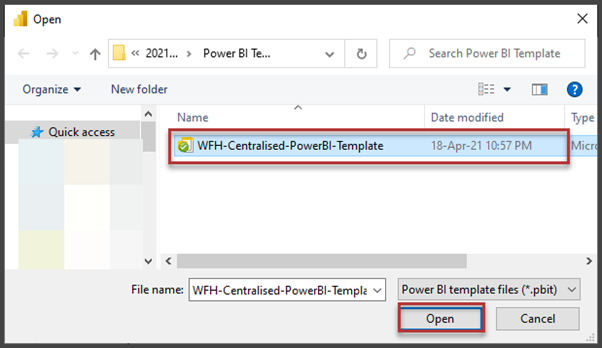
We have named our template WFH-Centralized-PowerBI-Template and saved it to a centrally shared local or remote location:
Now we can see the stored centralized data model in action.
Using the Power BI Template to Build New Reports
Open a new instance of Power BI Desktop and import the Power BI Template:
Select the location where the template is stored:
View the results:
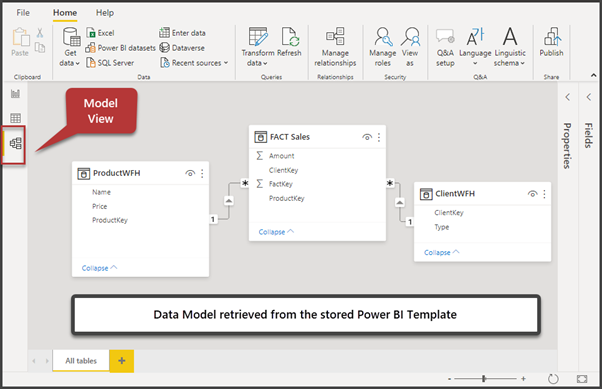
Congratulations! You have successfully built the centralized data modeling strategy in the form of a Power BI Template. Now you can share this template across your organization and create any Power BI report based on it.
Professional Life Tip
Remember that we can use some other strategies in professional life scenarios. For instance, we can centralize the business logic and data model using SQL Server Analysis Services or Azure Analysis Services. This way, we build and manage the data model which will be consumed by the Power BI report.
Things to Do
Try the following things to improve your skills further:
- Refer to the previous How to Create the Date Table in Power BI article and try adding the OrderDate column to FACT Sales and join it with the Date table
- Create a Date Table and add custom date hierarchies to the template (refer to Learn to Create and Use Custom Date Hierarchies in Power BI)
- Try creating another template for the sample database referenced in the article How and When to use Multiple Date Tables in Power BI


Hello! I’ve been following your website for a while now and finally got the courage to go ahead and give you a shout out from Porter Texas! Just wanted to tell you keep up the good job!|