
Ever wondered why Oracle Performance Tuning is so thrilling for budding Oracle developers and DBAs?
The answer lies in the art of transforming a sluggish database into a finely-tuned powerhouse. At first, it might seem as complex as decoding a mad scientist’s experiment.
But fear not!
This article is your guide, turning the daunting into doable with practical examples. Soon, tuning Oracle performance will become second nature to you.
And the end result?
Turning your Oracle into a speed powerhouse will make your users and your boss happy. You’ll also level up your game to become an Oracle expert.

So, let’s dive into this challenging but fun journey. Here’s the itinerary:
- Basics of Oracle Performance Tuning
- 8 Common Myths Debunked
- 5 Tips for Effective Oracle Performance Tuning
- Oracle Performance Tuning Examples
- Hidden Secrets in Oracle Performance
Ready? Let’s begin this exhilarating journey!
Basics of Oracle Performance Tuning
If you plan to jump into the examples right away, PLEASE STOP. Understand this fundamental truth — it’s not just about tools. It’s about mastering the basics that lay the foundation for effective tuning.
Why Performance Tuning is Crucial
Performance tuning is the heartbeat of Oracle-powered systems. It’s the key to unleashing the full potential of your Oracle database. If your app or website uses Oracle to store data, you need to make sure it’s always fast. Or your users will get pissed off. Do you know that you only got 16 seconds tops before that happens?
So, if you don’t want to lose customers or something with the same heavy impact, make performance a priority.
Start with these if you are new to Oracle performance tuning
- Know What Your Oracle License Covers
Oracle’s performance tuning tools are potent. But be aware—they might be behind a paywall. The Oracle Database Tuning Pack, for instance, requires an extra license. Consult Oracle support to unlock these powerful tools for fine-tuning. - Understand Oracle Database Architecture
This isn’t just for DBAs. Database designers and developers must grasp Oracle’s query processing lingo. To create high-performing databases and apps, you need to have a good database design. Then, dance with the optimizer and execution plans. Tune in to how Oracle databases move and groove. - Know SQL and PL/SQL Well
Even in a world of graphical tools, SQL newbies can get lost without understanding the syntax. To effectively tune queries, you must know the language. SQL and PL/SQL mastery is your tuning compass. - Use Tools That are Simple and Increase Productivity
No fancy tools? No problem. Dive into the V$ Performance views to spot and study sluggish queries. If you’re eyeing a tool, make sure it’s not just a pretty face—opt for productivity boosters. In this journey, we’ll be wielding the power of dbForge Studio for Oracle.
Before we continue our journey, let’s have a short detour on some myths about database performance tuning.
8 Common Myths Debunked
Myth 1: Add more hardware to fix all performance problems
It’s a common misconception that throwing more hardware at performance issues is a silver bullet. In reality, hardware upgrades don’t address underlying inefficiencies. They are only temporary.
Myth 2: Performance tuning is only needed for large databases
Performance tuning is not reserved for giants; small and mid-sized databases benefit equally. Neglecting tuning based on the size of your database can lead to suboptimal performance even in compact systems.
Myth 3: SQL tuning is the DBA’s job
Contrary to belief, SQL tuning is a collective responsibility. Developers, database designers, and DBAs all play a role. Efficient SQL directly impacts performance, and a collaborative effort ensures a well-tuned database.
Myth 4: Indexing solves everything
Believing that indiscriminate indexing is the cure-all. While indexes boost performance, too many or improper indexes can introduce overhead. Database write performance degrades with unnecessary indexes. A strategic indexing approach is essential for optimal results. While Oracle has automatic indexing that could solve indexing problems, it’s also not a cure-all. Seasoned administrators use a hybrid approach.
Myth 5: Upgrade fixes all issues
The notion is that upgrading to the latest Oracle version magically fixes performance issues. Upgrades bring enhancements, but successful implementation demands meticulous planning and thorough testing.
Myth 6: Caching eliminates performance concerns
Relying solely on caching mechanisms as a performance magic pill is just a dream. True, caching helps. But well-optimized queries and database design remain pivotal for sustained high performance.
Myth 7: Partitioning solves scalability
Assuming that partitioning a table guarantees scalability. While it aids in managing large datasets, it’s not a universal solution. Careful consideration of database architecture is crucial.
Myth 8: No tuning needed for cloud databases
Thinking that cloud databases automatically optimize performance. Even in the cloud, performance tuning is indispensable for unlocking the full potential of your database. And for your information, the samples we have later will use Oracle 19c in Oracle Cloud. You will see that there’s something else you need to optimize.
Now that you know these myths exist, avoid it like a plague. Instead, focus on how to add a turbo boost to your database. Let’s discuss this in the next section.
5 Tips for Effective Oracle Performance Tuning
If you think you will see tips like “Avoid SELECT *” or “Avoid SELECT DISTINCT”, these are not your usual tips. Those are not bad tips at all. But you’ll find the tips below to be obvious as well. These are still basic compared to a ton of performance discussion in the Oracle documentation.
But it all starts in the following tips. Let’s begin.
Tip #1: Design Your Oracle Database for Performance
Normalize your Oracle database using the right data types and sizes
Can you imagine lifting a sumo wrestler? Their average weight is around 330 pounds. So, compared to an average American who weighs 197 pounds, sumo wrestlers are on the heavy side. And if your database is like that, your server will have a hard time running them.
So, what is a sumo-wrestler-type Oracle database?
It’s the one that has tables with hundreds of columns. Even more, the columns are overweight too, like using CHAR(2000). And when you check it, you’ll be surprised that the actual data is not even half of it. And the overall database design? It’s only partially normalized.
The effect?
Fat columns consume more storage and RAM. In the end, queries are slower.
So, what’s a lean Oracle database?
It’s the one that uses the smallest possible data type for a column. Check out the Oracle data types and their storage requirements here. Make sure your design also follows normalization rules for a good relational database.
Avoid chained rows
If you’ve never heard of chained rows in Oracle, read this carefully. Chained rows can impact performance by increasing disk input/output.
For starters, Oracle stores table rows in data blocks. An ideal scenario is fitting one row in a single data block. The default data block size is 8,192 bytes. But if your table design does not consider this, then a row might not fit in a single data block. When that happens, Oracle needs to put the other part of a row in another data block. And then, Oracle will “chain” them to connect one or more data blocks to store a single row.
Chained rows happen in the following circumstances:
- Your table has more than 255 columns.
- When one of the table columns has a data type of LONG or LONG RAW.
- During the initial INSERT, the row fits a data block. But when an UPDATE occurs, the row length increases so that it won’t fit a data block. This happens when one or more of the columns is VARCHAR. The bigger value during the UPDATE of the VARCHAR column(s) exceeds the size of the data block.
When Oracle decides to move the updated row to a new data block, a row migration happens.
Migrated or chained rows forces Oracle to access several blocks for a row. So, the need for more I/O increases. And when there are many of these chained or migrated rows in a table or tables, it can put your database to a crawl.
One possible fix is to break the table into 2 or more tables with a one-to-one relationship. But you have to test the queries involved to get an acceptable query speed.
Tip #2: Pinpoint slow queries
If you already know which query is slow, you can jump to Tip #3 below.
But if your entire website or system is slow and you don’t know which of the queries are slow, you have to hunt for it. Given the appropriate licenses, you have access to Oracle’s automatic tuning tools. These tools can help you spot slow queries and even give you recommendations.
But if manual tuning is your only choice, you can use the V$SQL and related views. Then, spot the slow ones that are still in the shared pool. Here’s one sample code to do that:
SELECT * FROM V$SQL
WHERE EXECUTIONS > 0
ORDER BY ELAPSED_TIME DESC;
The output of the above query will have the slowest query on top. The list will include other queries that ran in the background. So, the trick is to inspect the value of the SQL_TEXT column and look for a familiar query that you made.
Once you find a suspected query, proceed to the next tip.
Tip #3: Use EXPLAIN PLAN to know why a query is slow
When you tell Oracle to run a SQL statement, you don’t tell Oracle how to do it. You only provide what you need, and Oracle does the “how” for you. In other words, when you run a SELECT statement, you want columns and rows given to you. How it will be given to you is Oracle’s job.
And that’s why you need to see how Oracle does it for you. That’s where the execution plan comes into the picture. It contains a series of steps on how Oracle will process your query.
It happens when Oracle receives your command for the first time. Oracle parses your query and checks for syntax and semantics. Then, it will generate a hash value for your SQL statement and store the plan in the shared pool. So, the next time you run the exact query, it won’t formulate a plan anymore.
Generating the best plan is done by the query optimizer. The optimizer uses statistics to calculate costs. It gives a cost to every plan and chooses the one with the lowest cost. Since Oracle has the internal statistics and tools at its disposal, the optimizer is usually in a better position to decide how to run our query.
To see the execution plan for a SQL statements, you can use the EXPLAIN PLAN. Here’s the syntax:
EXPLAIN PLAN FOR <sql_query>;The <sql_query> is the query you want to check. Let’s have an example.
Oracle EXPLAIN PLAN example
The sample query we want to be explained is to get some sales information about OR number 63091. It includes the name of the customer, the products bought, quantity, and price.
EXPLAIN PLAN FOR
SELECT
 sh.OR_NUMBER
,sh.SALES_DATE
,c.CUSTOMER_NAME
,p.PRODUCT_NAME
,sd.QUANTITY
,sd.TOTAL_PRICE
FROM SALES_HEADER sh
INNER JOIN CUSTOMER c ON SH.CUSTOMER_ID = c.CUSTOMER_ID
INNER JOIN SALES_DETAIL sd ON SH.SALES_HEADER_ID = sd.SALES_HEADER_ID
INNER JOIN PRODUCT p ON sd.PRODUCT_ID = p.PRODUCT_ID
WHERE OR_NUMBER='63091';

SELECT * FROM TABLE(dbms_xplan.display());
Running EXPLAIN PLAN will let Oracle store the steps in PLAN_TABLE. One way to view it is to SELECT the PLAN_TABLE. But to have a better view, you need to query the DBMS_XPLAN.DISPLAY().
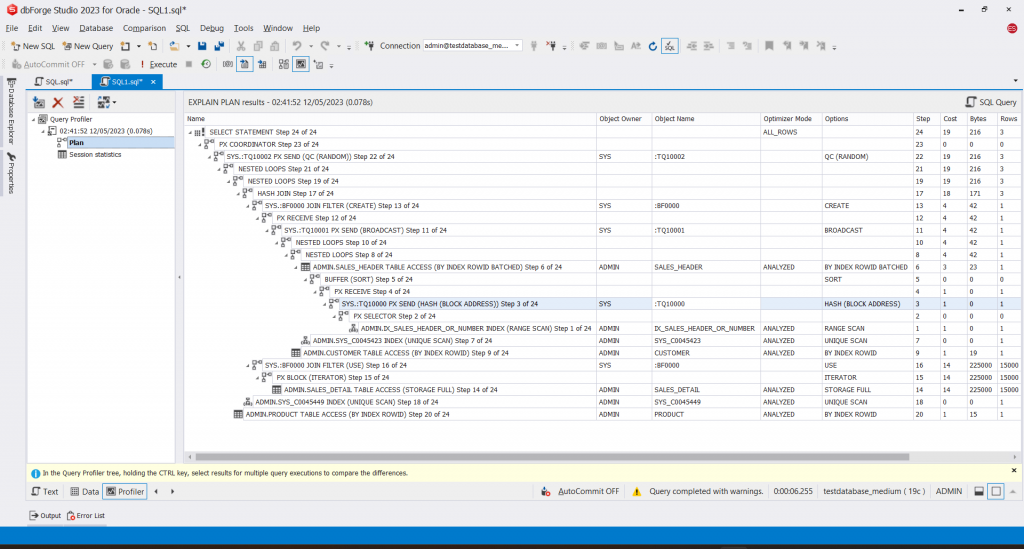
The output is the same for any tool. Here’s the output in dbForge Studio for Oracle.

The optimizer chose several steps for our query. Note that the SALES_HEADER has 5,000 rows and SALES_DETAIL has 15,000 rows. While the PRODUCT table has 20 rows. The result of the query is 4 rows.
A plan will show the join order, access path, and join method used. The tree format implies that an indented step is part of a higher step. Notice that the optimizer used nested loops, hash join, buffer sort, and more. Each has a corresponding cost and time. The TQ and IN-OUT columns with values show Oracle used parallel execution to improve query speed further.
If this makes you scratch your head and you don’t spot any problems, please read the next subsection.
Interpreting EXPLAIN PLAN
The plan needs interpretation to spot problems in it. So, for starters, what are some of the problem areas you need to watch out for?
- Full table scans – This means that Oracle needs to scan each row of the whole table sequentially. This is not always bad. But when your table is large to get a few results, this is not good. It’s a sign that the query didn’t use an index. Yet the optimizer may still choose to scan the whole table if it sees it to be the faster option. But your users’ patience may not align with it. To spot a table scan in an execution plan, look for TABLE ACCESS FULL. The ideal is an INDEX UNIQUE SCAN or an INDEX RANGE SCAN of a few rows.
- Too many rows scanned – This is related to the table scan. If the number of rows scanned is too many and the result is few, then an index is missing. The Rows column in the execution plan will give you an idea.
- Sorting – arranging the rows frequently is an expensive process. If your queries are slow with ORDER BY but fast without it, consider an index on the ORDER BY columns.
- Cost – The optimizer assigns costs to each query and its parts. The higher the number the slower the query. Your goal is to lower it by simplifying your query and creating appropriate indexes.
So, how does the plan above fare with the above points?
Analyzing the EXPLAIN PLAN
Though the query we used ran at 00:00:01, it still has a problem. And the growing data will make it worse by the day. So, what happened in the query based on the EXPLAIN PLAN?
- Notice the TABLE ACCESS STORAGE FULL on the SALES_DETAIL table? It means Oracle made a sequential scan on the whole table.
- The rows accessed by the table scan are 15,000 rows. That’s the entire table. The join between it and SALES_HEADER used a table scan to return rows with sales date, product, quantity, and price. The result set is only 4 rows. Does Oracle need to scan 15,000 rows for a result set of 4?
- There’s no index used to join using the SALES_HEADER_ID column.
Let’s stop at this point for the next tip. But you will see the solution in one of the examples later.
Tip #4: Make Sure Optimizer Statistics Are Updated
The optimizer uses statistics on database objects involved in a query. This includes table, column, index, and system statistics. Without it, the optimizer may choose a less optimal plan.
Oracle performs automatic updates on optimizer statistics using the DBMS_STATS. The default interval is 15 minutes. But on high-demand scenarios where updates, inserts, and deletes happen so fast, it may not be able to keep up. You can reconfigure automatic statistics collection. Or you may choose to run DBMS_STATS yourself to update a specific database object.
Here’s the syntax to update table, column, and index statistics:
EXEC DBMS_STATS.GATHER_TABLE_STATS('your_schema', 'your_table_name', CASCADE => TRUE);Tip #5: Use a Good Performance Profiler
A good tool to analyze query performance is not just a pretty face. It should be simple and let you spot problems faster. So, you can fix query performance in a nick of time. Devart’s family of products includes dbForge Studio for Oracle. And you need to check out its Query Profiler.
The Query Profiler also has an EXPLAIN PLAN. In addition, it has Session Statistics that affect query performance. The productivity booster here is the side-by-side performance comparison. With it, you can compare 2 or more executions based on the changes you make to the query and other fixes you add, like indexes.
Let me show it to you using the query we had earlier. First, you need to turn the Query Profiling Mode ON from the toolbar. Then, run the query. After that, you will see a profiling summary with total execution time, connection info, and more. Check it out below:

Then, you can click the Plan for this query profile and see the EXPLAIN PLAN in tree format.
The difference between the default EXPLAIN PLAN with this is the step# so you will see which of the steps ran first and what’s next. Finally, clicking Session statistics will show the following:
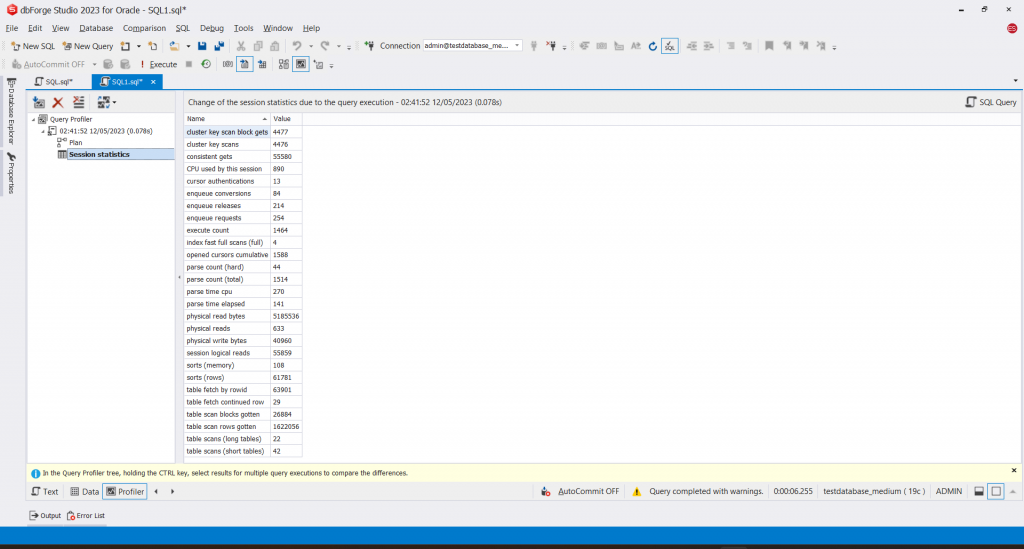
In Session Statistics, you will see more information about table scans, sorts, physical and logical reads, and more. Later, all of these will make sense when we compare 2 query profiles. So, please continue reading. For now, let’s proceed with some real-world examples.
Oracle Performance Tuning Examples
It’s time to go back to the example earlier. The obvious problem that caused a table scan is a missing index. So, let’s add an index on SALES_HEADER_ID in the SALES_DETAIL table.
Fix a Table Scan with an Index
Let’s also cover the columns QUANTITY and TOTAL_PRICE because the query includes these. Here’s the DDL command:
CREATE INDEX IX_SALES_DETAIL_SALES_HEADER_ID ON SALES_DETAIL (SALES_HEADER_ID, QUANTITY, TOTAL_PRICE);Now, using dbForge Studio for Oracle, let’s turn on the Query Profiling Mode and re-run the query. After getting a second query profile, I renamed the 2 query profiles with “Before Adding Index” and “After Adding Index” respectively. So, we can identify which profile has the fix or not. Then, I press CTRL and click the 2 profiles.
Check out the results below:

The index did a good job of reducing execution time. Let’s check the Plan next. We can’t have a side-by-side comparison of the EXPLAIN PLAN. But as you can see below, the 24 steps earlier are now reduced to 19 steps after adding the index. Check out the Before Adding Index Plan first.

Then, check out the total steps and the use of the new index below. The table scan of 15,000 rows is now gone.

Finally, let’s check the side-by-side comparison of Session Statistics.

SELECT * vs. SELECT <column list>
You’ve heard that SELECT * is slow. Today, you will prove it. Let’s compare the query profiles of the two queries below:
-- Using SELECT *
SELECT * FROM SALES_HEADER sh
INNER JOIN SALES_DETAIL sd ON SH.SALES_HEADER_ID = SD.SALES_HEADER_ID
WHERE sh.SALES_HEADER_ID = 100;

-- Choosing only the needed columns
SELECT
 sh.OR_NUMBER
,sh.SALES_DATE
,sh.CUSTOMER_ID
,sd.PRODUCT_ID
,sd.QUANTITY
,sd.TOTAL_PRICE
FROM SALES_HEADER sh
INNER JOIN SALES_DETAIL sd ON SH.SALES_HEADER_ID = SD.SALES_HEADER_ID
WHERE sh.SALES_HEADER_ID = 100;
The difference between the 2 queries is the columns to include. Nothing more.
Here’s the comparison of their execution time:
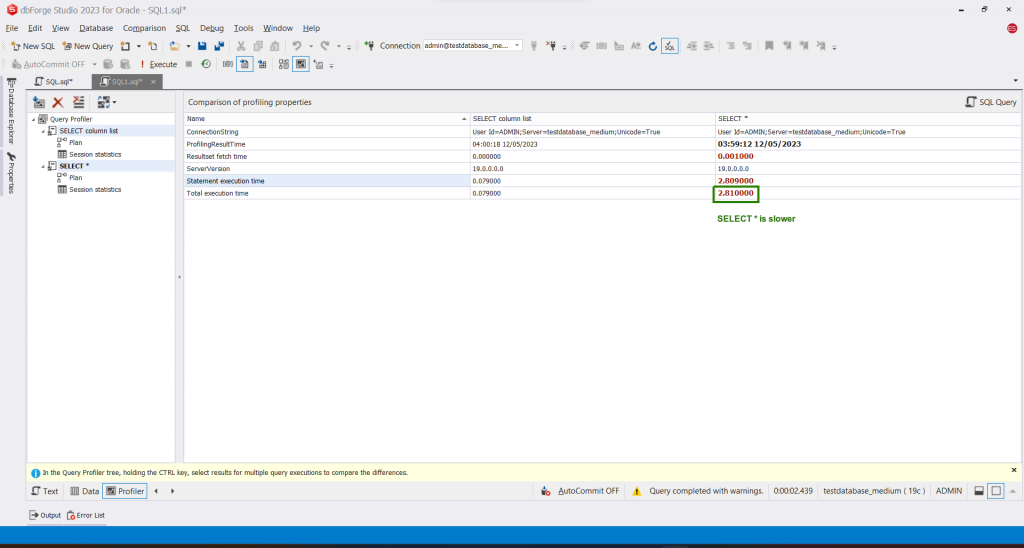
See? SELECT * is slower. It ran more than 2 seconds while the other ran only a fraction of a second.
The EXPLAIN PLAN reveals why. First, let’s have the plan for SELECT *:
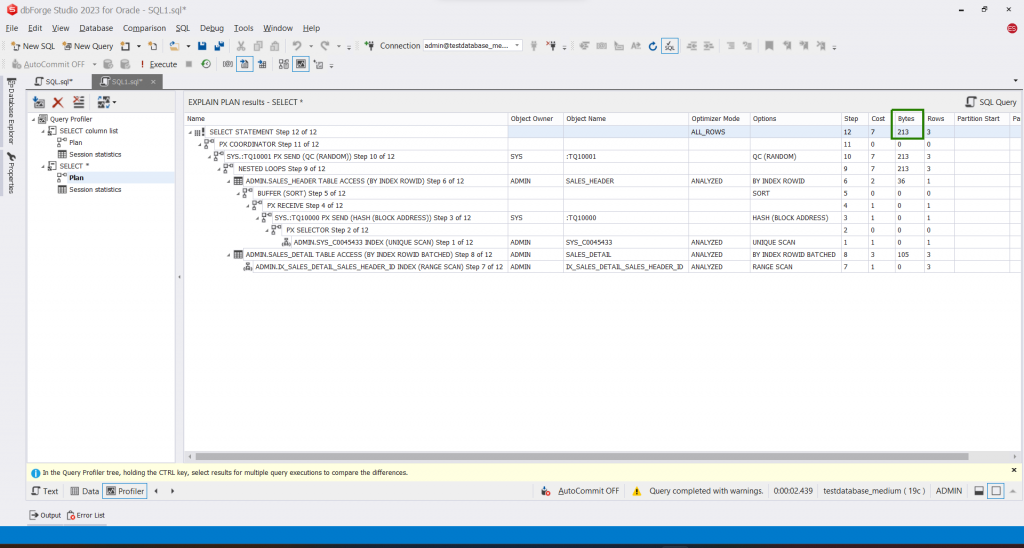
The above is the EXPLAIN PLAN of our second query. For now, take note of the final bytes in step #12.
Here’s the EXPLAIN PLAN of using a select list of columns.

Compare the above image from the previous plan. The bytes consumed are higher with SELECT *. Using a list of columns in SELECT is worth it. So, avoid SELECT * if you don’t need all the columns.
Avoiding Implicit Conversion
Let’s examine 2 almost identical SELECT statements. The only difference is in the WHERE clause. The OR_NUMBER column of the SALES_HEADER table is a VARCHAR column. So, you need to enclose a literal value with quotes. But if you don’t use quotes, Oracle will do an implicit conversion without you knowing it. The effect is a table scan instead of using an index.
Here are the 2 queries:
SELECT
  sh.OR_NUMBER
,sh.SALES_DATE
,c.CUSTOMER_NAME
,p.PRODUCT_NAME
,sd.QUANTITY
,sd.TOTAL_PRICE
FROM SALES_HEADER sh
INNER JOIN CUSTOMER c ON SH.CUSTOMER_ID = c.CUSTOMER_ID
INNER JOIN SALES_DETAIL sd ON SH.SALES_HEADER_ID = sd.SALES_HEADER_ID
INNER JOIN PRODUCT p ON sd.PRODUCT_ID = p.PRODUCT_ID
WHERE OR_NUMBER='63091';  -- With quotes

SELECT
  sh.OR_NUMBER
,sh.SALES_DATE
,c.CUSTOMER_NAME
,p.PRODUCT_NAME
,sd.QUANTITY
,sd.TOTAL_PRICE
FROM SALES_HEADER sh
INNER JOIN CUSTOMER c ON SH.CUSTOMER_ID = c.CUSTOMER_ID
INNER JOIN SALES_DETAIL sd ON SH.SALES_HEADER_ID = sd.SALES_HEADER_ID
INNER JOIN PRODUCT p ON sd.PRODUCT_ID = p.PRODUCT_ID
WHERE OR_NUMBER=63091;    -- NO QUOTES for a VARCHAR column. Treated as a number.
The EXPLAIN PLAN is enough to see that when Oracle does implicit conversion, a table scan results and it’s bad.
Here’s the execution plan for a quoted OR_NUMBER. It used the index, and the query cost is 1.
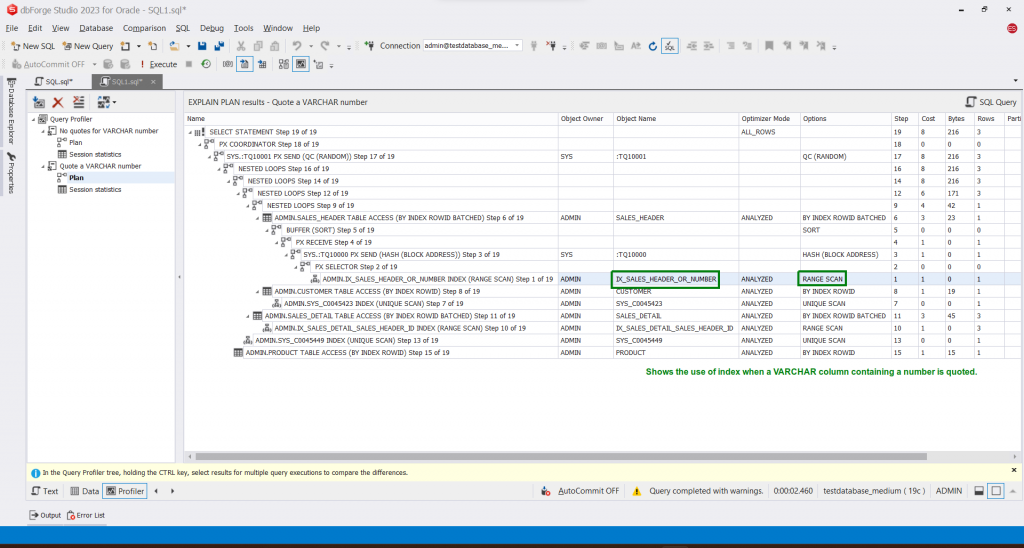
Now, check the EXPLAIN PLAN of the VARCHAR column with no quotes on the literal value.

A table scan results when Oracle converts a number to VARCHAR. The query cost is also higher (The cost is 14 compared to 1 earlier). This happens in the background, and you won’t know until you do some performance tuning. The trick is to evaluate values and columns with the same data type. You may need to cast it to the same data type in certain cases.
Hidden Secrets in Oracle Performance
Well, the following are not so secret if you practice them already. But they are not the usual cup of tea. If you are already a seasoned Oracle developer or app developer, you can skip this part.
Secret 1: Invisible indexes
A database maintains an invisible index, but the optimizer will ignore it unless explicitly specified with a hint. You can make an existing index invisible and see if there’s a negative impact on performance before dropping it. Or you can create a new invisible index and with a query hint, you can test if performance will improve.
Just add the INVISIBLE keyword to ALTER INDEX.
ALTER INDEX index_name INVISIBLE;Or add the INVISIBLE keyword to CREATE INDEX.
CREATE INDEX index_name ON TABLE(COLUMN[S]) INVISIBLE;Example of using a hint to use an invisible index:
ALTER INDEX IX_SALES_DETAIL_SALES_HEADER_ID INVISIBLE;

SELECT  /*+ use_invisible_indexes INDEX (SALES_DETAIL IX_SALES_DETAIL_SALES_HEADER_ID) */
* FROM SALES_DETAIL sd
WHERE SD.SALES_HEADER_ID = 100;
Check the EXPLAIN PLAN to see if there’s an improvement.
Secret 2: Results cache
The Results Cache stores the results of a query. It reduces redundant computations for identical queries and enhances overall performance.
Example:
SELECT /*+ RESULT_CACHE */ * FROM PRODUCT p;If your app uses data that updates less frequently, you can cache them for faster response.
Secret 3: Design your app for performance
Outside factors like your application design influence your Oracle database performance. Here are some useful tips:
- Use connection pooling. Connecting to a database is an expensive operation that is not scalable. It’s not good if your app frequently connects and disconnects from the database. Or allows many concurrent connections. Pool connections to minimize connections.
- Parse SQL statements once and execute them many times. Parsing SQL statements and creating execution plans is also an expensive operation. Design your app so that execution plans are reused many times from the shared pool.
- Effective use of bind variables. To ensure the reuse of SQL statements and their plans, use bind variables and not literal values. For example, instead of using WHERE LASTNAME=’Smith’ (use of literal value), use WHERE LASTNAME = :1 (bind variable).
Takeaways in Oracle performance tuning
Let’s recap.
To get started with performance tuning, you need to know the basics of Oracle database architecture and know SQL well. Then, we learned about a lean Oracle database and avoiding chained and migrated rows. We also learned the basics of interpreting the EXPLAIN PLAN results. And you saw some examples of slow queries and their fix.
Oracle performance tuning involves other aspects. The official documentation has a lot to mention about it. But we covered the basics here. You can master this in time with practice and a dash of determination. Reading the official documentation can become a lifesaver one day. So, put that in your list of To-dos.
Execution plans may change too as data grows. So, monitor if the previous plan still performs well. Then, adjust accordingly. We also presented a brilliant Oracle GUI tool called dbForge Studio for Oracle. Why not give dbForge Studio for Oracle a try to boost your productivity in crushing Oracle performance bottlenecks today?