I continue a series of articles on the basics of EXPLAIN in PostgreSQL, which is a short review of Understanding EXPLAIN by Guillaume Lelarge.
To better understand the issue, I highly recommend reviewing the original “Understanding EXPLAIN” by Guillaume Lelarge and read my first and second articles.
ORDER BY
DROP INDEX foo_c1_idx;
EXPLAIN (ANALYZE) SELECT * FROM foo ORDER BY c1;

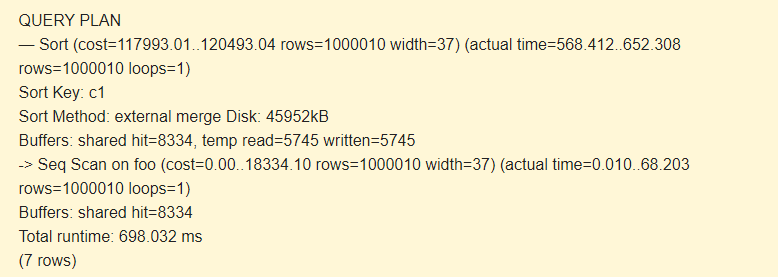
At first, you execute a sequential scan (Seq Scan) of the foo table and then, do the sorting (Sort). The -> sign of the EXPLAIN command indicates the hierarchy of steps (node). The earlier the step is executed, the greater indent it has.
Sort Key is a condition of sorting.
Sort Method: external merge Disk a temporary file on the disk with a capacity of 4592 kB is used when sorting.
Check with the BUFFERS option:
DROP INDEX foo_c1_idx;
EXPLAIN (ANALYZE) SELECT * FROM foo ORDER BY c1;

Indeed, the temp read=5745 written=5745 line means that 45960Kb (5745 blocks of 8 Kb each) were stored and read in the temporary file. The operations with 8334 blocks were executed in the cache.
The operations with the file system are slower than operations in RAM.
Let’s try to increase the memory capacity of work_mem:
SET work_mem TO '200MB';
EXPLAIN (ANALYZE) SELECT * FROM foo ORDER BY c1;

Sort Method: quicksort Memory: 102702kB – the entire sorting was executed in RAM.
The index is as follows:
CREATE INDEX ON foo(c1);
EXPLAIN (ANALYZE) SELECT * FROM foo ORDER BY c1;

We have only Index Scan remained, which significantly affected the speed of the query.
LIMIT
Delete the previously created index:
DROP INDEX foo_c2_idx1;
EXPLAIN (ANALYZE,BUFFERS)
  SELECT * FROM foo WHERE c2 LIKE 'ab%';

As expected, Seq Scan and Filter are used.
EXPLAIN (ANALYZE,BUFFERS)
SELECT * FROM foo WHERE c2 LIKE 'ab%' LIMIT 10;

Seq Scan reads rows of the table and compares them (Filter) with the condition. As soon as there are 10 records that meet the condition, the scan will end. In our case, in order to get 10 result rows, we had to read only 3063 records rather than the whole table. 3053 rows of this number were rejected (Rows Removed by Filter).
The same happens with Index Scan.
JOIN
Create a new table and generate statistics for it:
CREATE TABLE bar (c1 integer, c2 boolean);
INSERT INTO bar
  SELECT i, i%2=1
  FROM generate_series(1, 500000) AS i;
ANALYZE bar;
The query for two tables is as follows:
EXPLAIN (ANALYZE)
SELECT * FROM foo JOIN bar ON foo.c1=bar.c1;

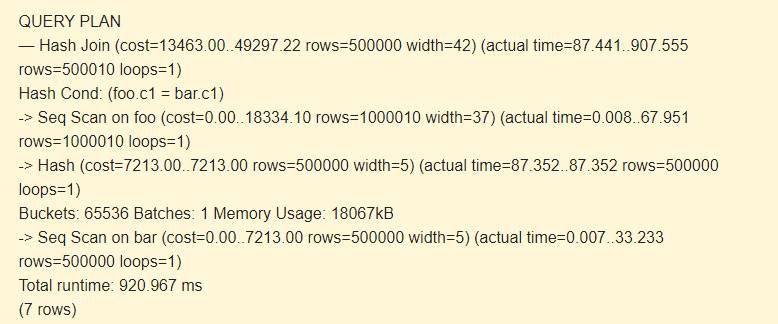
First, sequential scan (Seq Scan) reads the bar table. A hash (Hash) is calculated for each row.
Then, it scans the foo table, and for each row, a hash is calculated that is compared (Hash Join) with the hash of the bar table by the Hash Cond condition. If they match, a resulting string is outputted.
18067kB of memory is used to store hashes for the bar.
Add the index:
CREATE INDEX ON bar(c1);
EXPLAIN (ANALYZE)
SELECT * FROM foo JOIN bar ON foo.c1=bar.c1;

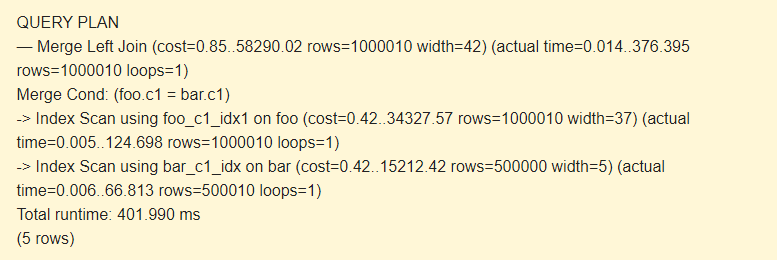
Hash is no longer used. Merge Join and Index Scan on the indices of both tables improve performance greatly.
LEFT JOIN:
EXPLAIN (ANALYZE)
SELECT * FROM foo LEFT JOIN bar ON foo.c1=bar.c1;

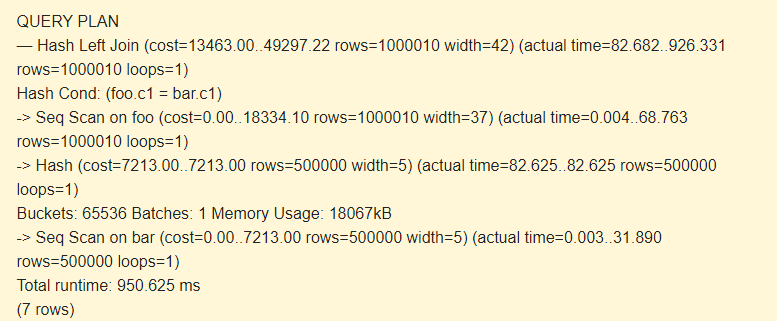
Seq Scan?
Let’s see what result we will have if we disable Seq Scan.
SET enable_seqscan TO off;
EXPLAIN (ANALYZE)
SELECT * FROM foo LEFT JOIN bar ON foo.c1=bar.c1;

According to the scheduler, using indexes is more costly than using hashes. This is possible with a sufficiently large amount of allocated memory. Do you remember us increasing work_mem?
However, if you do not have enough memory, the scheduler will behave differently:
SET work_mem TO '15MB';
SET enable_seqscan TO ON;
EXPLAIN (ANALYZE)
SELECT * FROM foo LEFT JOIN bar ON foo.c1=bar.c1;

If we disable Index Scan, what result will EXPLAIN display?
SET work_mem TO '15MB';
SET enable_indexscan TO off;
EXPLAIN (ANALYZE)
SELECT * FROM foo LEFT JOIN bar ON foo.c1=bar.c1;

Batches: 2 has increased cost. The entire hash did not fit in memory; we had to split it into two packages of 9045kB.
Thank you for reading my articles! I hope they were useful. Should you have any comments or feedback, feel free to let me know.


