Autumn of 2016 was full of events from Microsoft dedicated to analytics. In practice, the company began aggressive promotion of its predictive analytics and BI platform in the cloud. Finally, it has happened – Microsoft has released the preview of Azure SSAS Tabular. In fact, the company has transferred SSAS Tabular to the cloud. Therefore, SQL Server Analysis Enterprise Edition in cloud supports DirectQuery, partitions, row-level security, bi-directional relationships, and has compatibility level 1200.
Since it is a preview, let’s consider the supported data sources and benefits of this solution.
Data sources
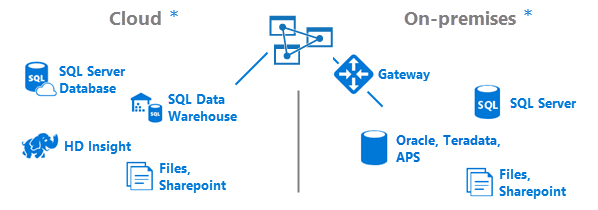
The following data sources are set to be supported:
- Cloud – Azure-based services:
- SQL Server Database
- SQL Data Warehouse
- HD Insight (not supported in preview)
- Files, Sharepoint (not supported in preview)
- On-premises – your data located on your physical servers (loosely speaking, on the ground). Access from cloud to data is carried out with help of On-premises data gateway. The utility allows getting access to your data from the cloud (note, that if you have an installed gateway, you need to delete it and install a new one by the link specified).
- SQL Server
- APS
- Oracle (not supported in preview)
- Teradata (not supported in preview)
- Files, Sharepoint (not supported in preview)
Tools for work
Here everything is as standard as for SQL Server Analysis Enterprise Edition 2016. Models can be created and deployed with SQL Server Data Tools for Visual Studio. Also, you can work with help of Microsoft SQL Server Management Studio.
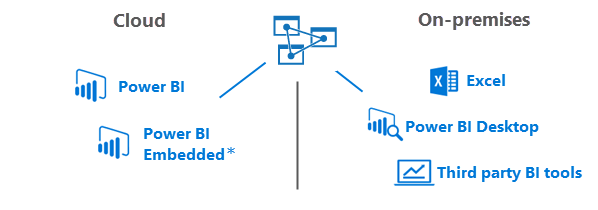
Data visualization
You can get your data with Excel, Power BI cloud, Power BI Embedded, Power BI Desktop.
Prices and regions
Regions supported:
- West Europe, West Central US, South Central US.
Azure SSAS preview is not supported in other regions, or to be more accurate, you won’t be able to create a service elsewhere. - Prices are specified in the following table:
You can select the Developer tier for testing purposes
What is QPU?
As Microsoft states, the Query Processing Unit (QPU) is the unit of measure in Azure Analysis Services that represents the relative computational power based on query and processing performance. A QPU is based on a set of typical analytical queries and processing commands run on Azure and then measured to determine how many transactions are completed per second under fully loaded conditions.
In fact, 20 QPU equal 1 core. Therefore, S1 equals 5 cores, S2 equals approximately 10 cores, S4 – 20 cores.
What is the Benefit of This Service?
At first sight, prices seem quite high. Here are monthly rates:
- S1 -755.16$
- S2 -1510.36$
- S3 — 3016,92$
- D — 49,10$
But let’s take a look at the pricing from another perspective. Microsft recommends having a separate SSAS server for convenient work. This means that you must buy a physical server, connect it to infrastructure, buy a separate MSSQL Enterprise for the tabular model, and then with the expansion of the tabular model volume, you will need to update the server. In addition, you need to track releases of service packs, various security updates. With PaaS (Platform as a Service), all you have to do is to deploy the service, deploy the model to it and setup security. Besides, you can minimize your costs: the price is specified under the condition that the service is used 24 hours a day within a month, but you don’t use it that long, do you? So, you can disable the service for the nonworking time. If you fork for 40 hours a week, 4 weeks a month, you will pay approximately 162 USD a month, according to the S1 price. Admit, the amount is not that huge.
Useful links:
Documentation – ttps://docs.microsoft.com/en-us/azure/analysis-services/
Chris Webb about Azure SSAS — https://blog.crossjoin.co.uk/2016/10/25/first-thoughts-on-azure-analysis-services/
TechNet forums —https://social.technet.microsoft.com/forums/en-us/home
And feedback, of course – https://feedback.azure.com/forums/556165
Tags: azure Last modified: September 23, 2021


