
SQL Server database diagram is a graphical representation of database tables. It visualizes the database structure and allows you to understand the overall database schema and relations. It lets you also manage the database schema from the diagram page by creating and modifying database tables, columns, dependencies, indexes, constraints, and keys.
Using SQL Server Management Studio for Database Diagram creation
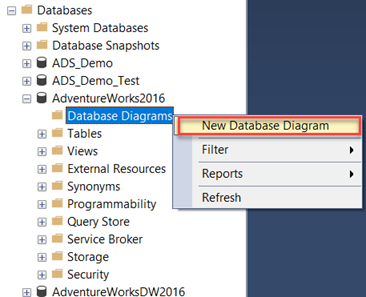
SQL Server Management Studio serves excellently to create the Database Diagram. At the start, we expand the database and right-click on Database Diagram. Choose “New Database Diagram” from the menu:
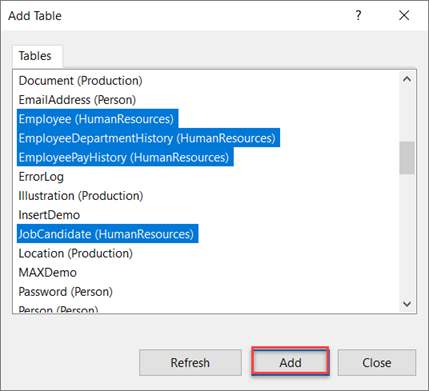
The Database Diagram window will appear. Choose the tables to include in the database diagram, and click “Add” to proceed:
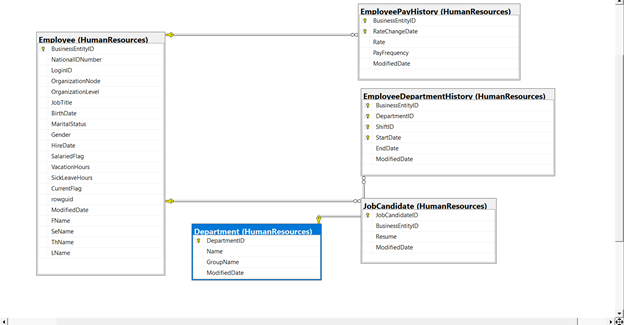
Arrange these tables in the generated database diagram for a friendlier look.
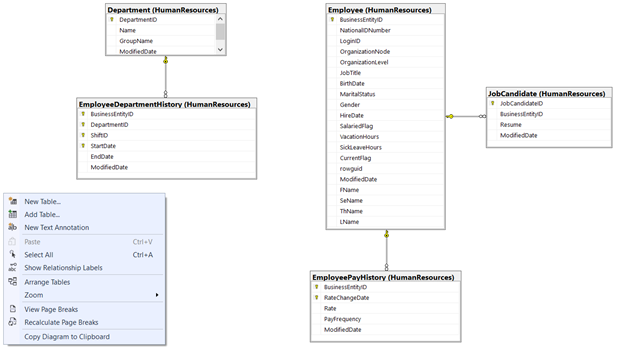
The database diagram for the selected tables will show the list of columns available in each table and relations between these tables:
In that window, right-click on any table to change the table view and the content displayed for that table. In the same way, we remove a table from the diagram. Also, we add or remove columns, indexes, and keys, and edit the relations between the tables in that diagram:
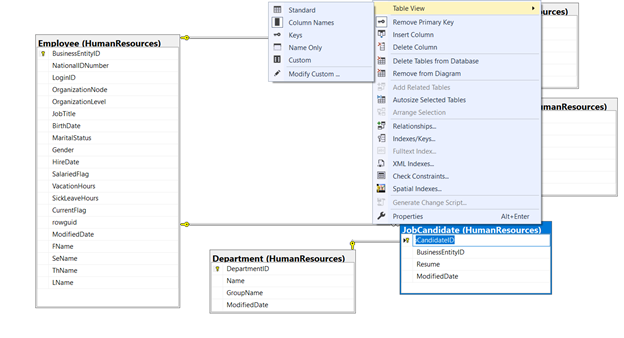
Also, by right-clicking in the white area, we can create a new table in that database or add an existing table to the diagram. It is possible to arrange the tables automatically according to the dependencies between the tables, zoom the database diagram view in and out, and copy the diagram to the clipboard:
You can see how easy we can create and control the database diagram with the SQL Server Management Studio tool.
But it is different when the diagram contains more tables and relations between the tables. Then, drawing a diagram and organizing tables from it will be complicated. You may also face crash issues with different SSMS versions, other than SSMS 18.6 version with Microsoft bugfixes.
There is a need for another tool, making it easier to create a database diagram and perform other tasks from the diagram window.
Creating Database Diagrams with an alternative solution: the dbForge Database Diagram Tool
Database ER Diagram Tool for SQL Server is such a tool. It is an advanced ER diagram tool, allowing you to create Entity Relationship Diagrams and Relational Schemas easily. It combines the Database Diagram, the Database Modeling, and the Table Designer utilities to efficiently perform different database tasks.
This Diagram Tool visualizes the database structure for analysis and allows the user to cluster the related database objects logically, using containers. It also reviews the database tables’ relations, creates and edits the database objects from the diagram, prints out large SQL database diagrams, and performs reverse engineering.
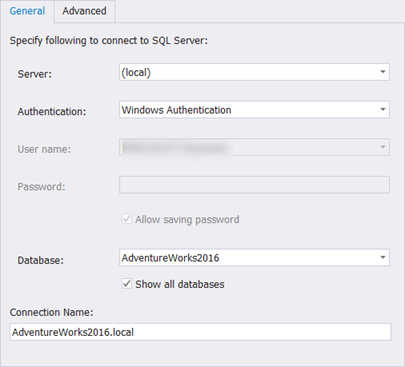
You can download Database ER Diagram Tool from the Devart Download page and install it on your machine. Once installed, it launches the Database Connection Properties window. There, you should enter the name of the server where the SQL Server instance is hosted, the authentication method, the connection credentials for that instance, and the name of the database you plan to create a diagram for:
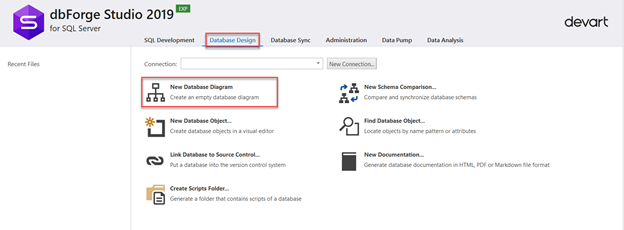
To create a new database diagram, click on the New Database Diagram option under the Database Design window:
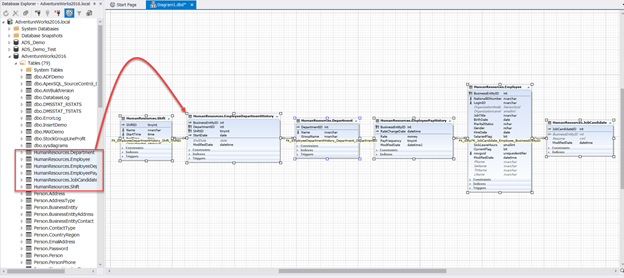
An empty database diagram will appear. You can select the list of tables to add them to the chart by the “drag and drop” method. You can see from the database diagram that the tables are arranged automatically in a friendly way. There is an expandable list of constraints, indexes, and triggers in each table. The overall view is clear and easy to manage.
Check also the label, showing the relationship between every two tables in the database diagram:
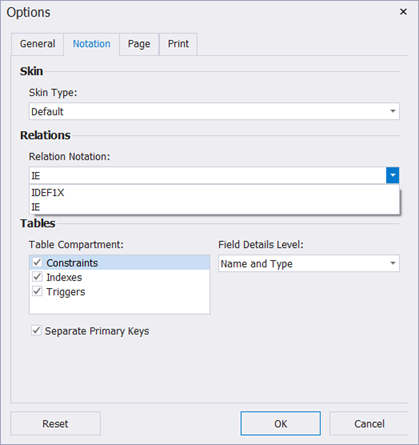
You can control the notation from the database diagram settings. Choose them from the Information Engineering (IE) and IDEF1 Extended (IDEF1X) common data modeling notations. You can define what to display in the tables’ nodes and change the field detail level. For instance, it can be showing column names only, names with types, or names with full types:
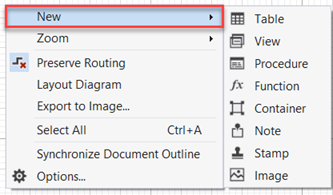
Right-click on the white area, and you will see the option to create different database and diagram objects in a more organized way. It also allows adding notes with comments to the diagram area while designing or analyzing the database structure. Hyperlinks are supported by the notes too.
Add a stamp to display the information about a database diagram, such as the diagram author, company, version, copyrights, project name, and date. It serves to identify the printed copy of the document. Adding an arbitrary image with different supported formats to the diagram provides additional visual information (a diagram sketch or draft):
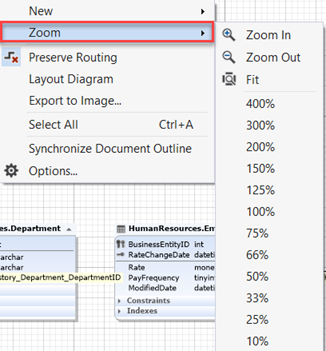
Note the zoom option. It is applicable for the database diagram layout, and it lets you read and manage that diagram easier:
When it comes to controlling the tables included in the database diagram, the dbForge Database Diagram Tool allows you to perform various operations, like adding new columns, indexes, and keys from the database diagram. It also provides the possibility to control the table’s data, such as importing data to the table, exporting data from the table, and truncating the table’s data:
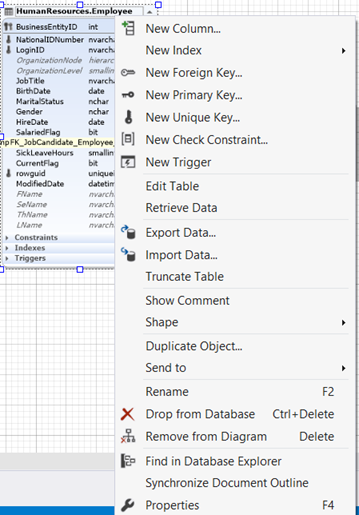
As you can see, you can remove the table from the diagram or eradicate it from the database.
Another notable feature of the dbForge Database Diagram Tool is the ability to logically store all the related database objects clustered under the same container. This way, it becomes easier to clarify the structure of large complex diagrams.
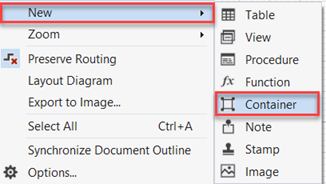
Right-click on the white area and choose “New > Container”:
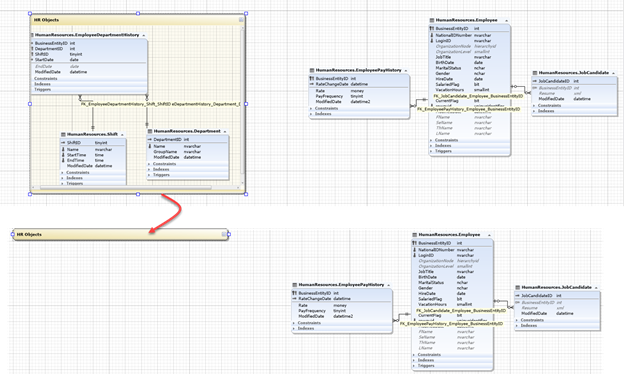
Drag the related objects to this container, and name that container to indicate the tables clustered inside. Then, collapse it to get rid of the database diagram complexity:
If the diagram becomes more extensive and complex, you can allocate any object in the dbForge Database Diagram Designer. For that, search for any text value, including tables objects, such as columns, and constraints/diagram objects, such as containers, stamps, and notes.
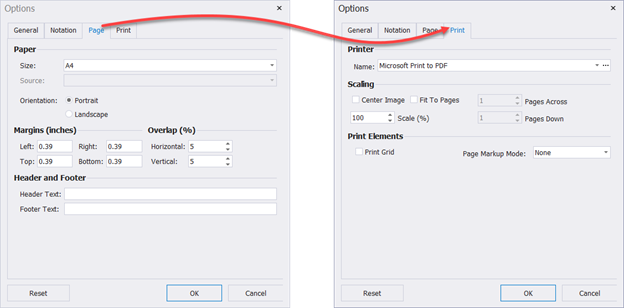
It is possible to print the database diagram or to export it as an image. The settings are flexible and let you adjust each case for your preferences. Configure the page orientation, paper size and source, printing margins and overlapping, header and footer text, etc.
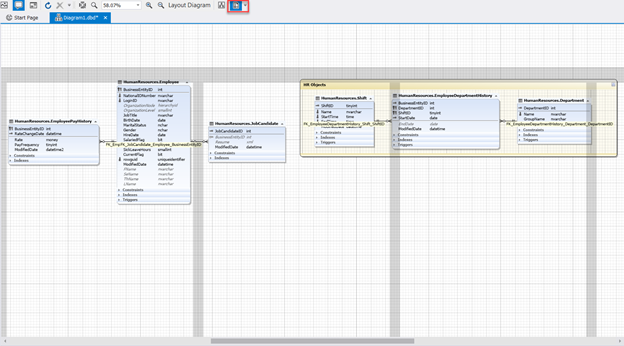
The Display print markup option allows you to display the print markup grid. There, the gray stripes show the adjustable page overlapping:
This way, the dbForge Database Diagram Tool simplifies visualizing, analyzing, and managing complex and large database diagrams. The export and print options help to save the diagrams for further references. In general, usage of this tool makes all the database tasks much more straightforward.
Tags: indexes, sql constraints, sql server, trigger Last modified: September 18, 2021