In my previous articles, I have explained the step-by-step process of deploying an AlwaysOn Availability group on SQL Server 2017. In this article, I am going to explain how to monitor AlwaysOn availability groups.
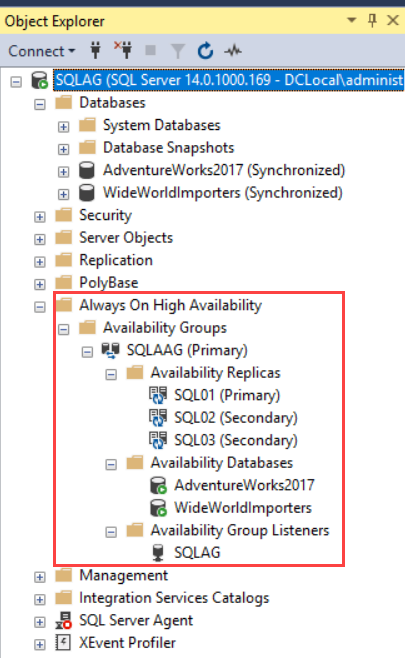
First, let’s review the configuration of the availability group we had deployed previously. To do that, open SQL Server Management Studio Expand database engine from the object explorer Expand “AlwaysOn High Availability” Expand “Availability Groups.” You can see the availability group named SQLAAG. Under this availability group (SQLAAG), you can see the list of availability replicas, availability databases, and availability group listeners.
See the following image:
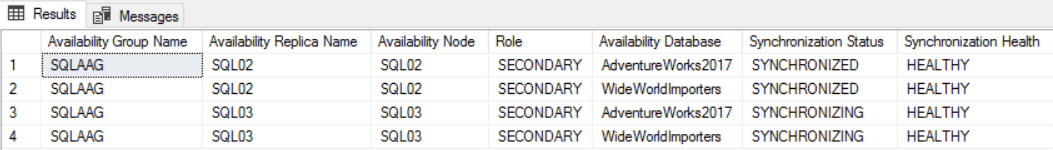
You can see the details by executing the following queries.
DECLARE @HADRSERVERNAME VARCHAR(25)
SET @HADRSERVERNAME = @@SERVERNAME
SELECT CLUSTERNODES.GROUP_NAME          AS [AVAILABILITY GROUP NAME],
       CLUSTERNODES.REPLICA_SERVER_NAME AS [AVAILABILITY REPLICA NAME],
       CLUSTERNODES.NODE_NAME           AS [AVAILABILITY NODE],
       RS.ROLE_DESC                     AS [ROLE],
       DB_NAME(DRS.DATABASE_ID)         AS [AVAILABILITY DATABASE],
       DRS.SYNCHRONIZATION_STATE_DESC   AS [SYNCHRONIZATION STATUS],
       DRS.SYNCHRONIZATION_HEALTH_DESC  AS [SYNCHRONIZATION HEALTH]
FROM   SYS.DM_HADR_AVAILABILITY_REPLICA_CLUSTER_NODES CLUSTERNODES
       JOIN SYS.DM_HADR_AVAILABILITY_REPLICA_CLUSTER_STATES CLUSTERSTATS
         ON CLUSTERNODES.REPLICA_SERVER_NAME = CLUSTERSTATS.REPLICA_SERVER_NAME
       JOIN SYS.DM_HADR_AVAILABILITY_REPLICA_STATES RS
         ON RS.REPLICA_ID = CLUSTERSTATS.REPLICA_ID
       JOIN SYS.DM_HADR_DATABASE_REPLICA_STATES DRS
         ON RS.REPLICA_ID = DRS.REPLICA_ID
WHERE  CLUSTERNODES.REPLICA_SERVER_NAME <> @HADRSERVERNAME
Following is the output:
Monitoring an AlwaysOn availability group
You can monitor the AlwaysOn availability group using:
- AlwaysOn Monitoring dashboard in SQL Server Management Studio.
- Performance Monitor counters.
Monitoring AlwaysOn Availability groups using the dashboard
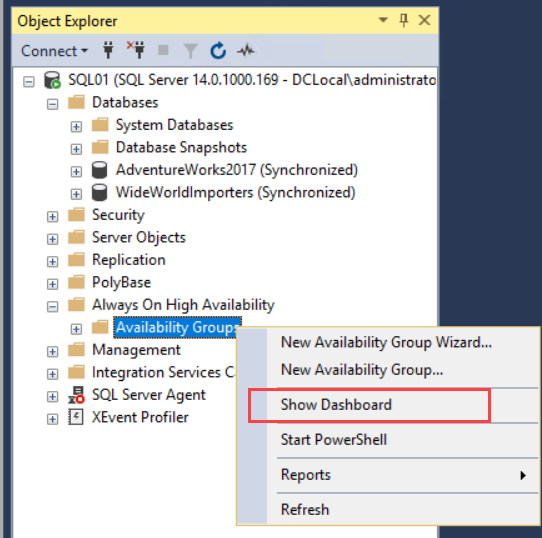
To monitor the health of an availability group, you can use the Monitoring Dashboard. To launch the dashboard, right-click the Availability Groups folder and select “Show Dashboard.” See the following image:
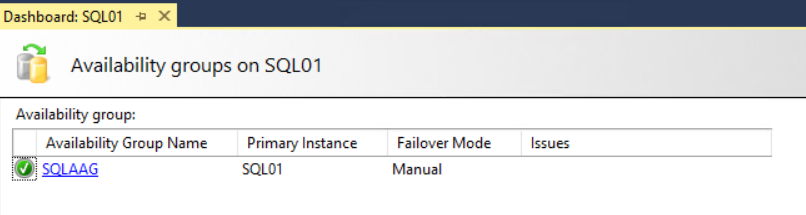
The AlwaysOn availability group monitoring dashboard will be opened in a new tab. It displays plenty of information about the configured availability group. The dashboard provides a high-level summary of the configuration. It includes the name of the availability group, primary instance, and failover mode. If a cluster has an issue, then it will be displayed in the “Issues” column. See the following image:
Now click the availability group’s name. A new tab will be opened, showing the details of the selected availability group. See the following image:
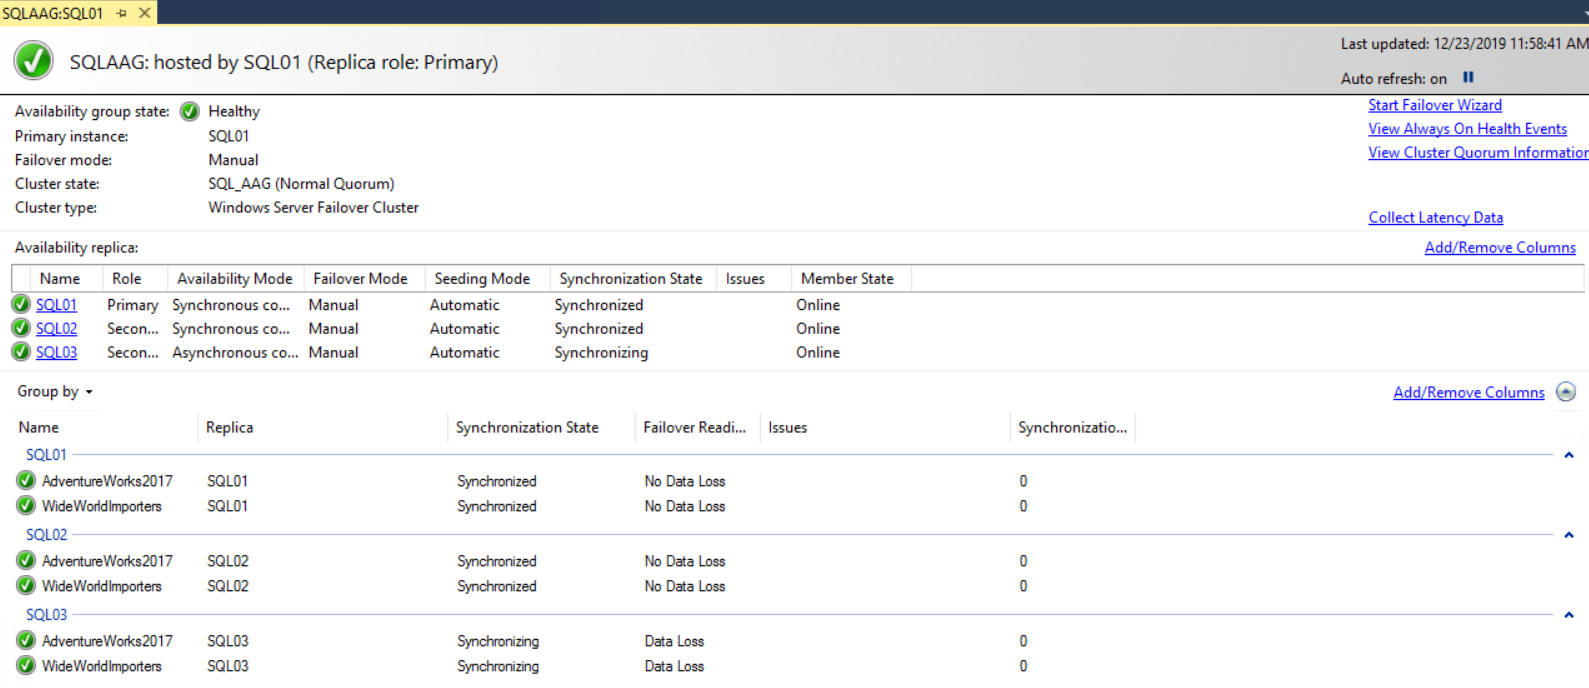
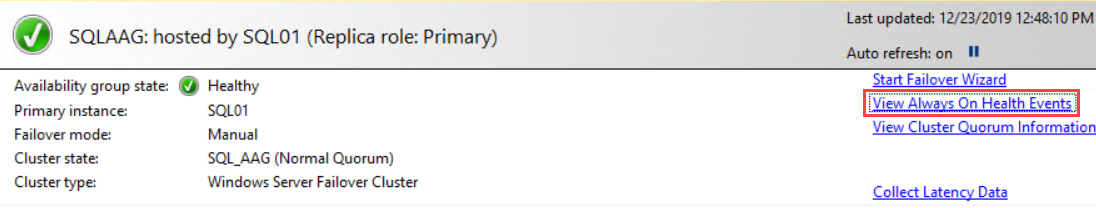
On top of the dashboard, you can see the availability group’s state, primary instance, its failover mode, cluster state, and its type.
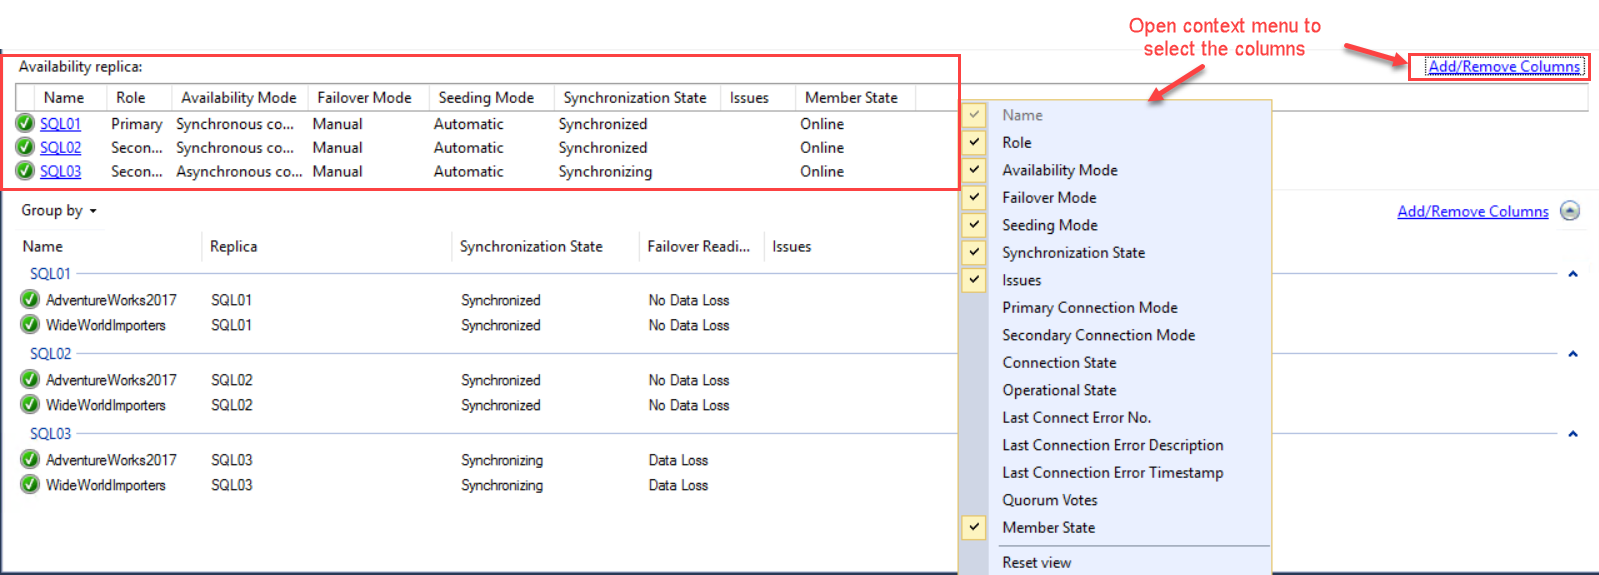
In the Availability replica section, you can see the instance names of the participating replicas, their roles, availability modes, failover modes, and synchronization states. You can also review more information by adding other columns. To do that, right-click anywhere on the grid and select the columns from the context menu. Alternatively, you can click “Add/Remove Columns” to get the full list of columns. See the following image:
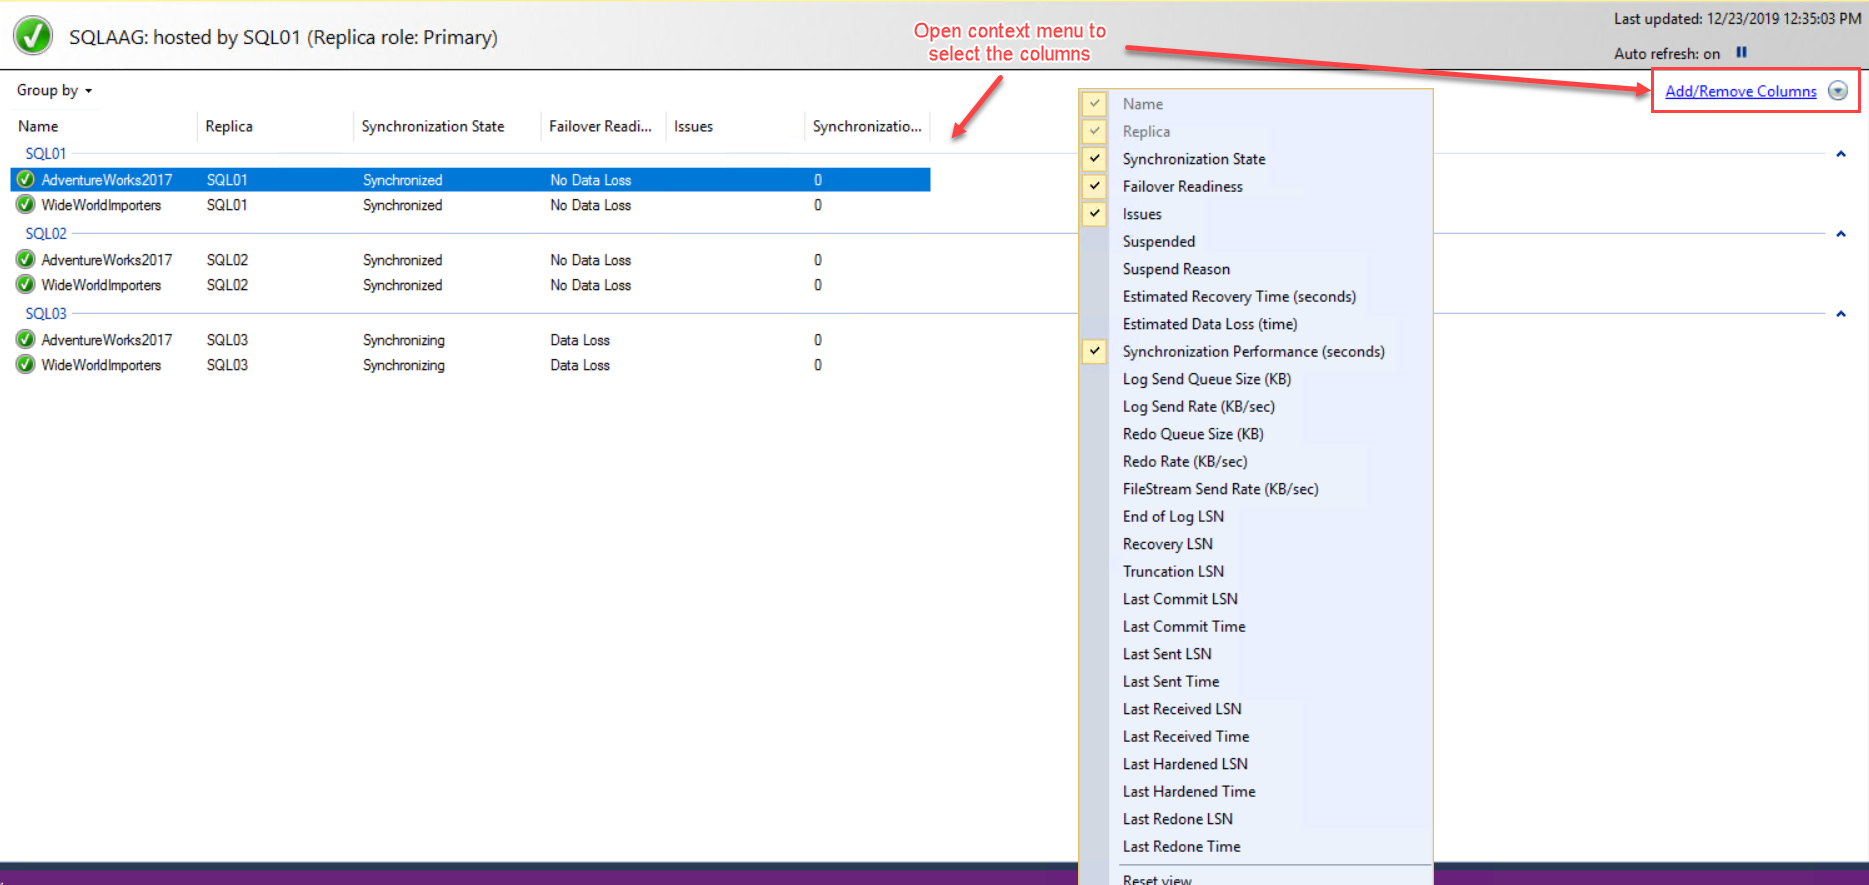
Similarly, you can review more information about the “availability databases” by adding other columns. To do that, right-click on the availability database section and select the columns from the context menu. You can also click “Add/Remove Columns” to get the full list of columns. See the following image:
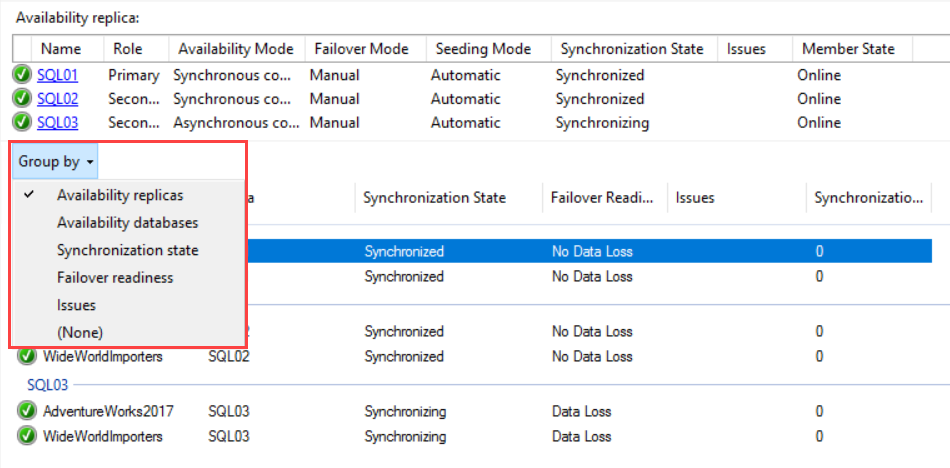
In the Group by section, you can see the list of “Availability Databases” within the availability replicas. You can customize the Group by section by choosing any of the grouping methods available in the “Group By” drop-down. See the following image:
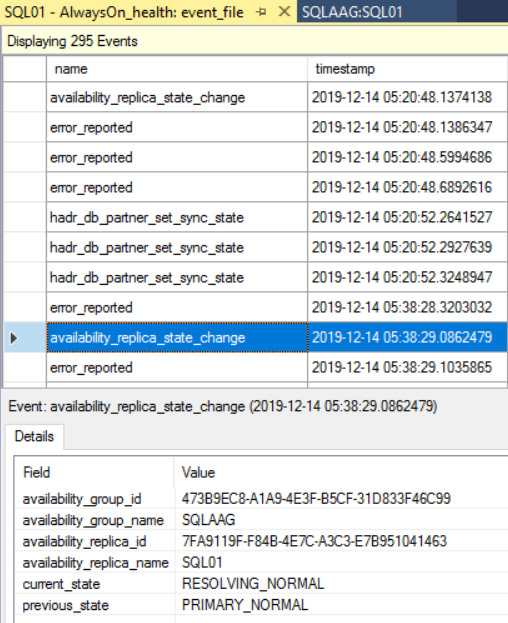
When we deploy the AlwaysOn availability groups, SQL Server creates an extended event session named “AlwaysOn_Health” on the SQL Server instance. This extended event can be used to monitor the events and performance of availability groups. You can open the extended events by clicking “View AlwaysOn Health Events.” See the following image:
It will display all the AlwaysOn health events sessions that can be used to monitor the health of the availability group.
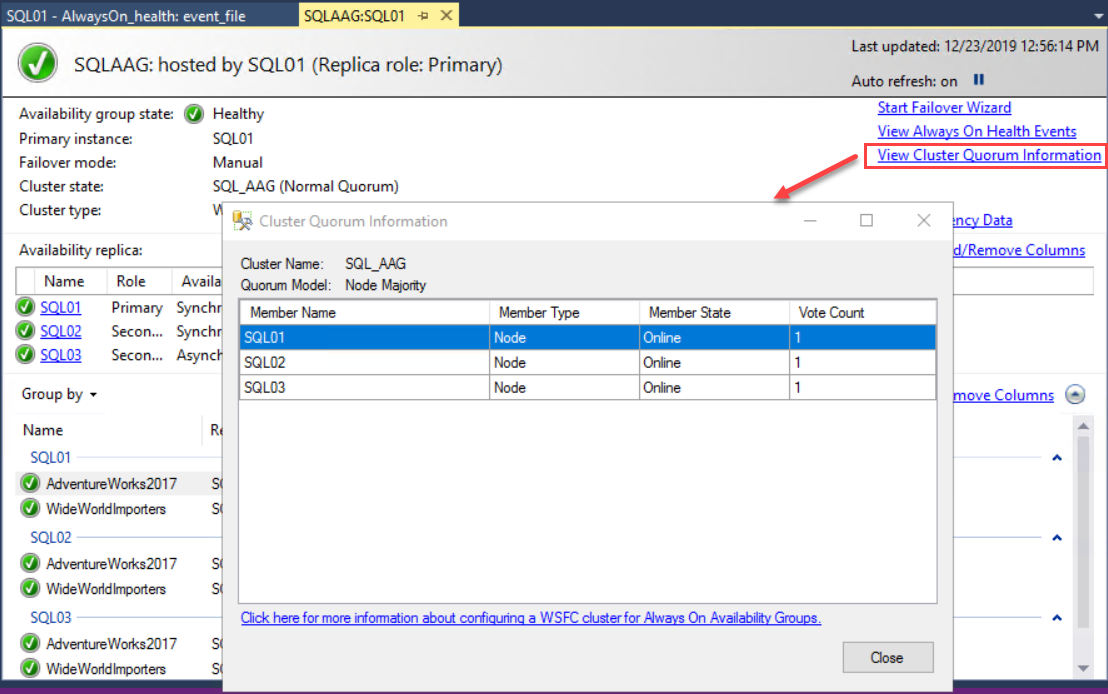
You can view the cluster quorum information by clicking “View Cluster Quorum Information”. In the cluster quorum information dialog box, you can see the name of the cluster, member type, state, and vote count. See the following image:
Monitoring AlwaysOn Availability groups using the Performance Monitor
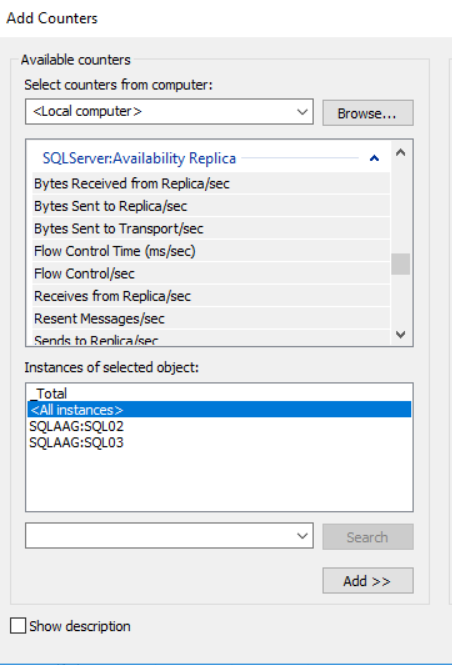
We can monitor Availability groups using built-in counters in the performance monitor. Here, Microsoft has added two objects with various performance counters. The objects are as follows:
- SQLServer:Availability Replica
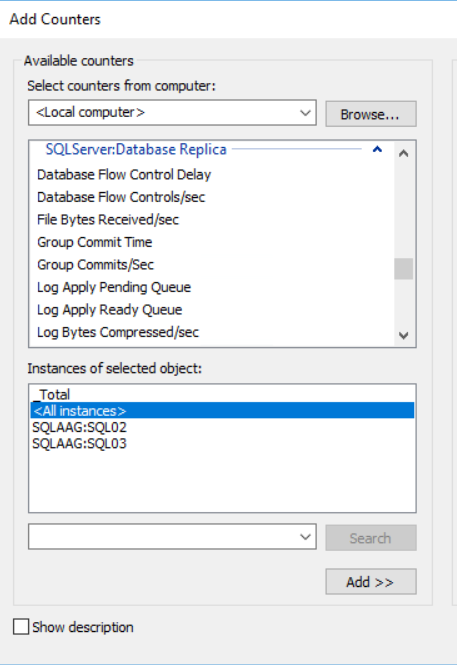
- SQLServer:Database Replica
SQLServer:Availability Replica object provides performance counters that are used to monitor the performance of AlwaysOn availability replicas.
Following is the description of the counters:
| Counter Name | Description |
| Bytes Received from Replica/sec | Shows the number of bytes received from the replica per second. |
| Bytes Sent to Replica/sec | Shows the number of bytes sent to the remote replica per second. On the primary replica, it shows the number of bytes sent to the secondary replica. On the secondary replica, it shows the number of bytes sent to the primary replica. |
| Bytes Sent to Transport/sec | Shows the actual number of bytes sent per second over the network to the remote replica. On the primary replica, it shows the number of bytes sent to the secondary replica. On the secondary replica, it shows the number of bytes sent to the primary replica. |
| Receives from Replica/sec | Shows the number of AlwaysOn messages received from the replica. |
| Recent Messages/sec | Shows the number of AlwaysOn messages re-sent in the previous second. |
| Sends to Replica/sec | Shows the number of AlwaysOn messages sent to the replica. |
| Sends to Transport/sec | Shows the actual number of AlwaysOn messages sent per second over the network to the remote availability replica. On the primary replica, it shows the number of messages sent to the secondary replica. On the secondary replica, it shows the number of messages sent to the primary replica. |
SQLServer:Database Replica object has a list of counters that are used to monitor the performance of the secondary replicas of an availability group. The SQLServer:Database Replica object is used only for SQL Server databases hosted on a secondary replica.
Following is the description of the counters:
|
Counter Name |
Description |
Can be viewed on |
|
File Bytes Received/sec |
Shows the amount of FILESTREAM data received by the secondary database of the secondary replica in the last second. |
On Secondary replica |
|
Log Bytes Received/sec |
Shows the number of log records received by the database in the secondary replica in the last second. |
On Secondary replica |
|
Log remaining for undo |
Shows the amount of log remaining to complete the undo phase. The log amount is displayed in kilobytes. |
On Secondary replica |
|
Log Send Queue |
Shows the number of log records in the log files of the primary database (in kilobytes) that have not been sent to the secondary replica. The size of the queue does not include FILESTREAM files that are sent to a secondary replica. |
On Secondary replica |
|
Mirrored Write Transaction/sec |
Shows the number of transactions that wrote to the mirrored database and are waiting for the log that is sent to the mirror to perform the commit, in the last second. |
On Primary replica |
|
Recovery Queue |
Shows the number of log records in the log files of the secondary replica that have not been redone yet. |
On Secondary replica |
|
Redo Bytes Remaining |
Shows the amount of log remaining to be redone to finish the reverting phase. The log size is displayed in kilobytes. |
On Secondary replica |
|
Redone Bytes/sec |
Shows the number of log records redone on the secondary database in the last second. |
On Secondary replica |
|
Total Log requiring undo |
Shows the total size of the log that must be undone. The size of the log is displayed in kilobytes. |
On Secondary replica |
|
Transaction Delay |
Shows the delay in waiting for unterminated commit acknowledgment. The time is displayed in milliseconds. |
On Secondary replica |
Summary
In this article, I have explained the different ways to monitor AlwaysOn Availability groups. In my next article, I will demonstrate the planned manual and automatic failover process using SQL Server Management Studio, T-SQL Script, and PowerShell.
Stay tuned..!
Tags: Always On, sql server Last modified: September 20, 2021