Introduction
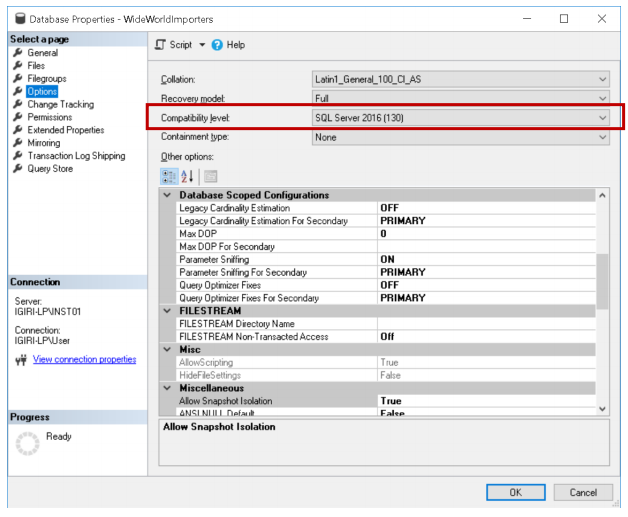
Query store is a new feature, introduced in SQL Server 2016, that allows database administrators to historically review queries and their associated plans using the GUI available in SQL Server Management Studio, as well as to analyze query performance using certain Dynamic Management Views. Query Store is a database scoped configuration option and is available for use if the compatibility level of the database in question is 130.
Query Store is similar to such technologies in the Oracle database platform as Automatic Workload Repository (AWR). The AWR captures performance statistics on an even greater scale than Query Store and allows a database administrator to historically analyze performance. Such concepts as a retention period and storage limits of data collected are available in the AWR architecture as they are in Query Store. The following key configuration options are available when enabling Query Store:
- Operation Mode: Determines if Query Store will accept newly captured data (ReadWrite Mode) or merely store old data available for reports (Read-only Mode)
- Data Flush Interval: Determines how often the Query Store memory buffers are flushed to a disk. Recall that Query Store data is stored in the database where Query Store is enabled. The default value is 15 minutes.
- Statistics Collection Interval: Determines how often query store runtime statistics are collected.
- Maximum Size: Determines on how much the repository for Query Store statistics can grow. By default, it is 100MB.
- Query Store Capture Mode: Determines the granularity of query captures. ALL, AUTO, and NONE are the available options. The default value is AUTO.
- Size Based Cleanup Mode: Determines whether Query Store will flush old data when the maximum size is reached.
- Stale Query Threshold: Determines the number of days for which Query Store retains data. The default value is set to thirty days.
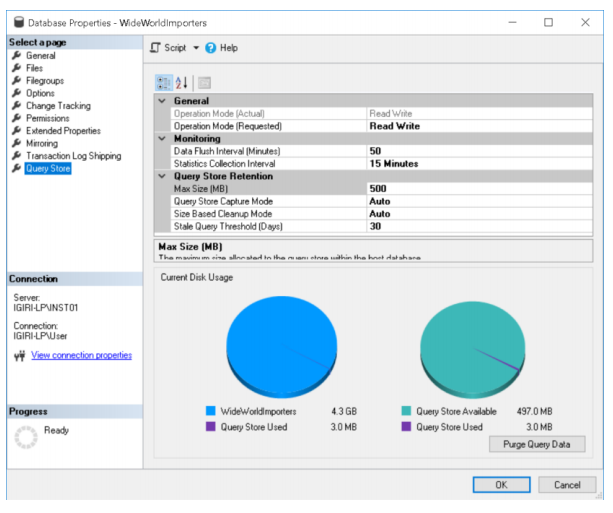
Fig. 2 Query Store Options
Query store is a database scoped feature that can be enabled either by using the GUI (SQL Server Management Studio) or by running the following command:
ALTER DATABASE [WideWorldImporters] SET QUERY_STORE = ON;
The query telemetry collected by Query Store is stored in system tables within the database where Query Store has been enabled.
Sample Queries & Default Reports
So far everything I have written is available from many other sources; some of them can be found in the references section.
In this section, we shall take a little bit deeper look at what we can actually do with Query Store once we have enabled it using simple examples. Let’s consider the following two queries:
Listing 1: Fetching Records using a Specific Filter
use WideWorldImporters
go
select
a.ContactPersonID
,a.OrderDate
,a.DeliveryMethodID
,a.Comments
,b.OrderedOuters
from
Purchasing.PurchaseOrders a
inner join Purchasing.PurchaseOrderLines b
on a.PurchaseOrderID=b.PurchaseOrderID
where a.SupplierReference='ML0300202';
go 1000
Listing 2: Fetching Records using a Range
use WideWorldImporters
go
select
a.ContactPersonID
,a.OrderDate
,a.DeliveryMethodID
,a.Comments
,b.OrderedOuters
from
Purchasing.PurchaseOrders a
inner join Purchasing.PurchaseOrderLines b
on a.PurchaseOrderID=b.PurchaseOrderID
where a.SupplierReference like 'ML%';
go 1500
Pay attention to the alternate version of these queries written in the upper case:
Listing 1: Fetching Records using a Specific Filter (Upper Case)
USE WIDEWORLDIMPORTERS
GO
SELECT
A.CONTACTPERSONID
,A.ORDERDATE
,A.DELIVERYMETHODID
,A.COMMENTS
,B.ORDEREDOUTERS
FROM
PURCHASING.PURCHASEORDERS A
INNER JOIN PURCHASING.PURCHASEORDERLINES B
ON A.PURCHASEORDERID=B.PURCHASEORDERID
WHERE A.SUPPLIERREFERENCE='ML0300202';
GO 500
Listing 2: Fetching Records using a Range (Upper Case)
USE WIDEWORLDIMPORTERS
GO
SELECT
A.CONTACTPERSONID
,A.ORDERDATE
,A.DELIVERYMETHODID
,A.COMMENTS
,B.ORDEREDOUTERS
FROM
PURCHASING.PURCHASEORDERS A
INNER JOIN PURCHASING.PURCHASEORDERLINES B
ON A.PURCHASEORDERID=B.PURCHASEORDERID
WHERE A.SUPPLIERREFERENCE LIKE 'ML%';
GO 250
As you can see, we ran these queries multiple times using the GO keyword. Thus, we have some reasonable amount of data to work with. The first thing we should be aware of when using Query Store to analyze performance is that there are six default reports built into the SQL Server 2016 Query Store as shown in Fig. 3.
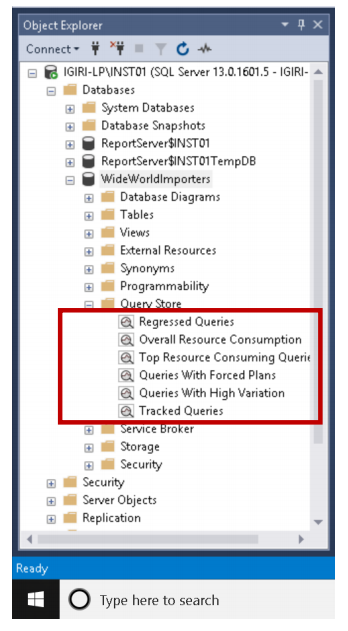
Fig. 3 Query Store Reports
The names of the reports are described in details in the previous articles as well as in the Microsoft documentation. The data provided by these reports is retrieved from the key Dynamic Management Views listed below:
Plan Stats DMVs
- sys.query_store_query_text – contains unique query texts executed against the database
- sys.query_store_plan – contains an estimated plan for the query with the compile time statistics
- sys.query_context_settings – contains some unique combinations of the plan affecting settings under which queries are executed
- sys.query_store_query – query entries that are tracked and forced separately in the Query Store
Run Time Stats DMVs
- sys.query_store_runtime_stats_interval – Query Store divides time into automatically generated time windows (intervals) and stores aggregated statistics on that interval for every executed plan
- sys.query_store_runtime_stats – contains aggregated runtime statistics for executed plans
Much more details on how to use these DMVs are available in the referenced Microsoft Documentation. In this article, we shall simply use the GUI mostly.
As you can see from Fig. 4, we review the Overall Resource Consumption report while in the next section, we are going to narrow down to the queries we listed earlier and the data we can retrieve from these simple queries.
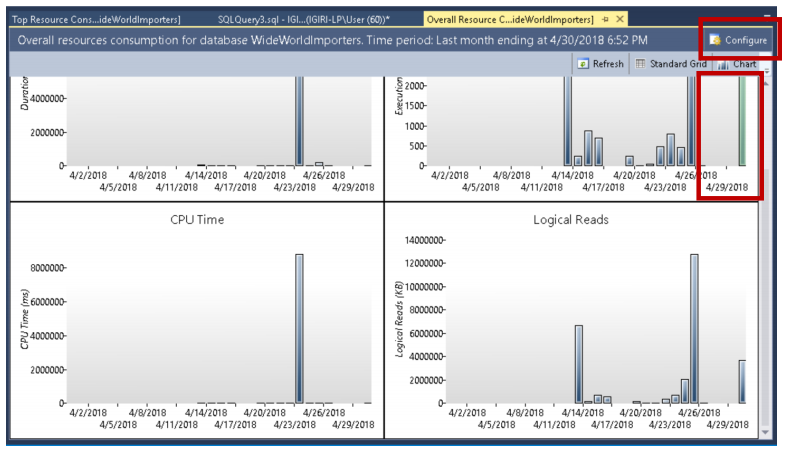
Fig. 4 Overall Resource Consumption Report
Analyzing Queries Using the GUI
A few key things should be considered helpful when using the Query Store Reports:
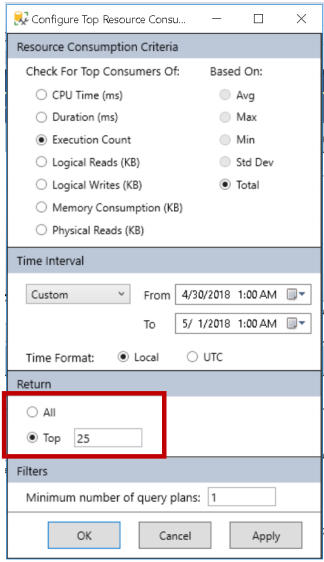
- You can configure the environment by clicking the button highlighted in Fig 4. Fig. 5 shows us the details we can change to suit our use case: criteria of data to be returned, date range, and data set to be returned. For example, if I want to see clearly the Query ID associated with the queries I am reviewing I would like to reduce my data set from the default Top 25 to Top 10, for example.

Fig. 5 Report Configuration Options

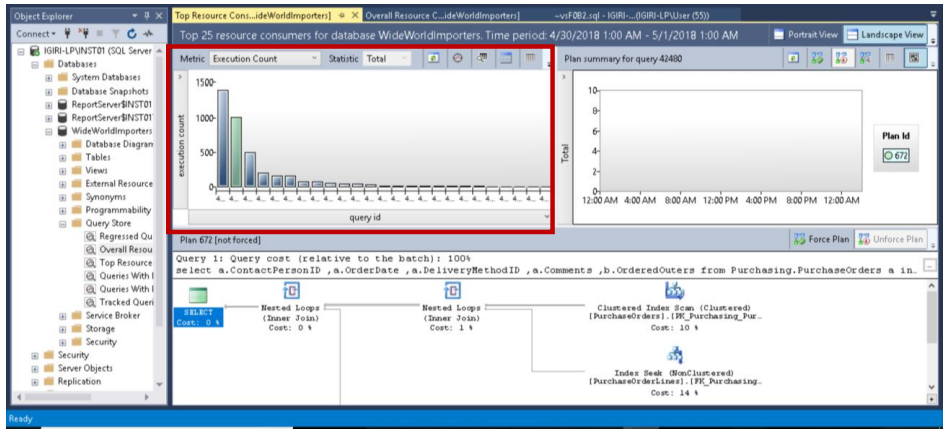
Fig. 6 Top 25 Queries Executed on 1st May 2018

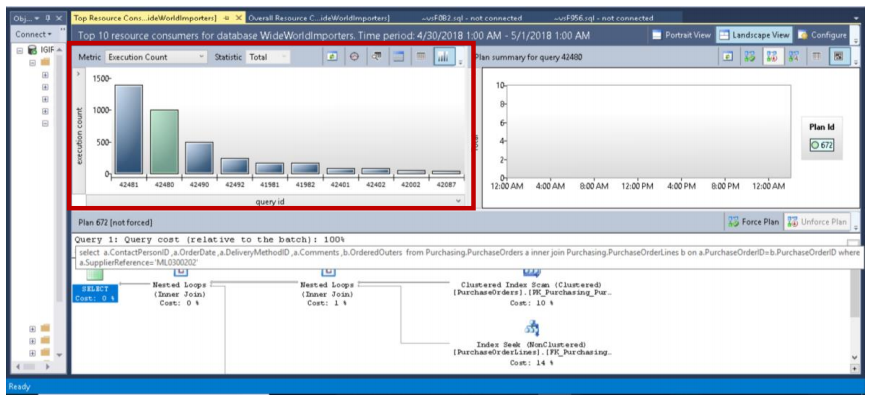
Fig. 7 Top 10 Queries Executed on 1st May 2018
- The bar charts display data mostly with time on the x-axis but you can drill down a specific data point to view data based on Query IDs. Each Query ID determines a specific query. It is important to note that a query is uniquely identified by hashing the text. Thus, a query in the lower case differs from the same query in the upper case. This should be a common knowledge: ad-hoc queries are a concern for the plan cache and they are also bad for the query store both in terms of space usage and proper analysis.

Fig. 8 Query in Listing 1 (Lower Case, Query 42480)

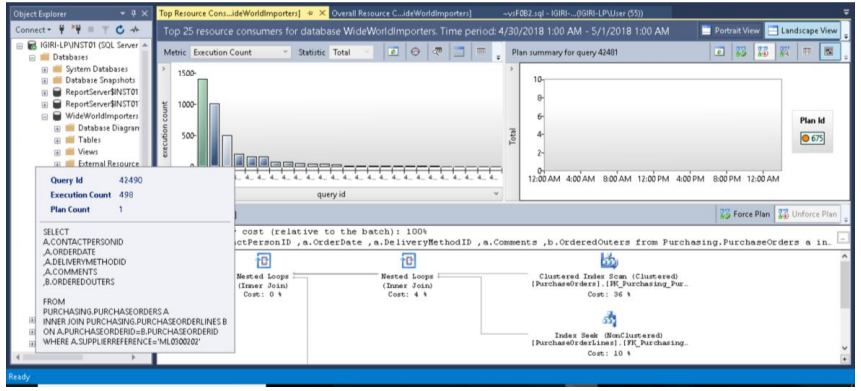
Fig. 9 Query in Listing 3 (Upper Case, Query 42490)
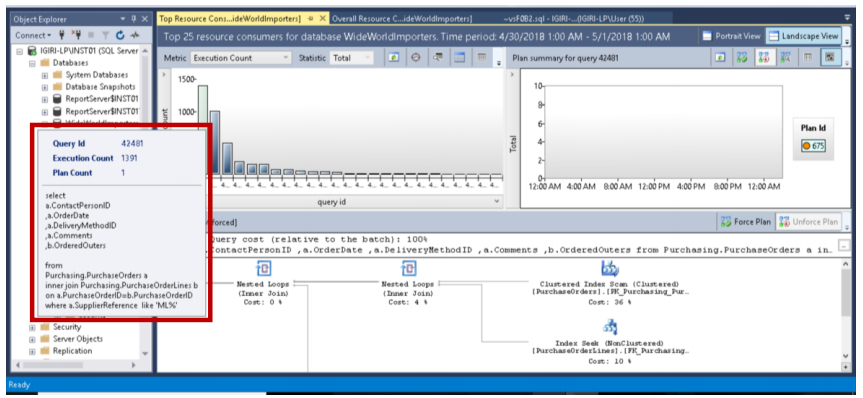
- The third important observation is the fact that when a data point is highlighted green, the detailed execution plan shown in the lower pane pertains to that data point. In Fig. 7, this data point refers to Query ID 42481 which we earlier executed (full query shown in Listing 2). Hovering our mouse over this data point displays the query, its ID, and the number of plans associated with this query (see Fig. 8).

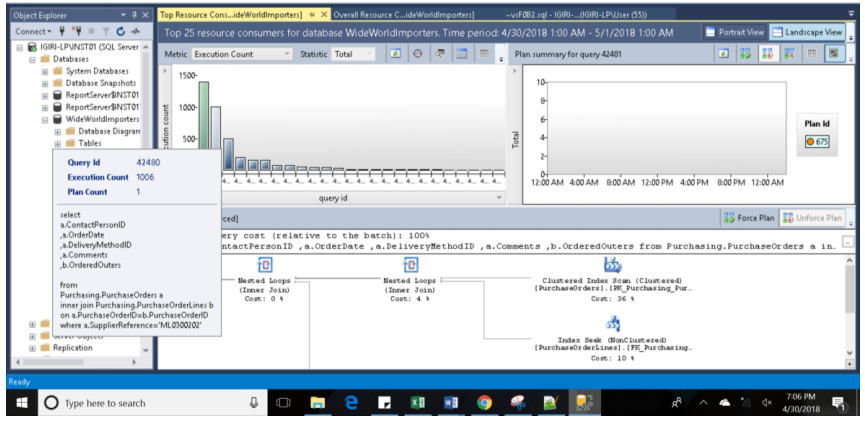
Fig. 10 Query 42481 Details
Our query was executed 1391 times as it is accurately captured by Query Store and displayed in the y-axis (execution count) of the bar chart in Fig. 10. The report was being pulled while the batch was still executing. Thus, we do not have the full count (1500) informing us that there is a real-time capture of data each time a query is executed. On the right-hand side, we also see the Plan being used for these multiple executions (Plan 675). We can verify this using the query in Listing 5.
Listing 5
USE WideWorldImporters
GO
SELECT Txt.query_text_id, Txt.query_sql_text, Pl.plan_id, Qry.*
FROM sys.query_store_plan AS Pl
JOIN sys.query_store_query AS Qry
 ON Pl.query_id = Qry.query_id
JOIN sys.query_store_query_text AS Txt
 ON Qry.query_text_id = Txt.query_text_id
where Qry.query_id=42481;
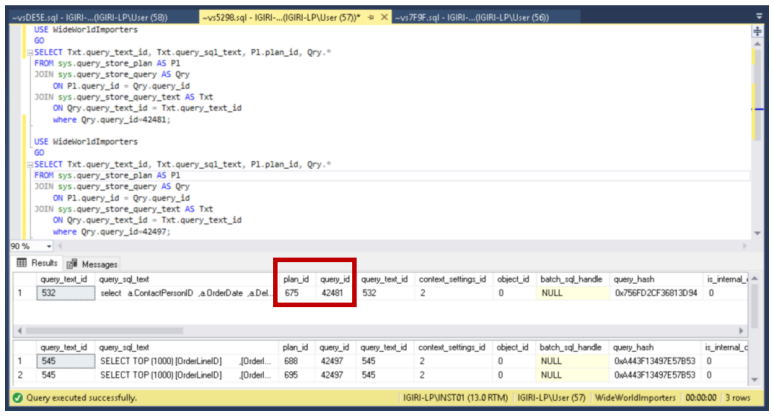
Fig. 11 Query ID and Plan ID from DMVs
A Little Bit of Tuning
Let’s take a look at another query.
When we run the query in Listing 6 and examine the details from Query Store, the execution plan details reveal that we need an index to get 51% improvement.
Listing 6: Sub-optimal Query
SELECT TOP (1000) [OrderLineID]
 ,[OrderID]
 ,[StockItemID]
 ,[Description]
 ,[PackageTypeID]
 ,[Quantity]
 ,[UnitPrice]
 ,[TaxRate]
 ,[PickedQuantity]
 ,[PickingCompletedWhen]
 ,[LastEditedBy]
 ,[LastEditedWhen]
 FROM [WideWorldImporters].[Sales].[OrderLines]
 where unitPrice > 1000
 GO 2000
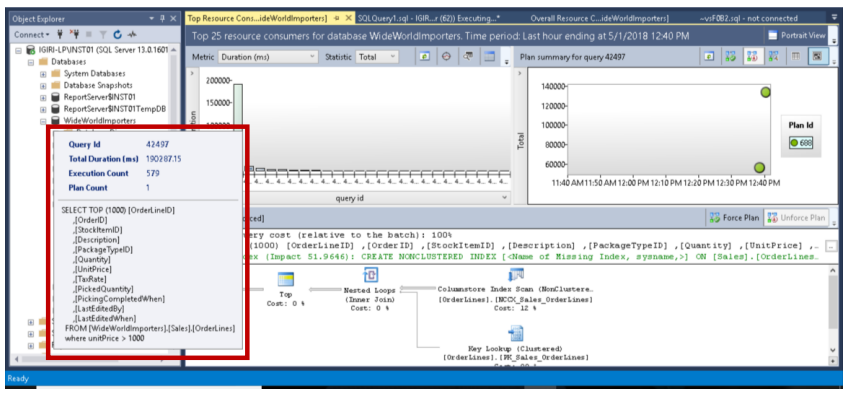
Fig. 12 Sub-optimal Query Details
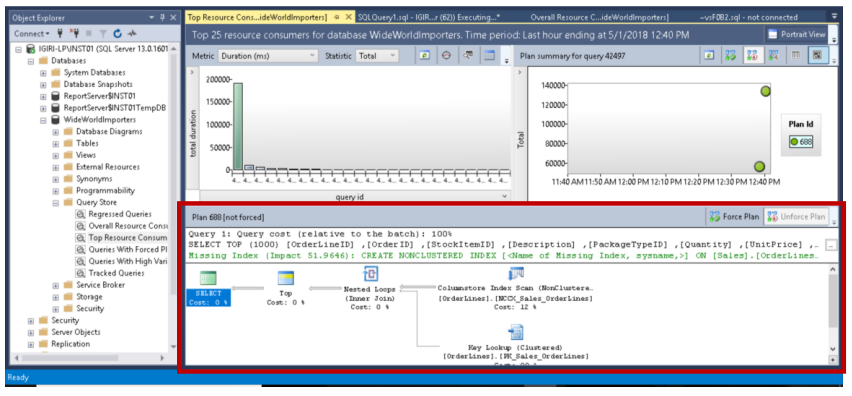
Fig. 13 Sub-optimal Query Execution Plan
Once we create the recommended index using the statement in Listing 7, we cause the Query Optimizer to generate a new execution plan. In this case, the new execution plan is expected to improve performance. However, there are cases where certain changes may cause degraded performance such as significant changes in data volume that effectively invalidate statistics or drop the number of indexes and so on. Such queries are said to have regressed in performance and can be examined using the Regressed Queries report in Query Store.
Listing 7: Index Creation
USE [WideWorldImporters]
GO
CREATE NONCLUSTERED INDEX [Custom_IX_UnitPrice]
ON [Sales].[OrderLines] ([UnitPrice])
INCLUDE
([OrderLineID],[OrderID],[StockItemID],[Description],[PackageTypeID],[Quantit
y],[TaxRate],[PickedQuantity],[PickingCompletedWhen],[LastEditedBy],[LastEdit
edWhen])
GO
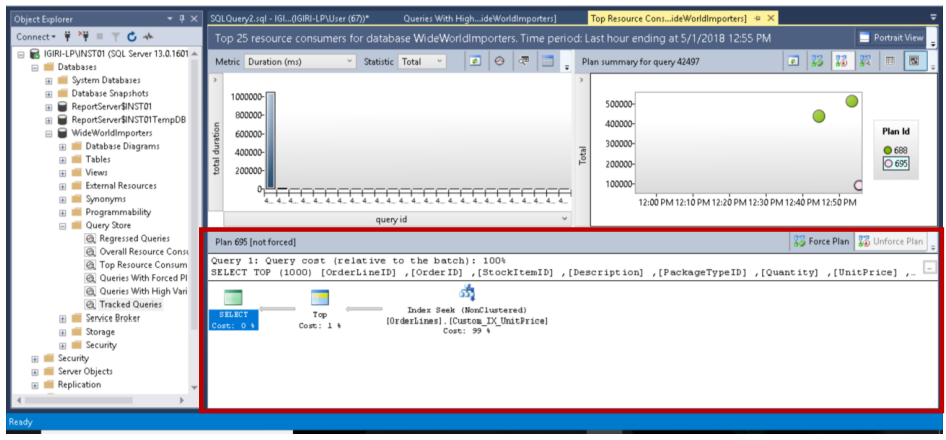
Fig. 14 Optimized Query (Change in Execution Plan)
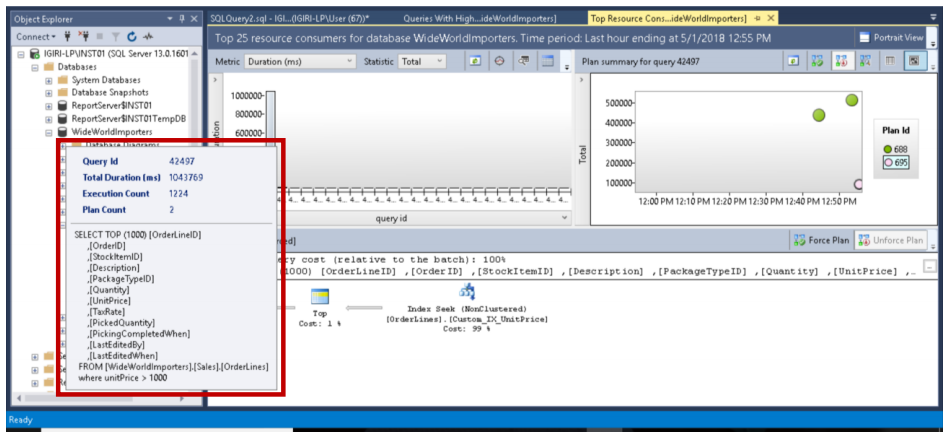
Fig. 15 Optimized Query (Two Plans)
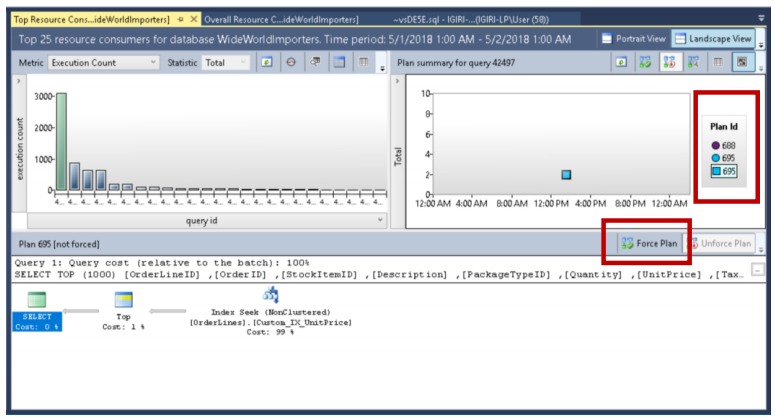
Fig. 16 Optimized Query (Force Plan)
When there are multiple plans for a query as shown in Fig. 14 and Fig. 16, we can tell the optimizer to always use a plan we choose by clicking the Force Plan button. This was a bit tedious task in the previous versions of SQL Server.
As you can see from Fig. 17, Query Store allows us to compare the different plans associated with a query using a number of metrics.
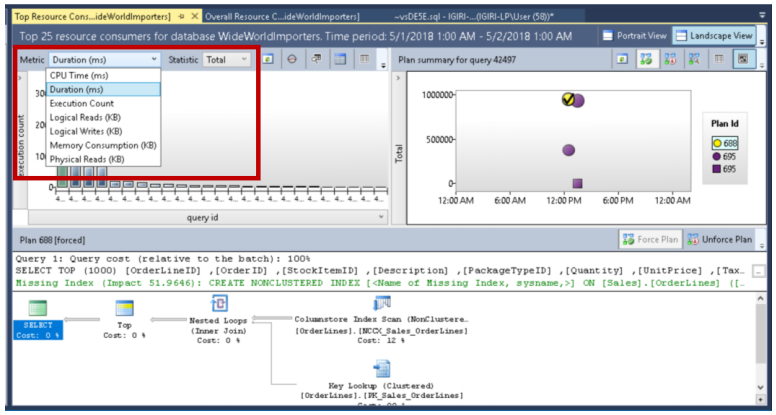
Fig. 17 Comparing Execution Plans
Again, we can use the query in Listing 8 to verify the plans associated with this query ID using DMVs. (Refer to Fig. 11)
Listing 8: Plans Associated with Query 42497
USE WideWorldImporters
GO
SELECT Txt.query_text_id, Txt.query_sql_text, Pl.plan_id, Qry.*
FROM sys.query_store_plan AS Pl
JOIN sys.query_store_query AS Qry
 ON Pl.query_id = Qry.query_id
JOIN sys.query_store_query_text AS Txt
 ON Qry.query_text_id = Txt.query_text_id
where Qry.query_id=42497;
Exploring Variations
Another useful report that Query Store avails us is the Queries With High Variation. This report shows us how far apart the desired metrics are for a specific query over a given period. This is very useful for historical analysis of performance. Using the statements in Listing 9, we generate data that can give a picture of what variations would look like. The steps in the procedure simply create a small table and then insert records using different batch sizes.
Listing 9: Plans Associated with Query 42497
use WideWorldImporters
go
-- Create a Table
create table tableone
(ID int identity(1000,1)
,FirstName varchar(30)
,LastName varchar(30)
,CountryCode char(2)
,HireDate datetime2 default getdate());
-- Insert records in Batches of Different Sizes
insert into tableone values ('Kenneth','Igiri','NG',getdate());
GO 10000
insert into tableone values ('Kwame','Boateng','GH', getdate());
GO 10
insert into tableone values ('Philip','Onu','NG',getdate());
GO 100000
insert into tableone values ('Kwesi','Armah','GH', getdate());
GO 100
Query Store shows us details such as the minimum and maximum values of these metrics for specific execution intervals of the query we are interested in. In this example, we find that this is simply a result of the number of batches per execution (note that the parameters are actually being used to execute the INSERT statement). In the production, other factors could be responsible for such variations.
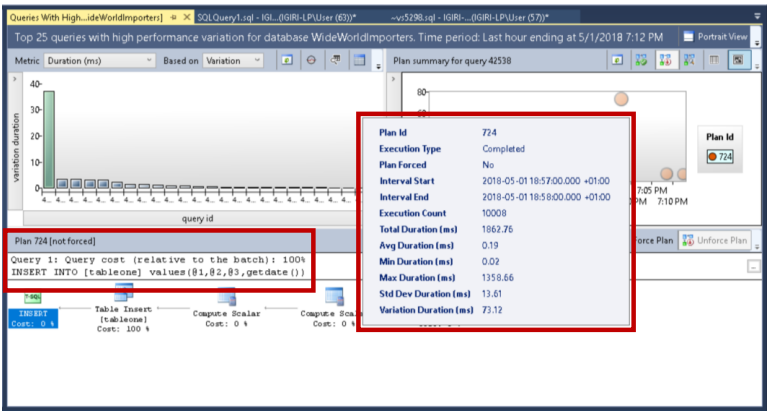
Fig. 18 Variations in Duration
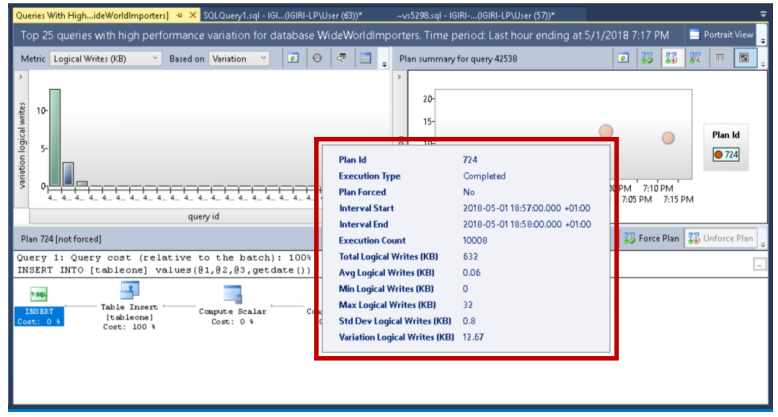
Fig. 19 Variation in Logical Writes
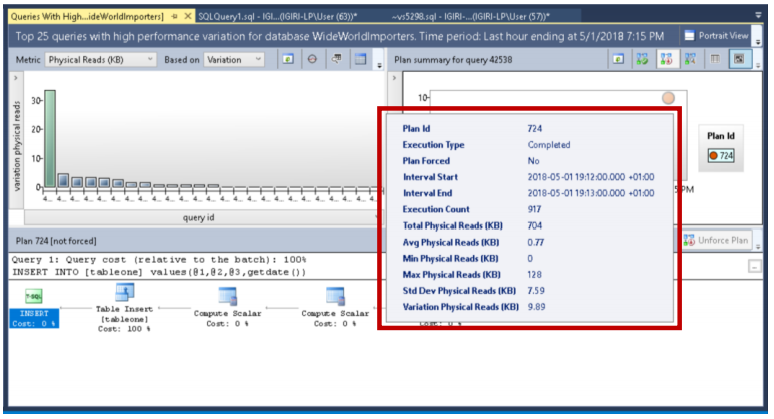
Fig. 20 Variation in Physical Reads
Conclusion
In this article, we have reviewed the SQL Server 2016 Query Store GUI environment and a few things we can deduce regarding the performance of our instance (with respect to SQL) using Query Store. There are several articles on the Internet that show even more advanced use cases and much deeper explanation of the internals. This article should be of good use to mid-level DBAs who want to get a head start in using Query Store for performance evaluation/tuning.
References
- Best Practice with the Query Store
- Cristiman, L. (2016) Query Store – Settings and Limits
- Monitoring Performance by Using the Query Store
- Query Store Catalog Views
- Query Store Stored Procedures
- Query Store – How It Works and How to Use It
- Query Store Usage Scenarios
- Van de Lar, E. (2016) SQL Server 2016 Query Store: Forcing Execution Plans Using the Query Store
Useful tool:
dbForge Query Builder for SQL Server – allows users to build quickly and easily complex SQL queries via an intuitive visual interface without manual code writing.