When working as a SQL Server database administrator, you should have the skills to dive deeply into the ocean of the SQL Server Engine and find what is happening internally, in order to be able to detect, troubleshoot and fix any problem that you may face.
You can take benefits from the logs that are written by the SQL Server engine locally in the form of SQL Server logs or externally in the form of event logs, but you cannot consider them as the only source for your troubleshooting and tuning operations.
SQL Server provides you with a number of built-in features that can be used to collect the different types of SQL Server events. In this article, we will go through these built-in features and consider one of the most efficient free 3rd party tools that can be used to collect and analyze SQL Server events.
SQL Profiler
SQL Server Profiler is used widely by SQL Server database administrators and developers to collect variant types of events about the queries running on the connected SQL Server instance and then use this information to enhance the query performance.
SQL Profiler provides you with the ability to capture a large variety of events, specify the event properties that you are interested in and filter the captured data based on previously specified property values. You can go to the depth of which user is performing what type of action on which database table, from which machine and at what time exactly. In addition, SQL Profiler displays the number of resources consumed and shows whether the action is completed or failed with an error.
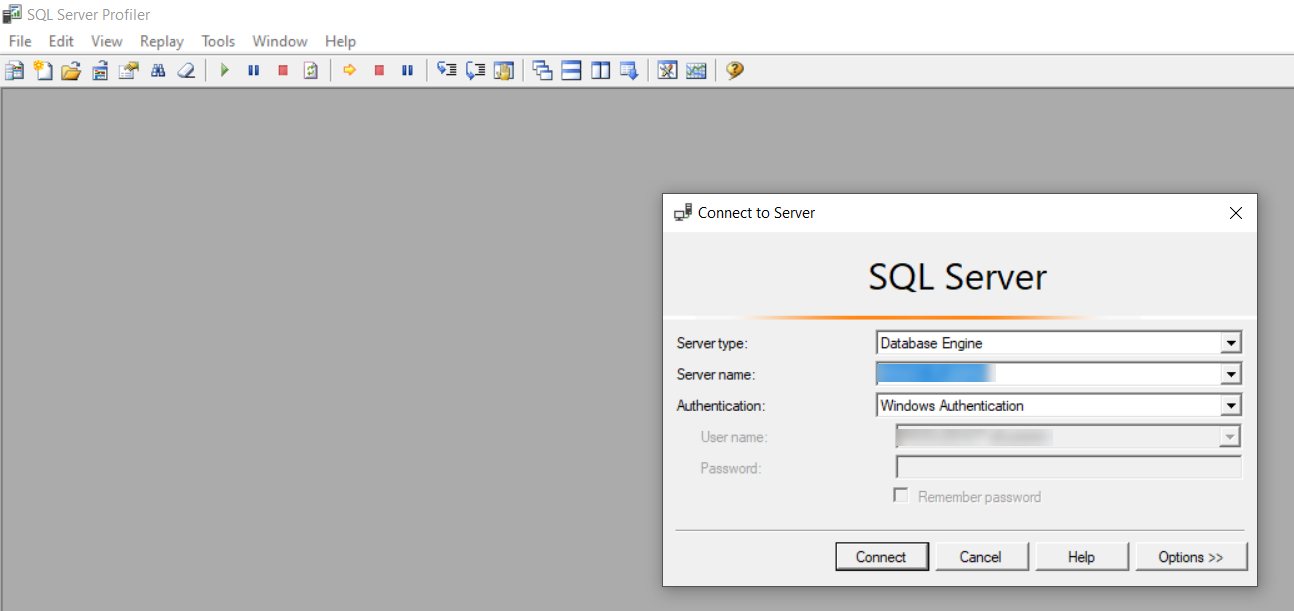
Events collecting via SQL Profiler is performed either by using a number of existing templates or by creating your own customized template using the existing events. First, you need to connect to the SQL Server instance from which you plan to capture the events, by providing the name of the SQL Server instance, the authentication method, and credentials required to connect to that SQL Server instance, as shown below:
After connecting to the SQL Server instance, you will be requested to specify the template for the events to be collected, based on the profiling process purpose, as shown below:
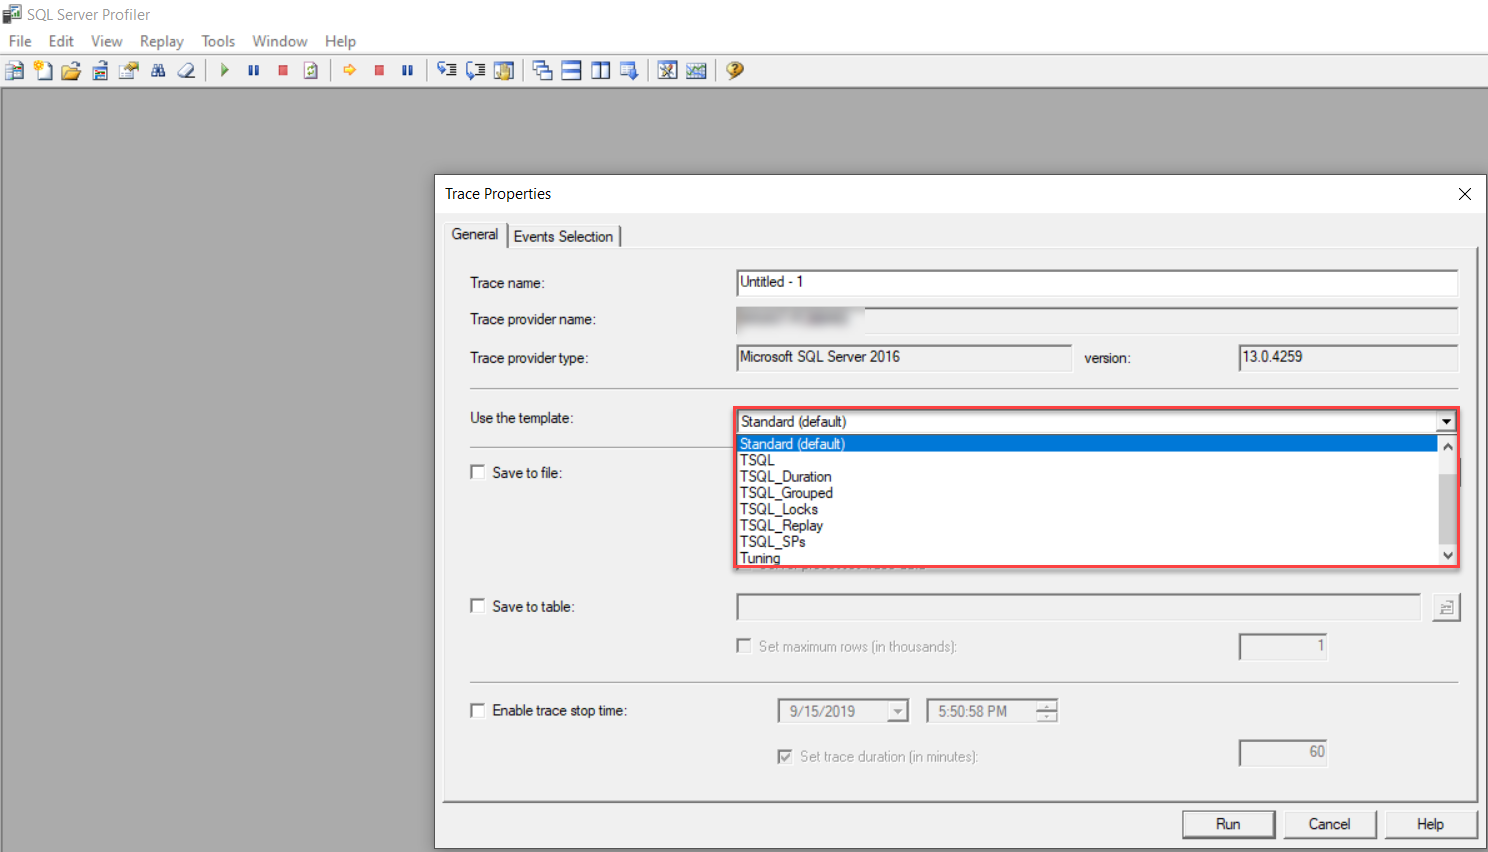
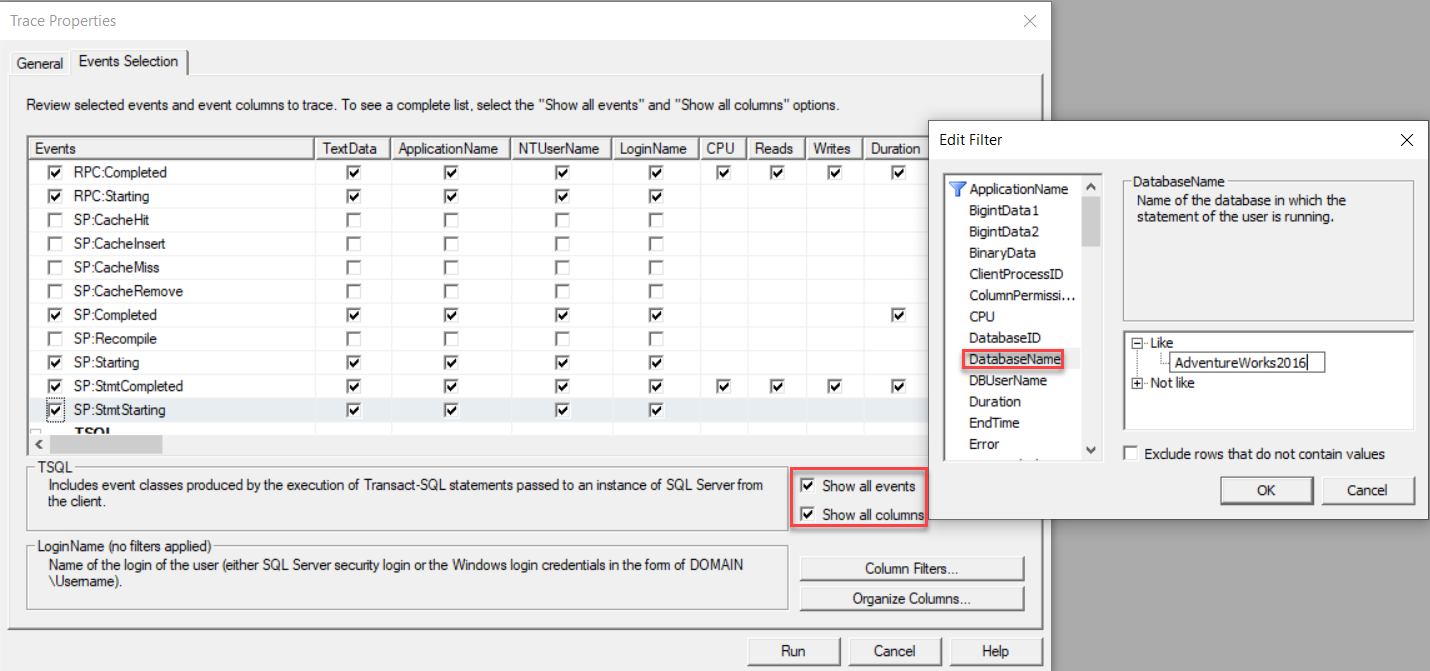
You can see from the previous image that SQL Profiler provides you with an option to save the tracing result to a file or to an existing database table. If none of the provided templates fit your requirements, you can easily move to the Events Selection tab and tick to show all events and columns and then filter the captured events with the properties you are interested in. For example, you can filter to capture events coming from a specific database, a database user, a database table, host machine and so on, as follows:
Once you’ve selected the events that you are interested in, just click the Run button and start receiving events from the selected database, as shown below:
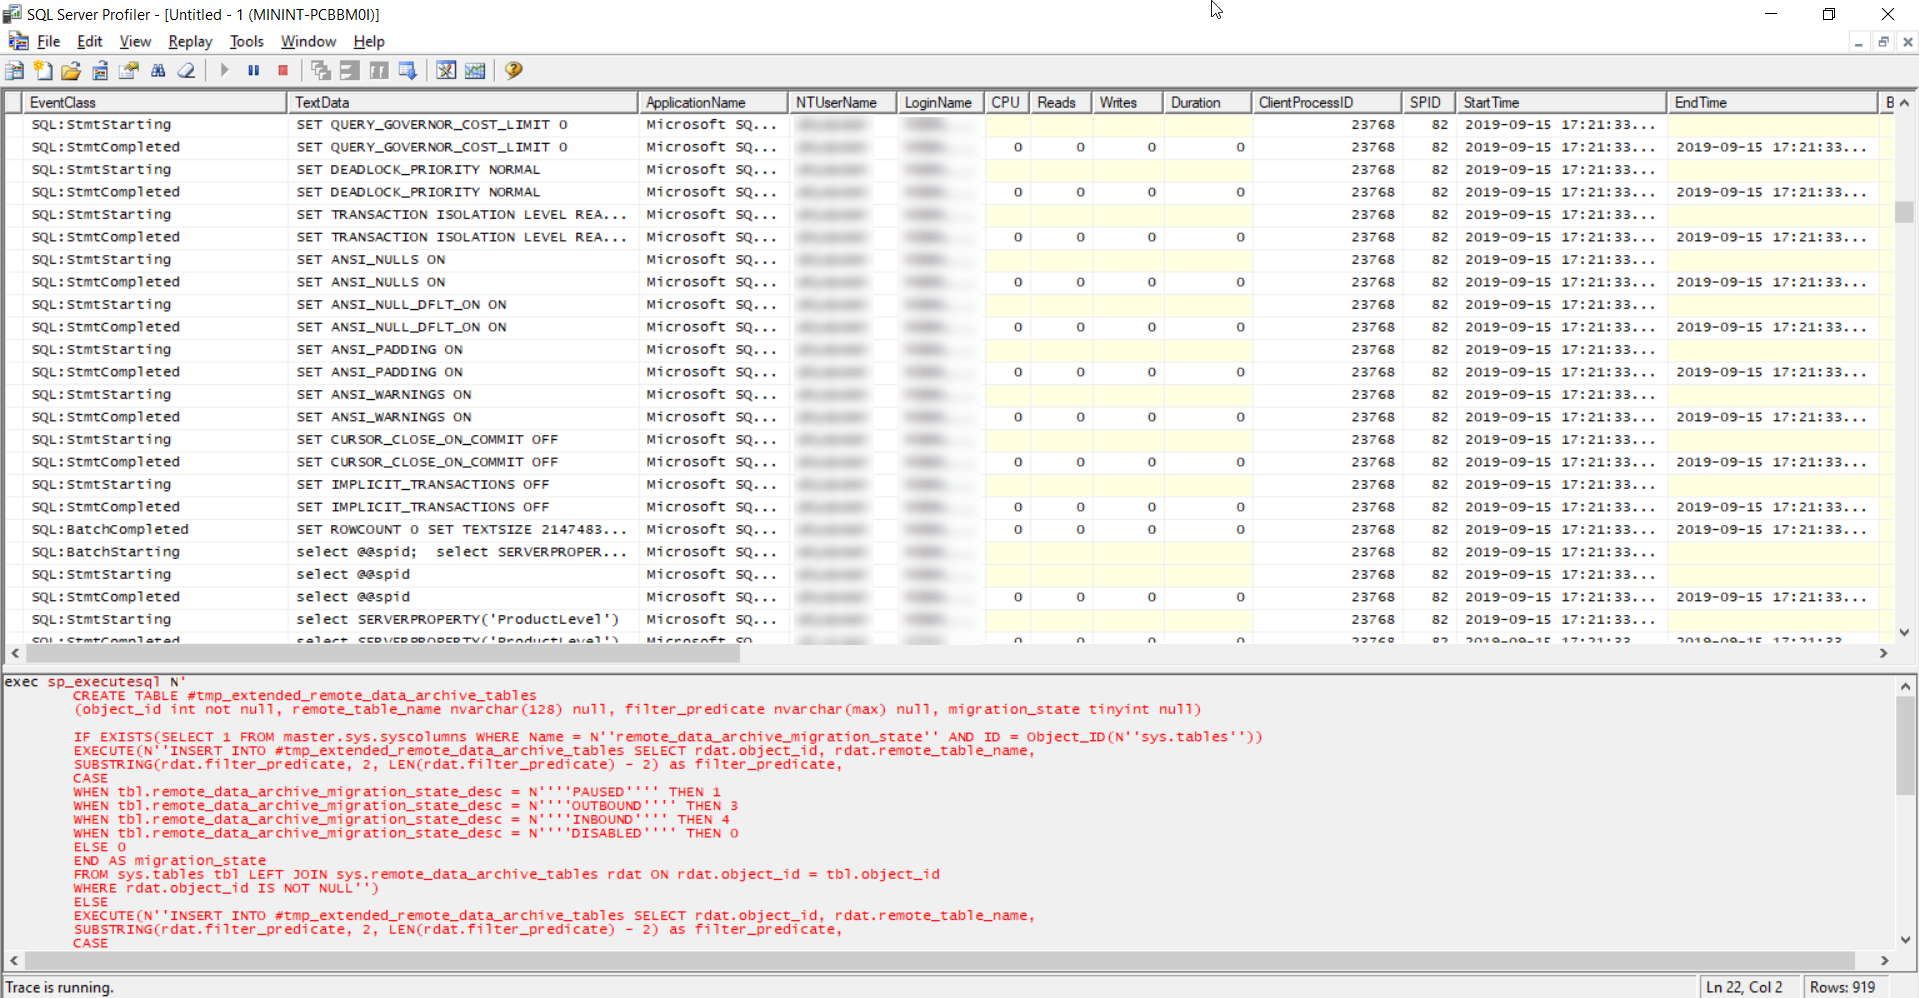
Take into consideration that, if you do not define a very accurate filter to collect only the events you are interested in, SQL Profiler will collect a large number of events that will be hard to read and analyze. In addition, it is not recommended to run the SQL Profiler tool on the production environment as it will “eat” the server resources and kill its performance. If you need badly to use it, try to narrow down the scope of the events to be captured by using accurate filters.
Extended Events
In order to overcome the performance degradation issue caused by using the SQL Profiler deprecated tool to capture the different types of SQL events, a lightweight, highly scalable and configurable performance monitoring feature was introduced in SQL Server 2008, that can be used in collecting useful information from the wide range of available actions, with the least possible SQL resources consumption, which helps in troubleshooting and tuning the performance of the SQL Server queries. This events capturing feature is called SQL Server Extended Events.
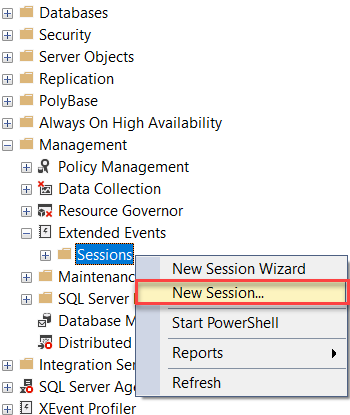
The Extended Events feature is accessible via SQL Server Management Studio, from the Extended Events option under the Management node. To create a new Extended Events session, right-click the Sessions option, under the Extended Events node and select New Session as below:
From the New Session window, you have the option to select from a number of available templates, with more predefined templates than the SQL Profiler templates, or simply to use Blank template and specify explicitly the events that you are interested in, as shown below:
![]()
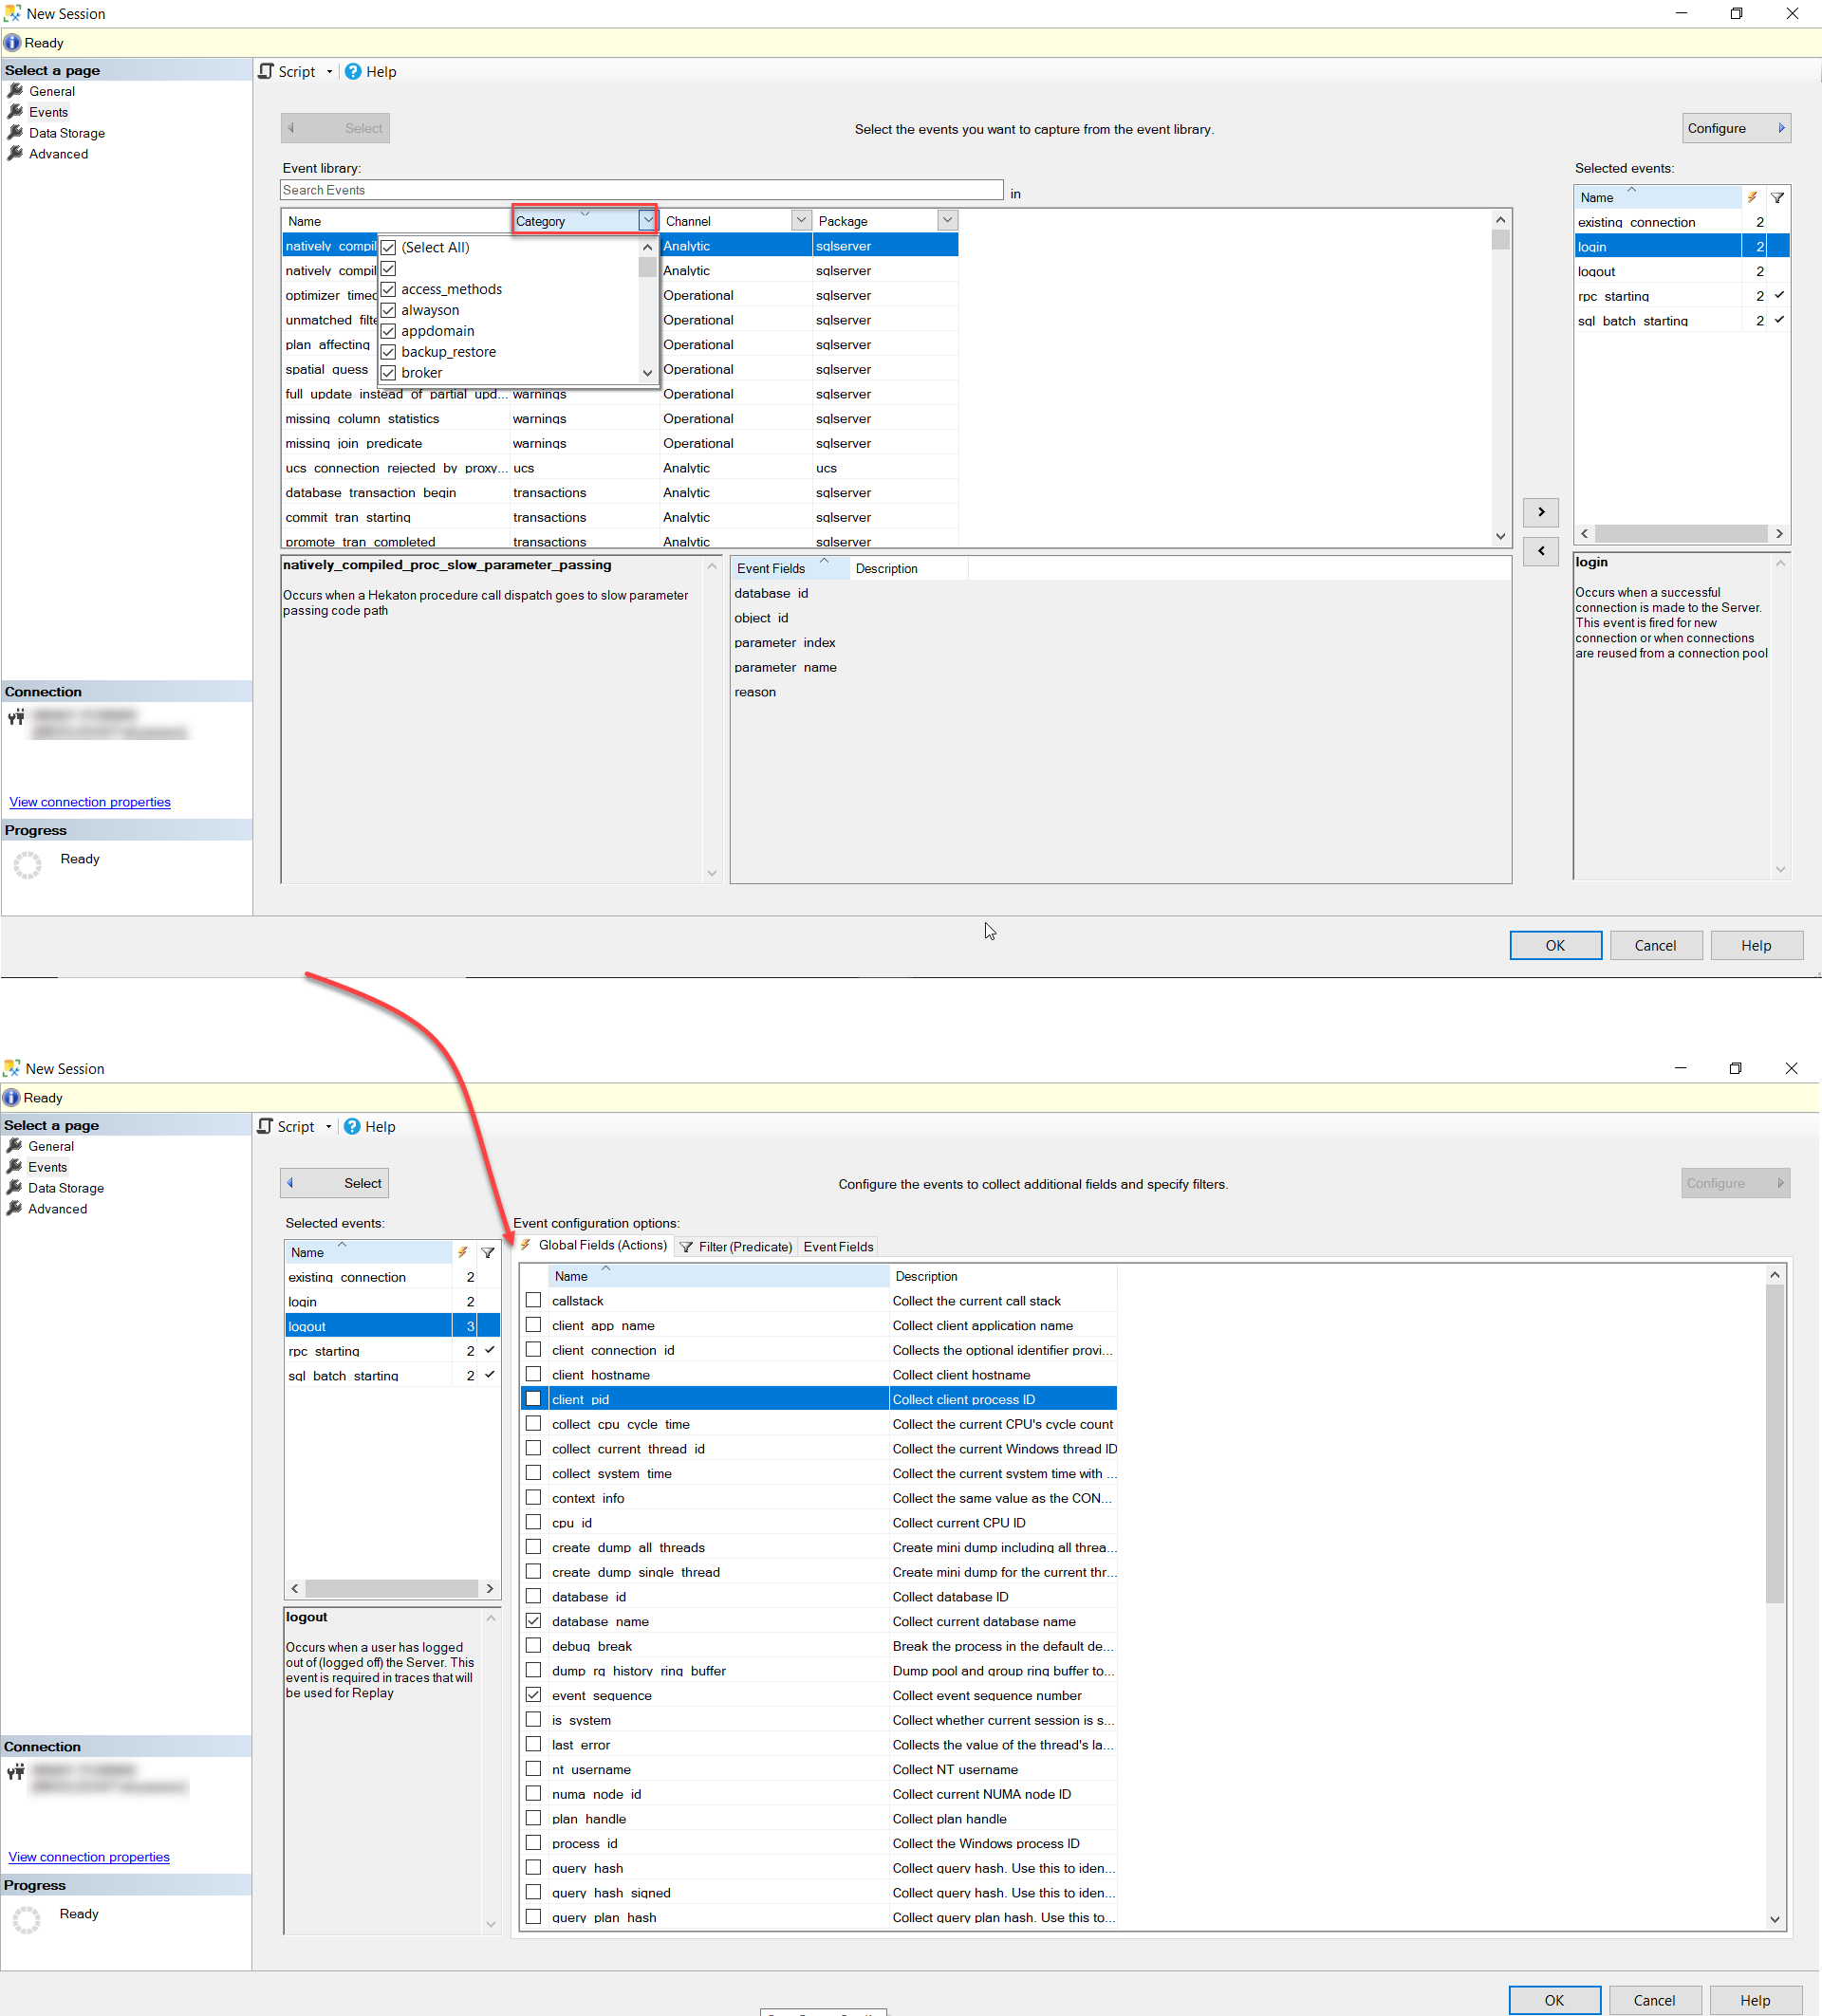
From the Events tab, you can filter the events you are interested in based on the events category, then choose which properties for each event you need to retrieve. In addition, you can create a customized filter to narrow down the scope of the captured events, as shown below:
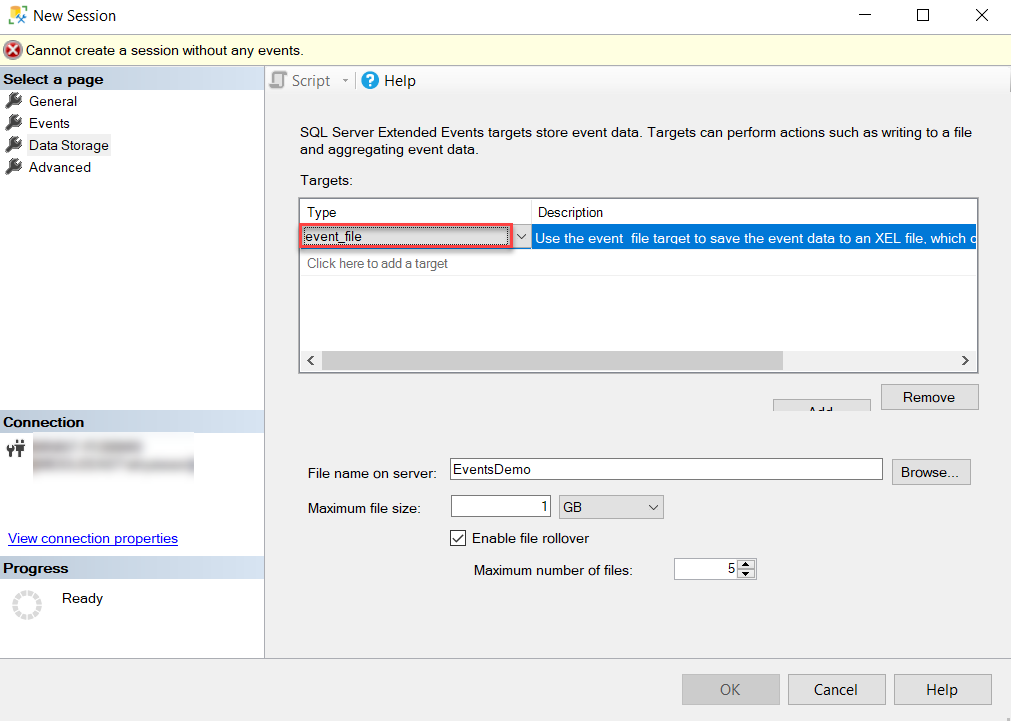
The Storage page provides you with different options to save the Extended Events session result. In this example, we will keep the trace result to an Extended Events file with the settings configured below:
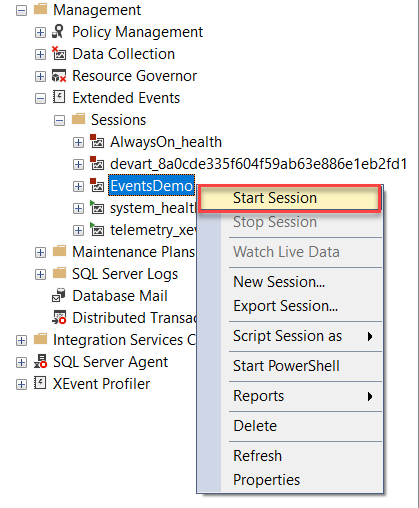
After customizing the Extended Events session to meet your monitoring requirements, click the OK button to create the session. After the session has been created, it will not start automatically capturing the events unless you configure that during the session creation process. To allow the session start capturing events, right-click the created session and select the Start Session option, as shown below:
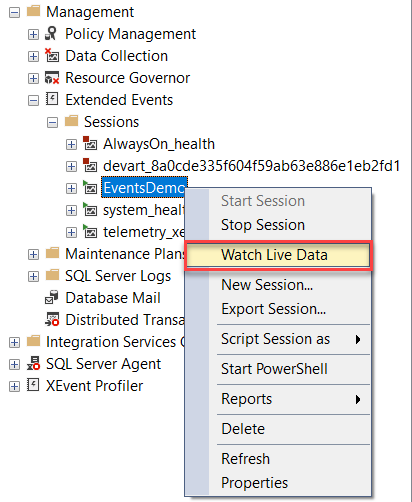
To view the captured session you have the option to open the physical file that is configured previously to store the events, or simply right-click the created session and select the Watch Live Data option, as shown below:
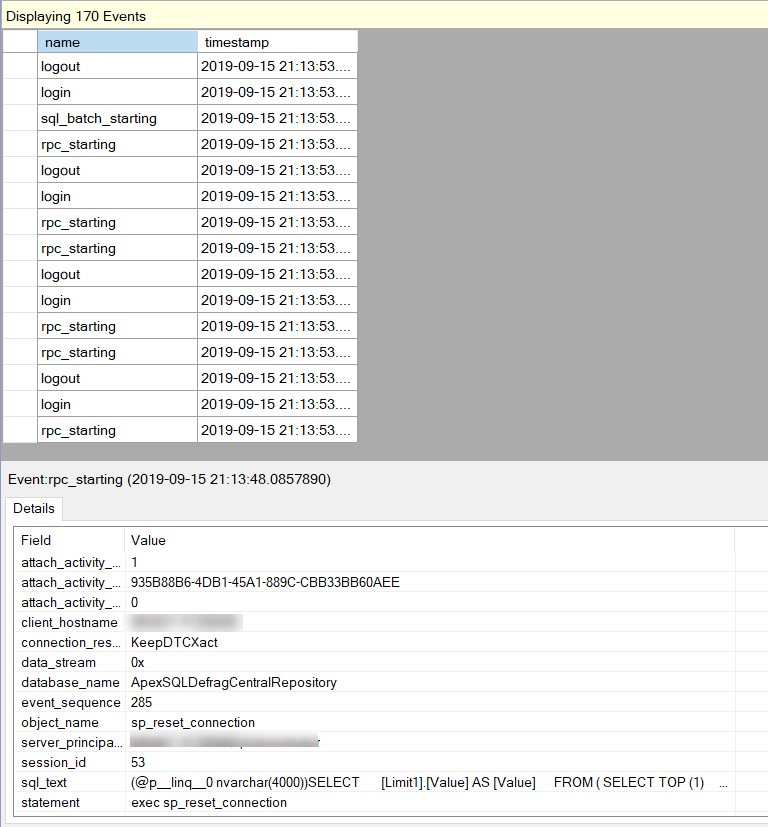
A new window will be opened, showing the collected events with the properties values for each event, as below:
Although you can create Extended events easily with a few clicks, you still face some difficulties while trying to choose the correct event to monitor, due to the complexity in the events naming convention, that makes it difficult to understand the purpose behind each event. In addition, the GUI in which the session information is displayed is still not user-friendly that complicates analyzing the events and their properties. From this point, the need for a more user-friendly 3rd party tool is rising, which we will discuss in the next section of this article.
dbForge Event Profiler
dbForge Event Profiler for SQL Server is a FREE tool that provides you with the ability to capture and analyze the SQL Server events and store the events data in a physical trace file for later examination.
dbForge Event Profiler for SQL Server overcomes the SQL Profiler performance degradation issue by running with the highest possible performance and the minimal server load with full support for the Extended Events feature.
What makes the dbForge Event Profiler for SQL Server attractive event profiler tool over the Extended Events feature is the Query syntax highlighting feature which is not available in the SQL Profiler or Extended Events feature. In addition, it provides the ability to perform the filtering and sorting operations in the grid with tracing results.
dbForge Event Profiler for SQL Server can be easily used to monitor the different types of activities from the SQL Server Database Engine, Analysis Services, and Integration Services, troubleshoot T-SQL queries and transactions performance-related problems and monitor the different SQL Server errors and warnings.
In addition, the dbForge Event Profiler for SQL Server can be used for auditing the different activities of the SQL Server database users or performing stress or quality assurance tests. You can also simply create your own custom traces and save them for future use.
In order to use dbForge Event Profiler for SQL Server to capture the SQL Server events, you need to download it from the dbForge Download page, for free, and install it to your SQL Server or machine using the straight-forward installation wizard, as below:
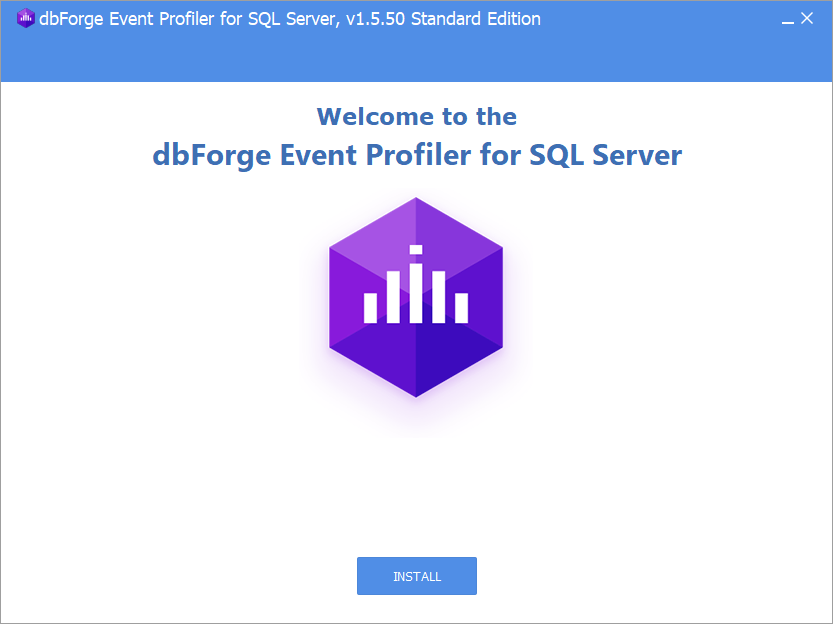
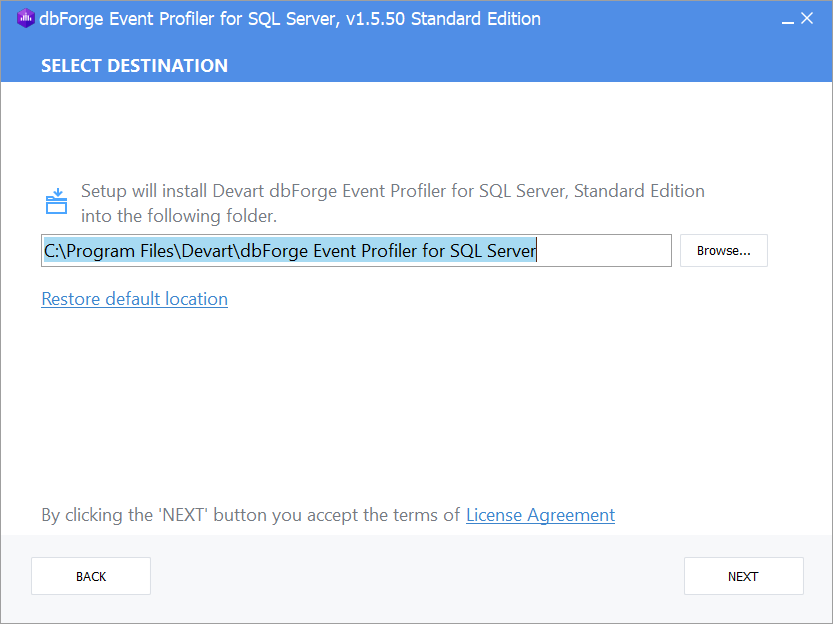
To start the installation process, click the INSTALL button from the Welcome page and specify the location where you want to install the tool, from the Select Destination page below:
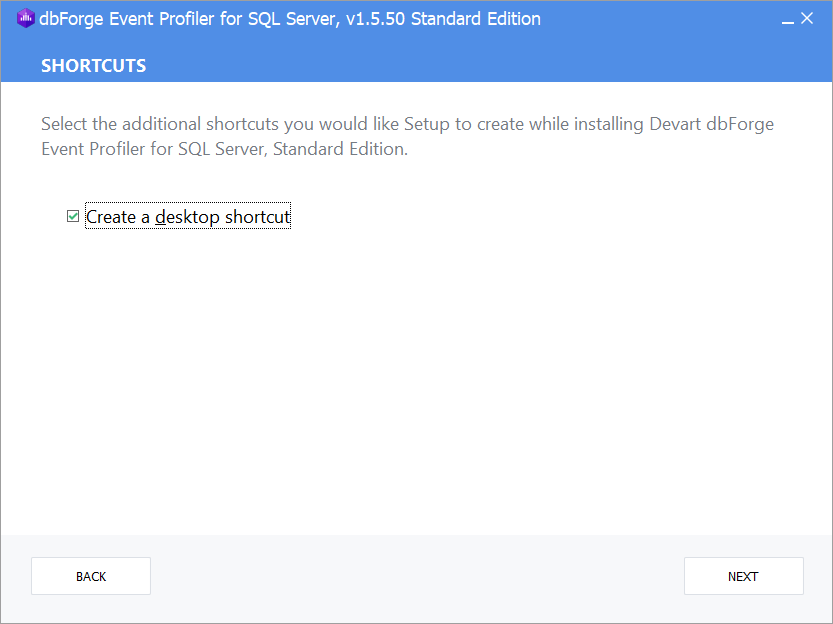
After specifying the installation location, click the Next button. In the Shortcuts page, specify whether you plan to create a shortcut icon for the dbForge tool on your desktop, then click Next to proceed:
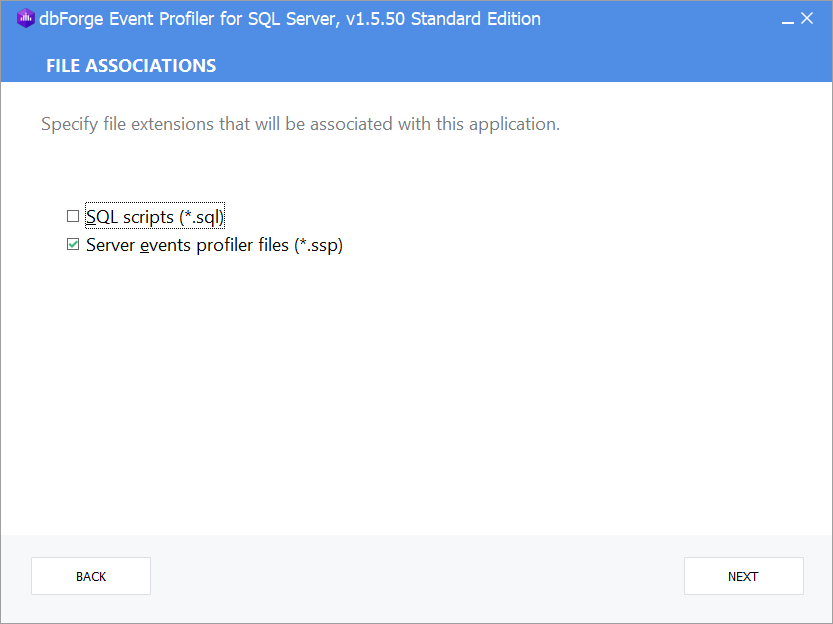
On the File Associations page, you will be requested to specify the extension for the files that will be associated with the dbForge tool. Select the extension for the files you plan to open using this tool then click Next to proceed:
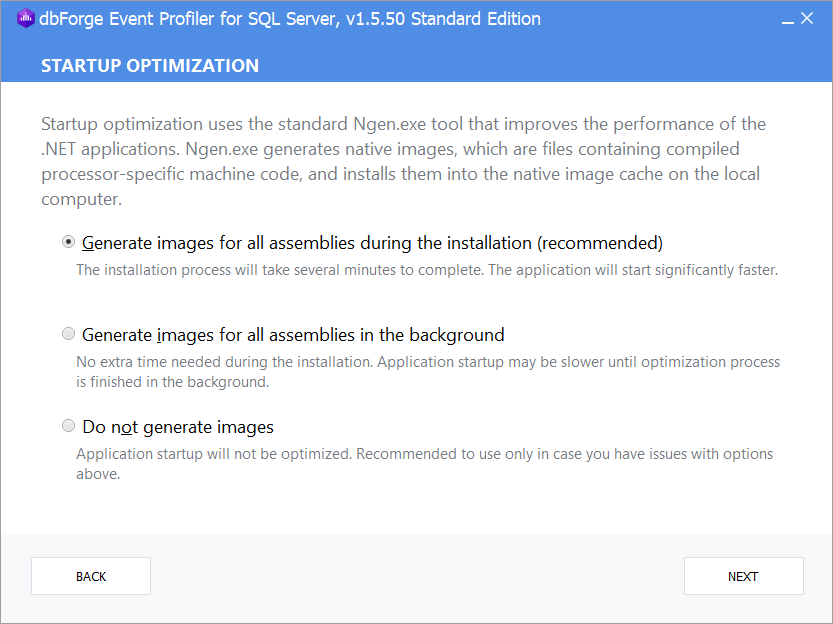
On the Startup Optimization page, review and select the best option for the tool performance utilization then click Next to proceed:
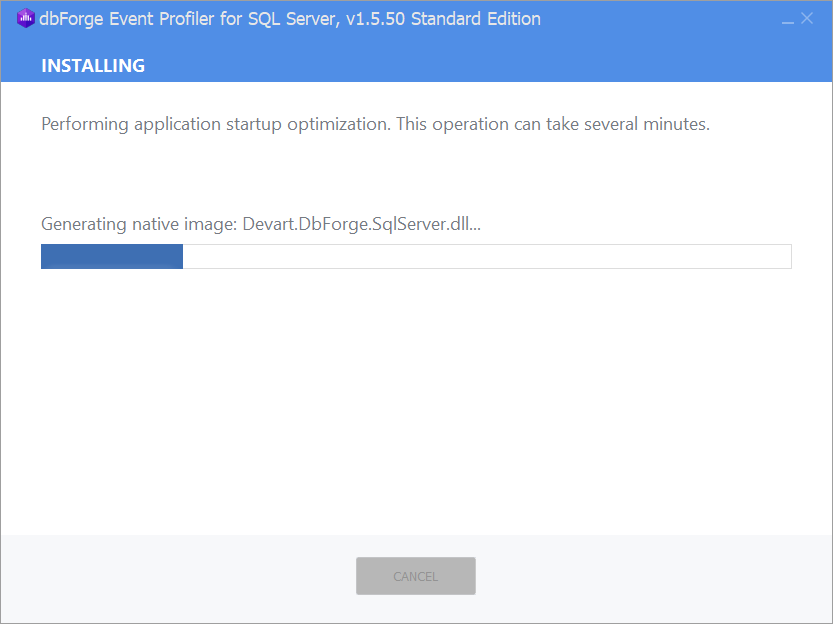
Now the installation process, based on your selections, will start, with the progress bar showing the status of the installation process, as shown below:
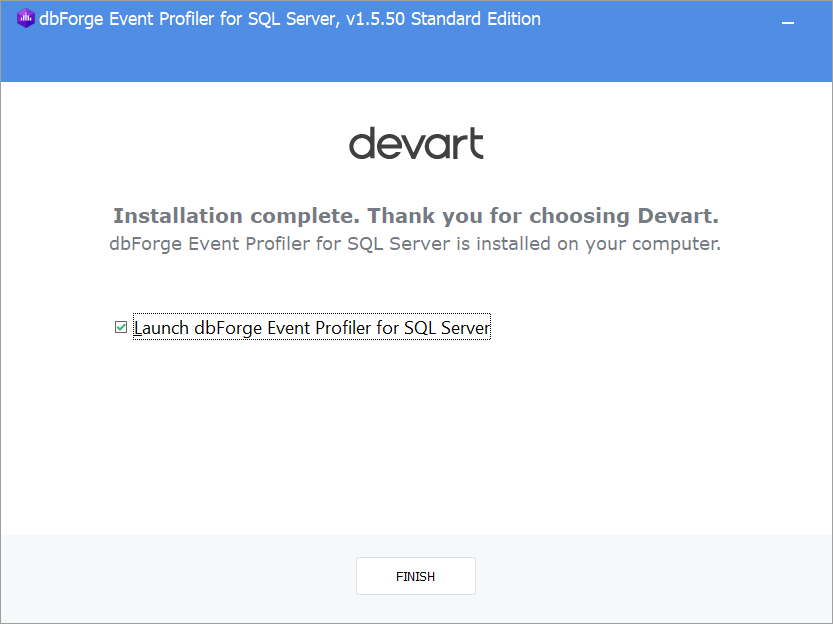
After dbForge Event Profiler for SQL Server installation has been completed successfully, the wizard will notify you and provide you with an option to start the tool directly after closing the installation wizard, as below:
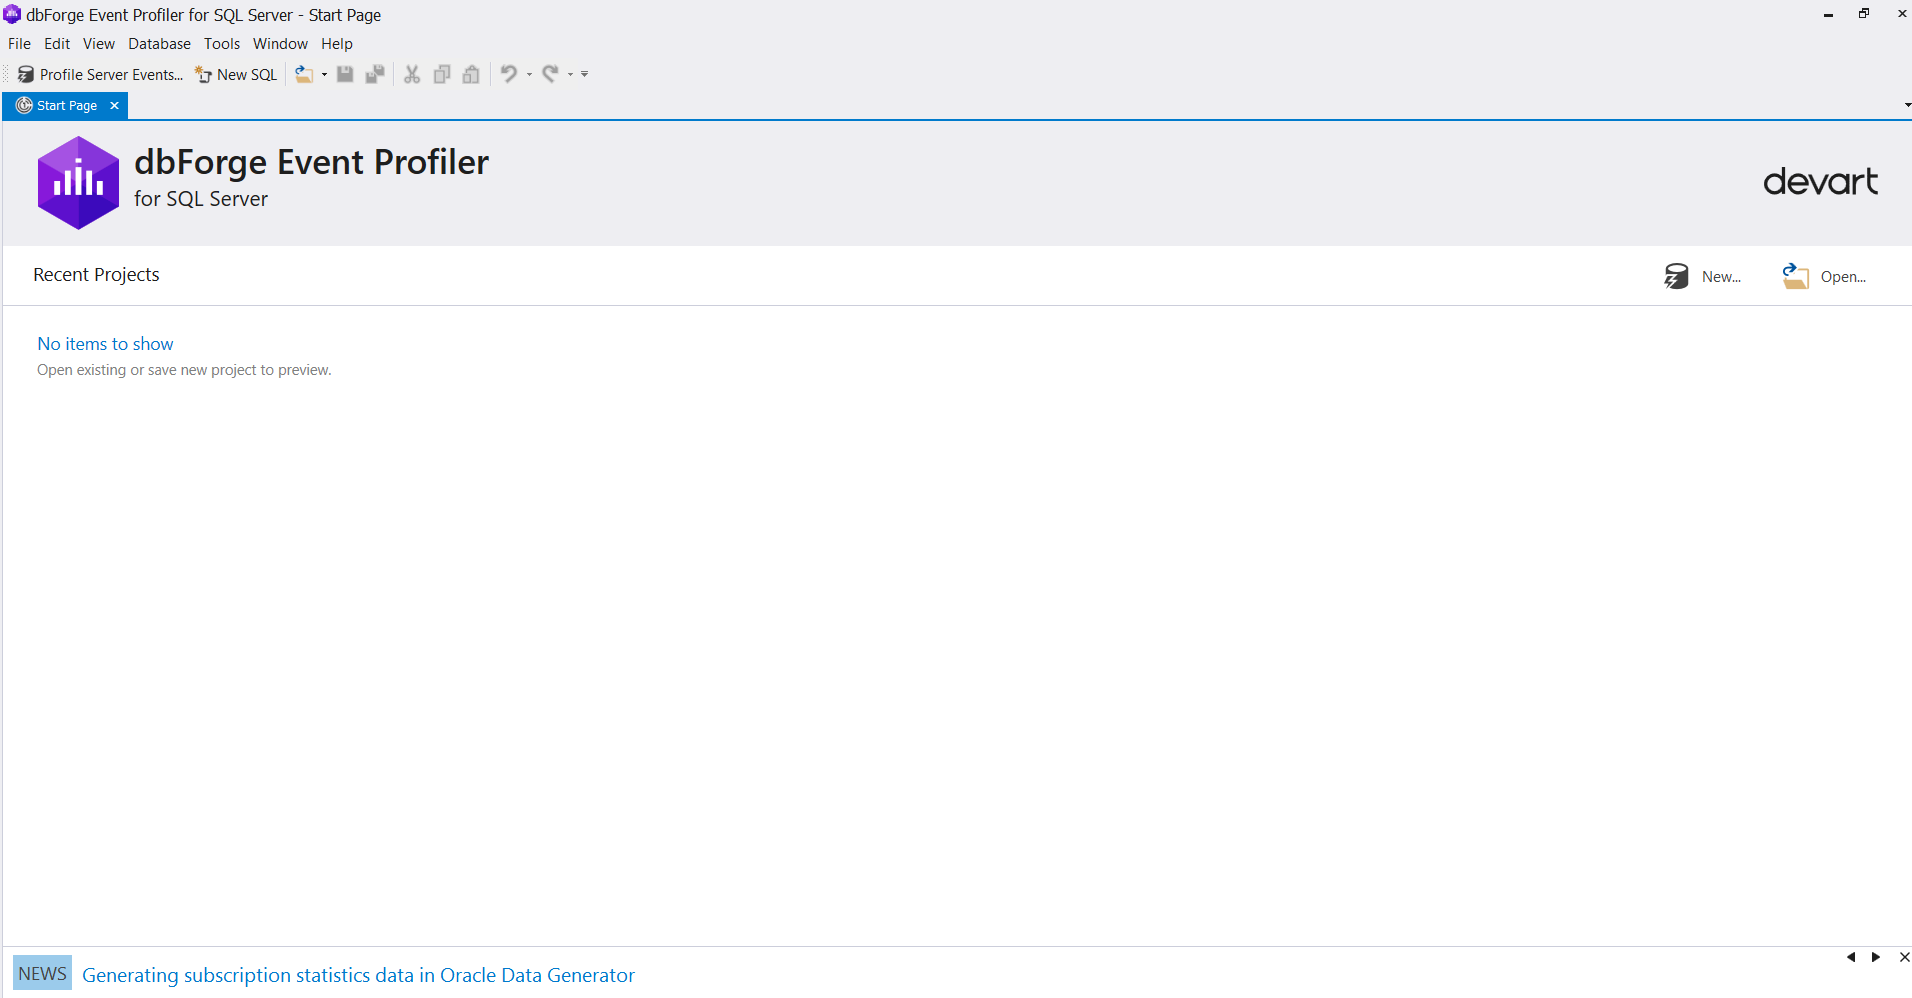
The welcome page of the dbForge Event Profiler for SQL Server is user-friendly and anyone familiar with SSMS can adapt easily to it. To start a new trace, click the New option at the right side of the tool, as below:
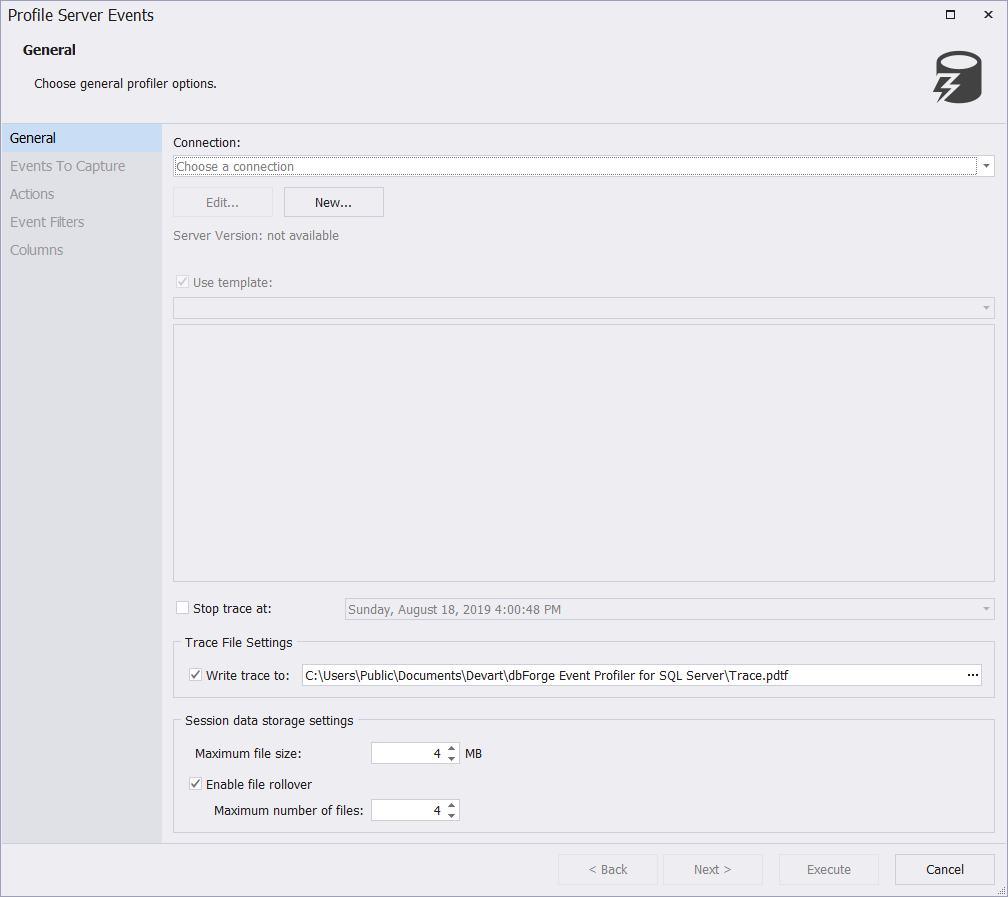
In the Profile Server Events window, you need to provide the connection information that will be used to connect to the SQL Server instance that will be monitored. If it is the first run for the tool and there is no previously saved connection, click the New connection button as shown below:
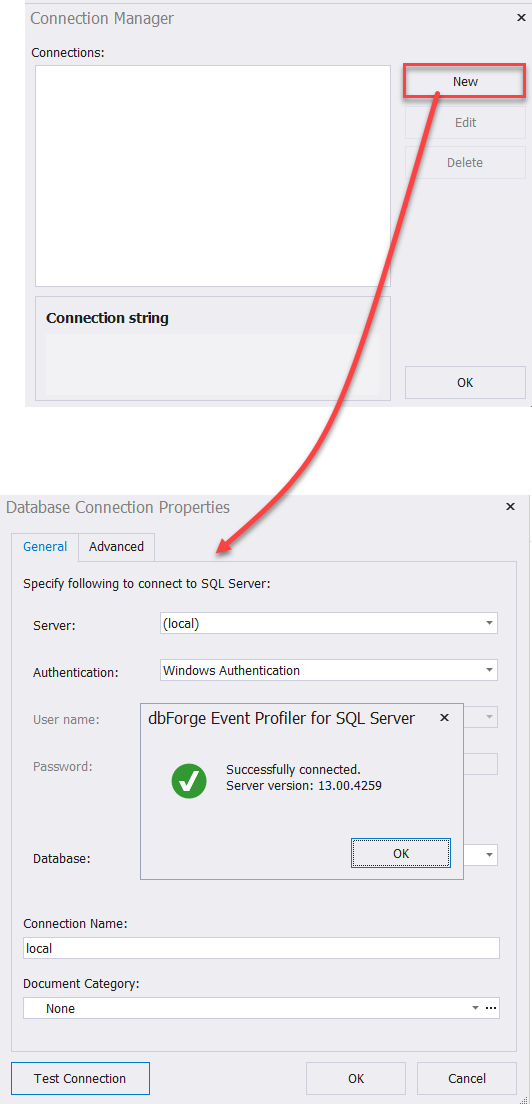
In the Connection Manager window, the New button will move you to the known connection window, where you will be requested to provide the SQL Server instance name, the authentication mode and the credentials required to connect to the SQL Server. After providing the connection information, click the Test Connection button to check if the information you’ve entered is valid, as shown below:
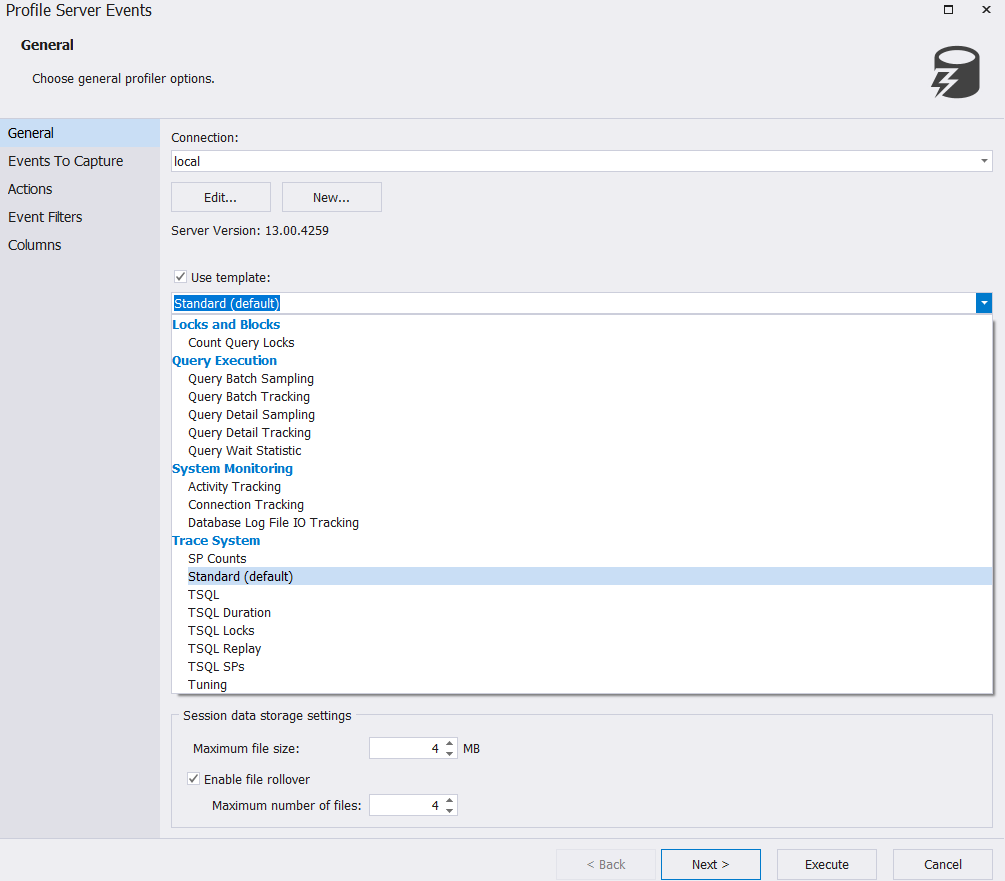
After providing the SQL Server instance connection information, select whether to use an existing template, from a list of useful templates that serve most of the tracing functionalities, or unselect it to specify the list of events you are interested to capture in the next step. Also, you can specify the destination file properties, as follows:
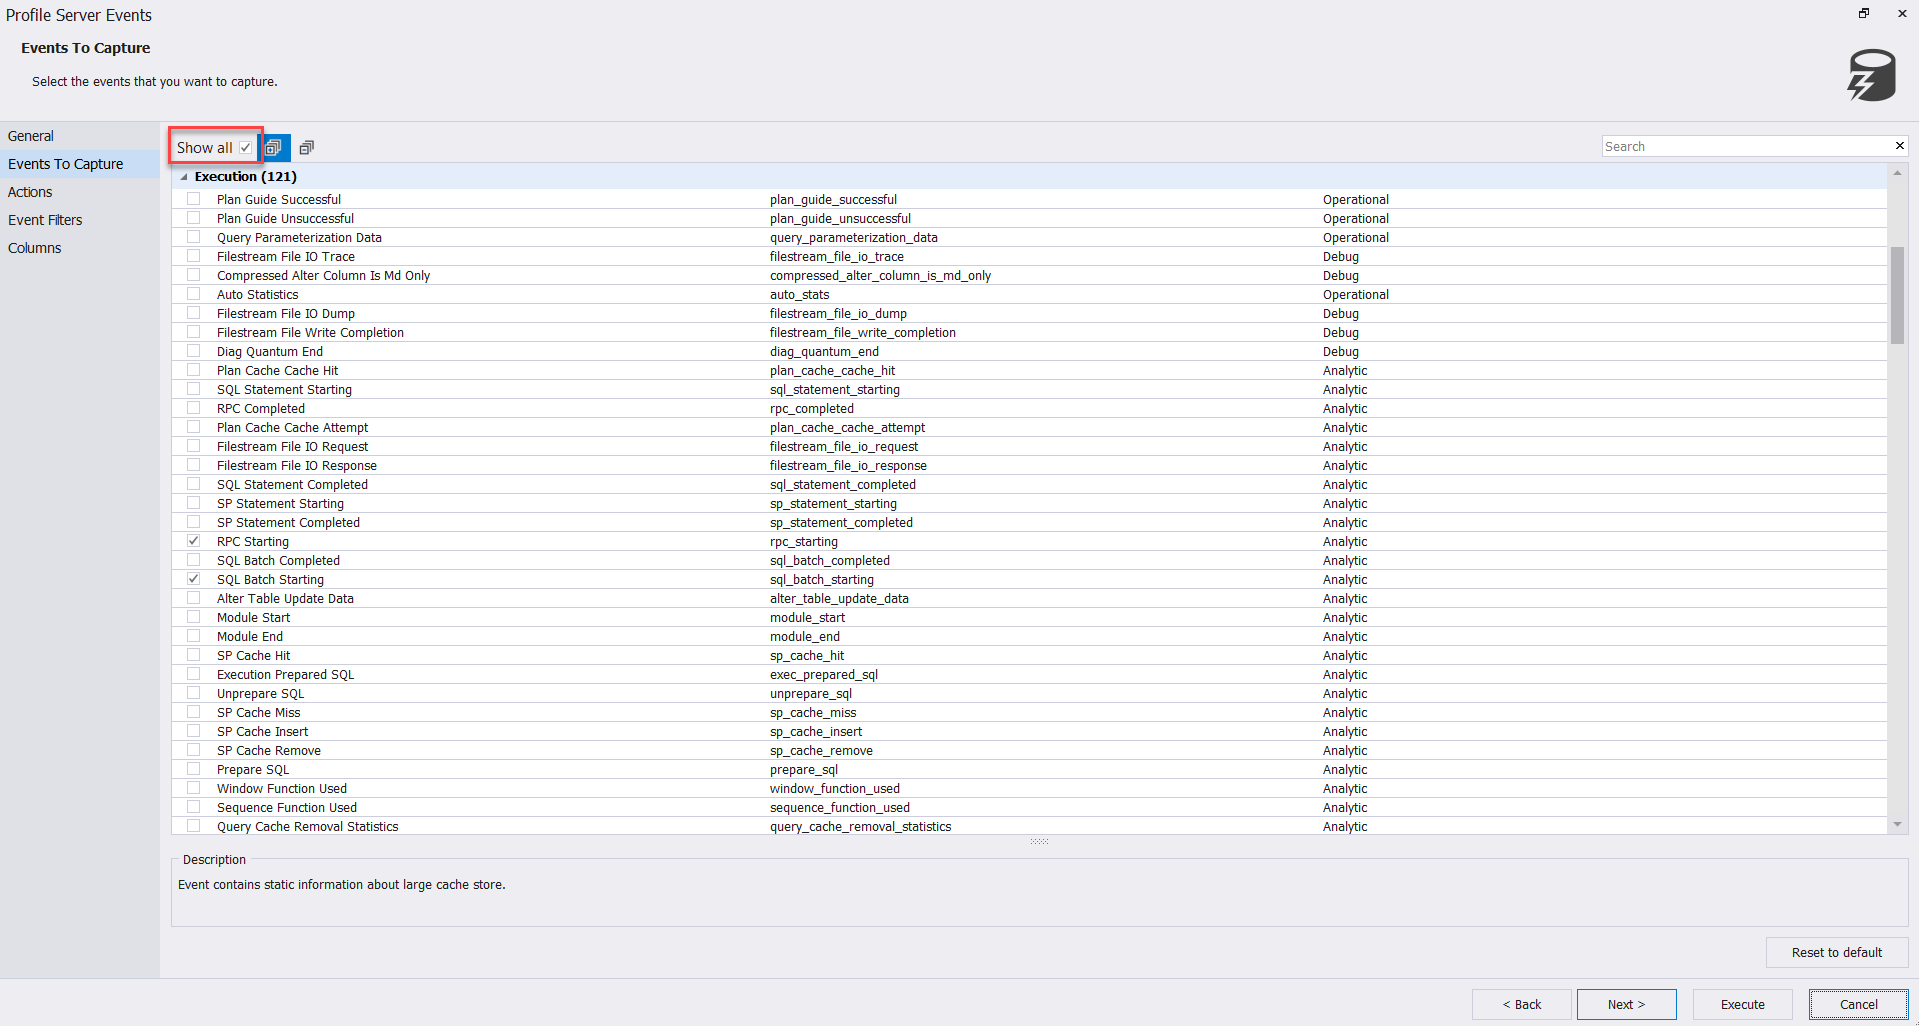
On the Events To Capture page, you will find a user-friendly and well-categorized list of events, that are described in a meaningful way, without the need to dive deeply and try to understand its meanings, as shown below:
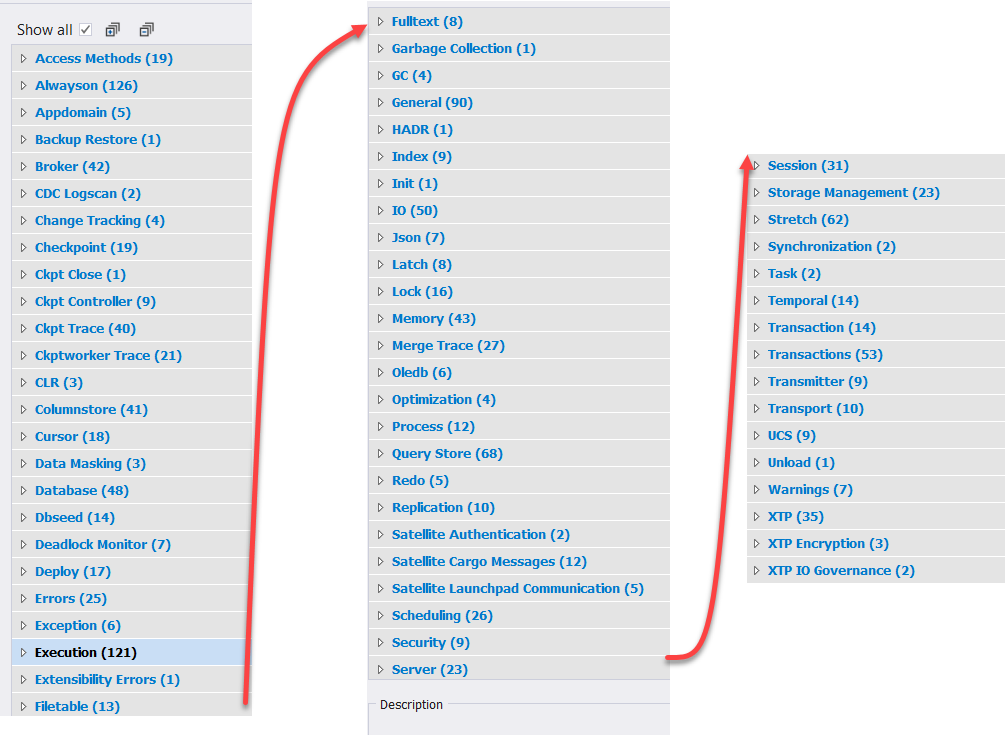
The below image also shows all available events categories, with the number of events in each category. Now, you can enjoy understanding all the available events by the name of the category, as shown clearly below:
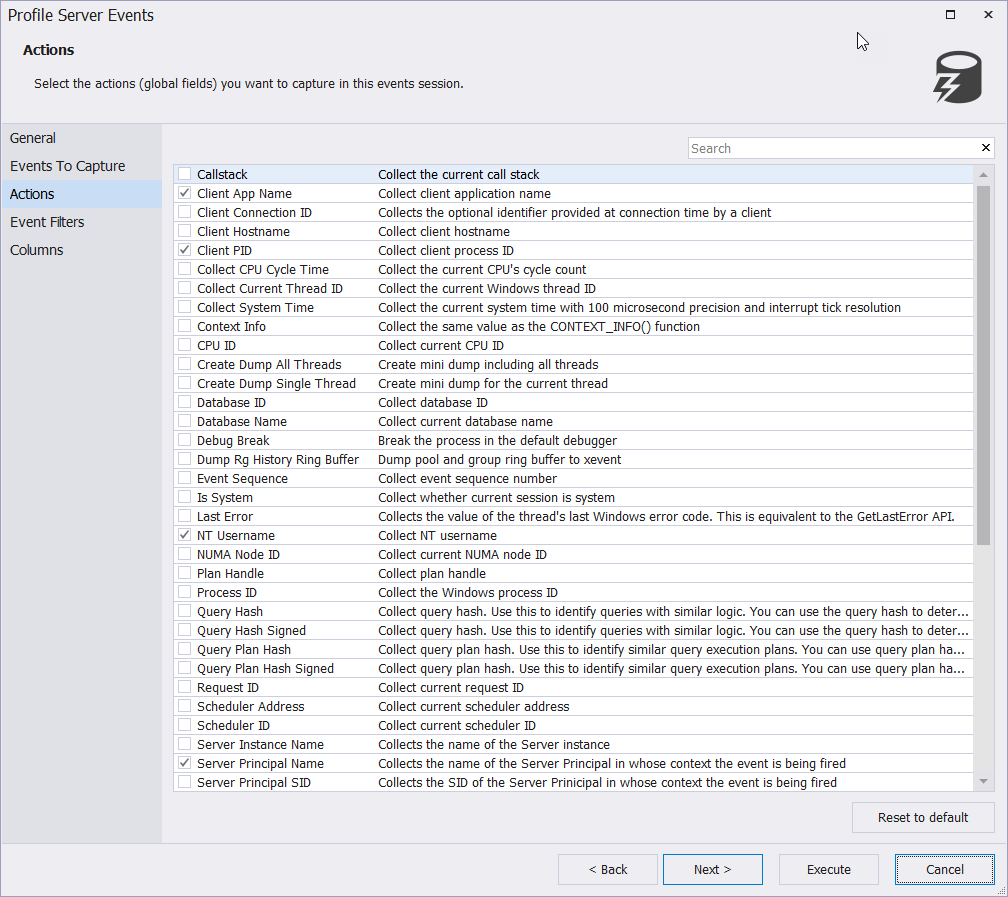
After specifying the list of events you are interested to capture, the Actions page provides you with the ability to specify the list of actions that you want to capture in the current event session, as shown below:
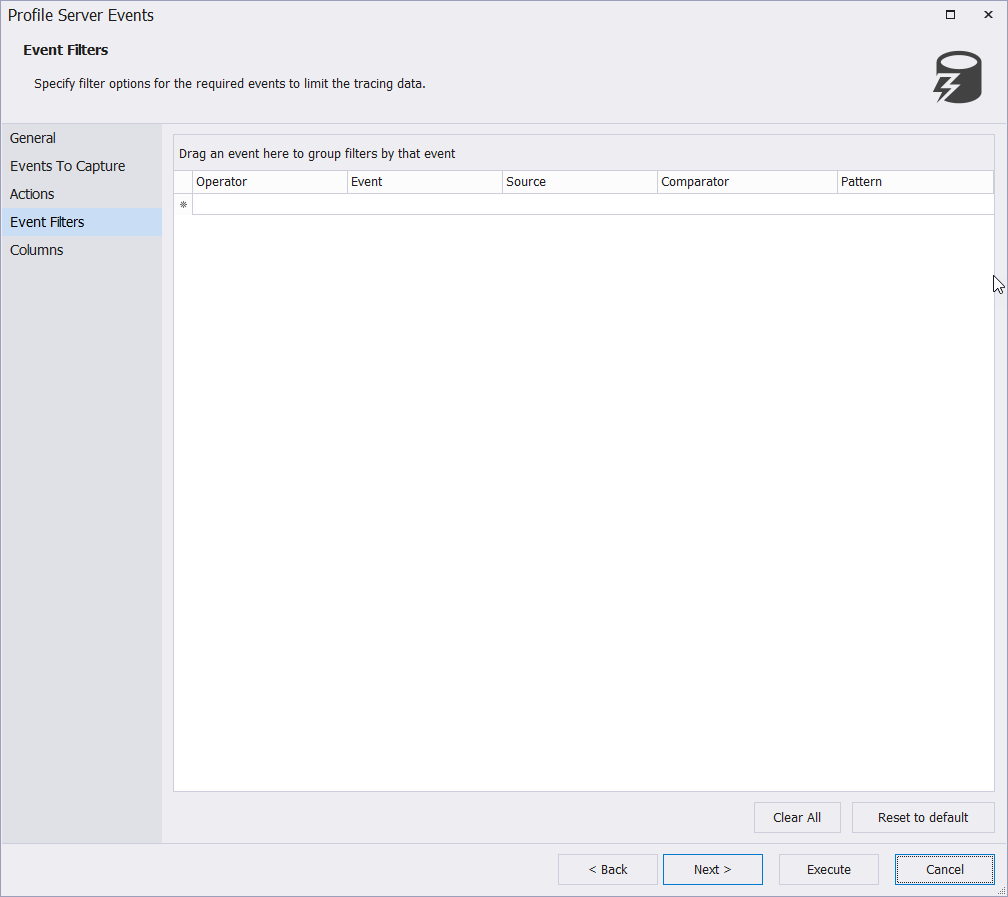
On the Event Filters page, you can also draw your own filters to minimize the number of collected rows to match your requirements and make it easier to analyze, as shown below:
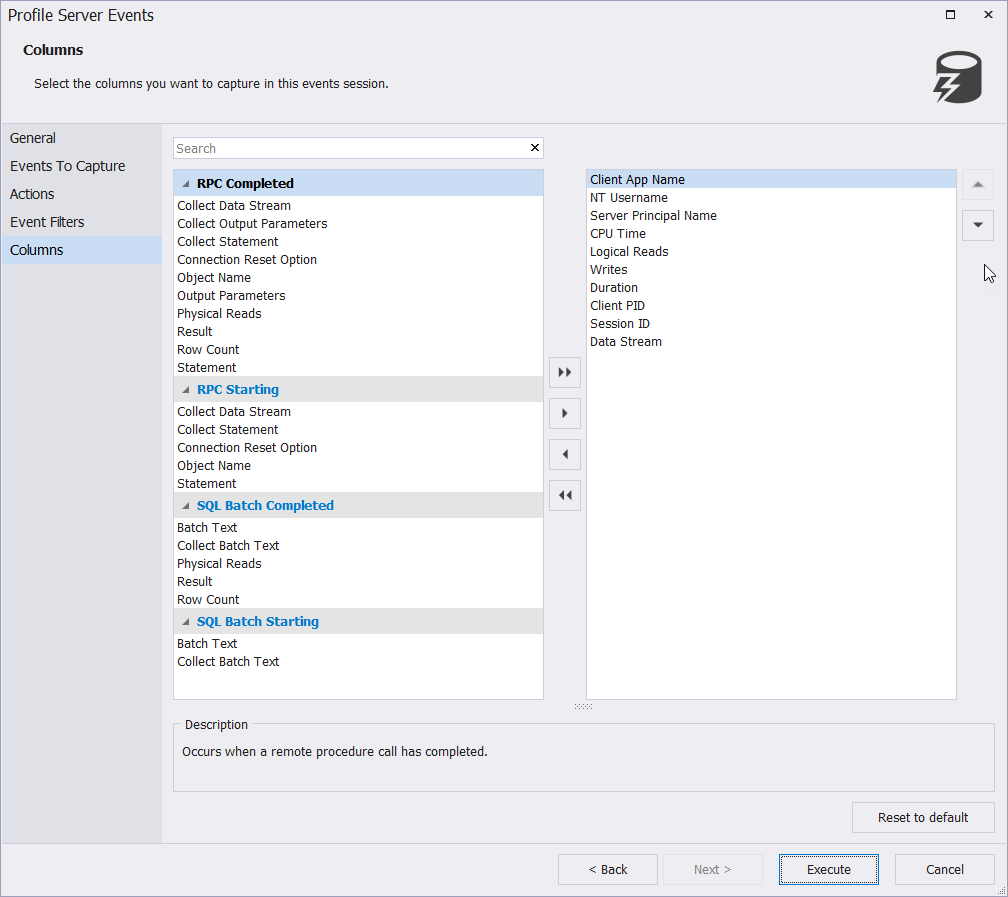
The Columns page allows you to specify which columns you plan to display in the current events session. Retrieving only the columns that contain the information you are interested to capture will help significantly minimize the size of the trace file and the width of the returned rows, which will make it easier to analyze the captured data, as shown below:
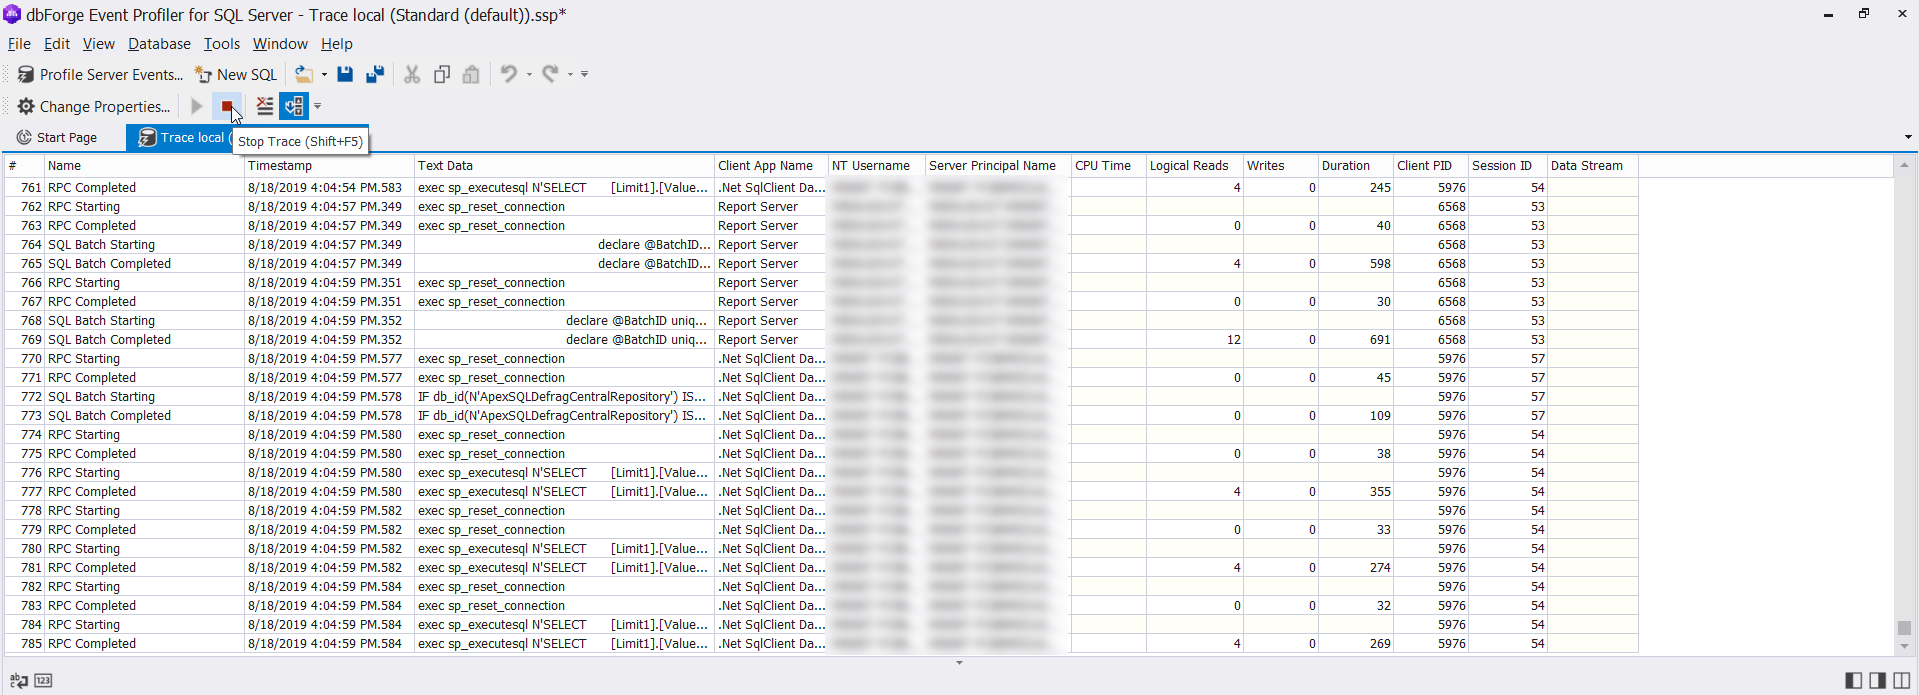
After customizing your event session, you can start capturing the events by clicking the Execute button from the previous image. After starting the events session, the tool will start capturing and displaying the events directly, as shown below:
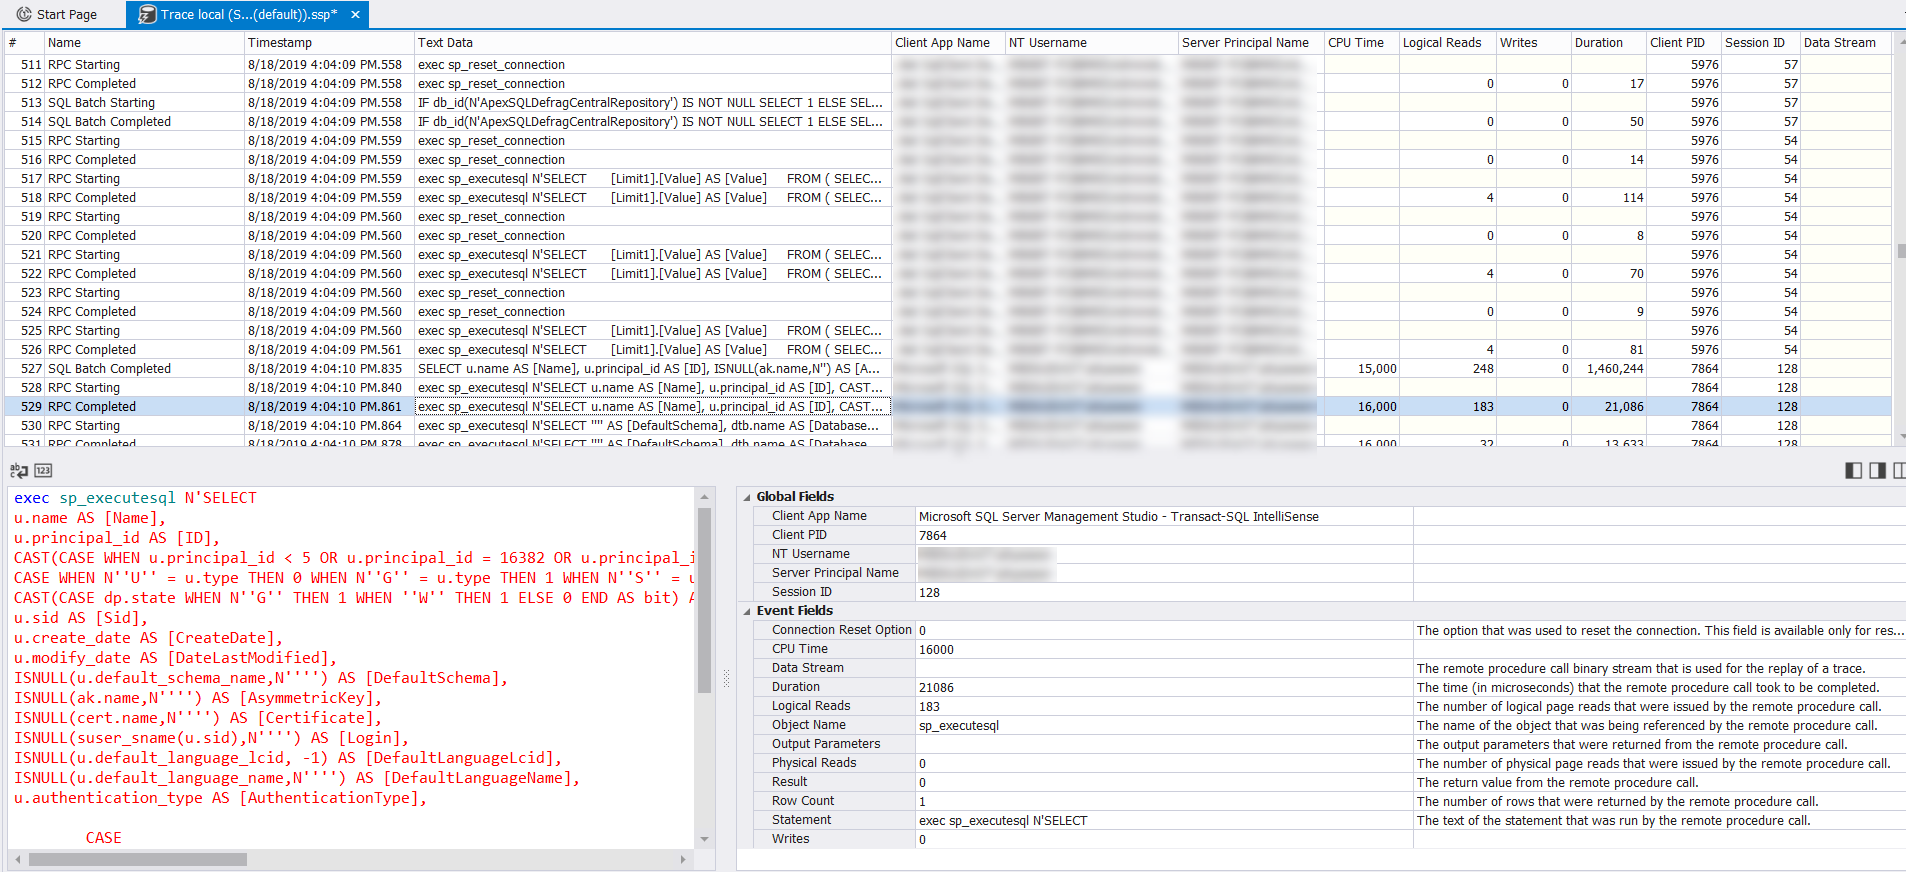
The great advantage here is that clicking any event will show a full description of it with the T-SQL script displayed in user-friendly colored font inside a separate box, that makes it very easy to check and analyze, as shown below:
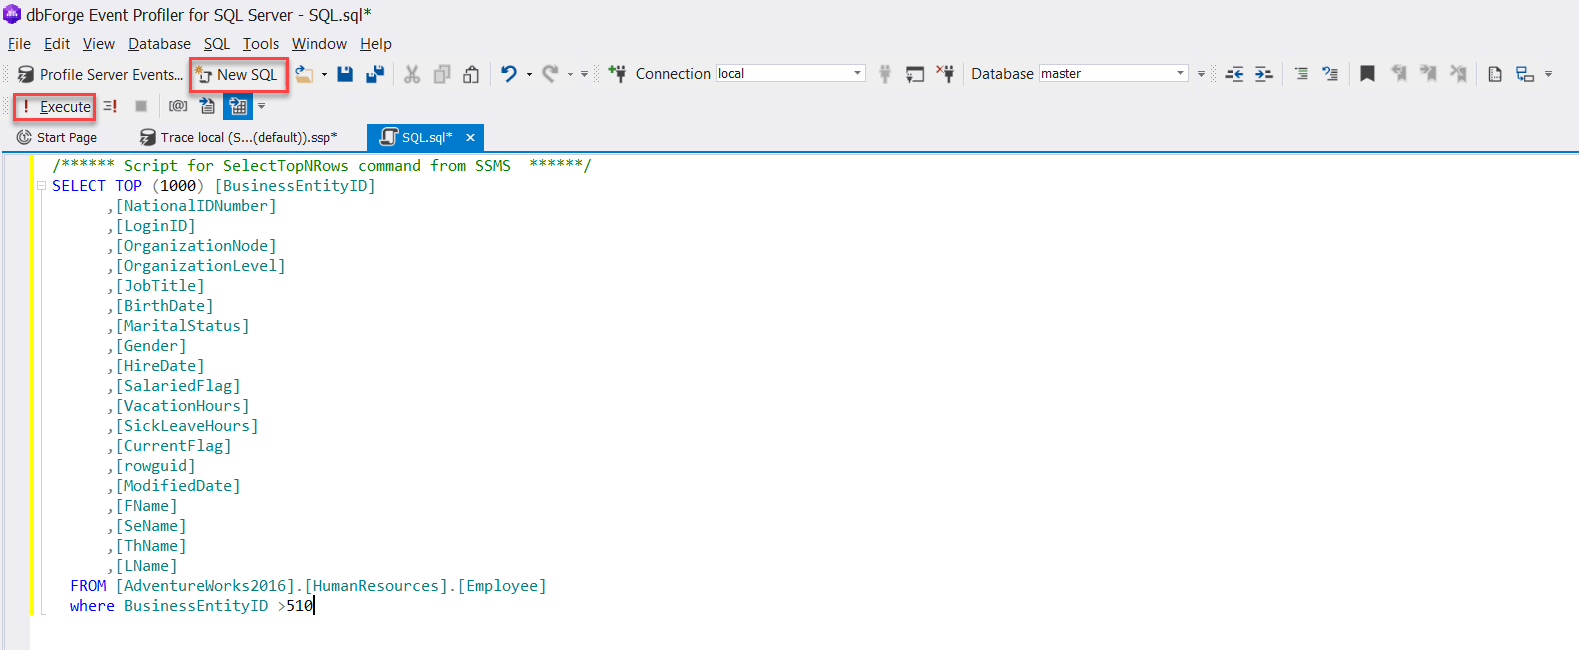
In addition, dbForge Event Profiler for SQL Server can work as SSMS by providing an option to write a new T-SQL query and execute it on the connected SQL Server instance, as shown below:
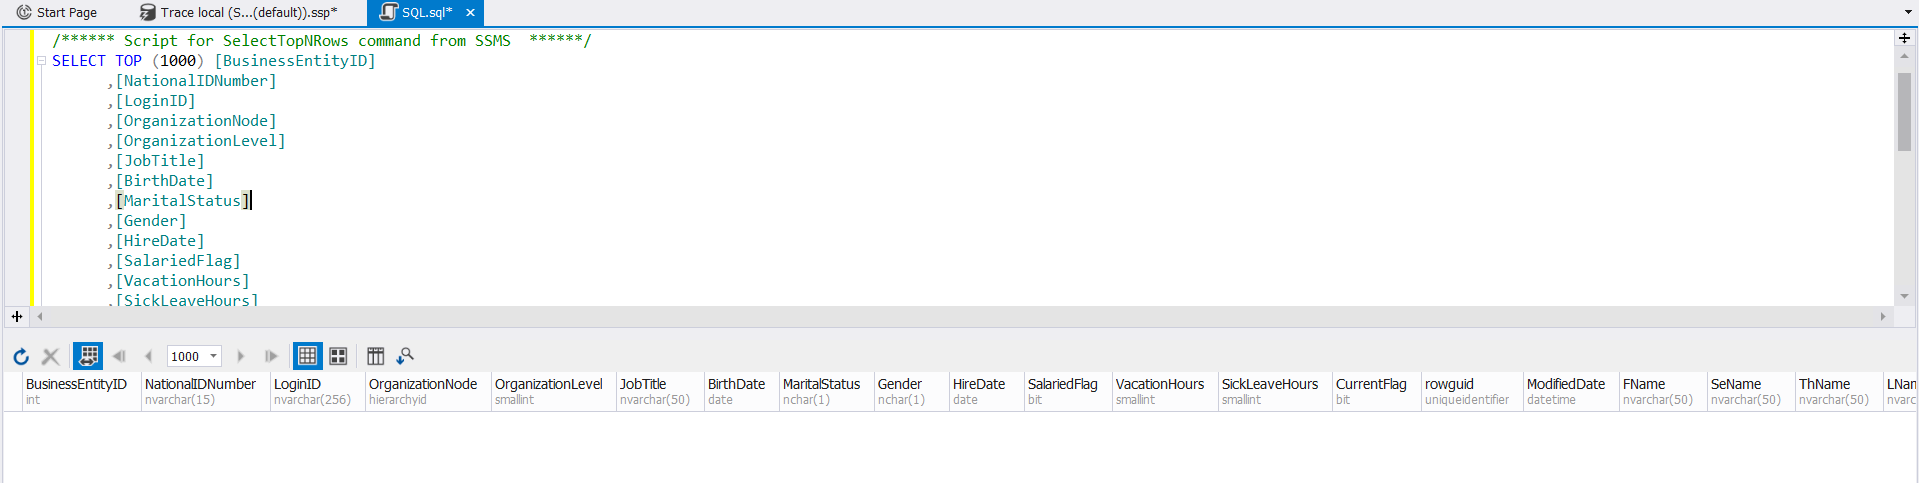
The tool also displays the returned data in a useful grid that shows each column name, data type, and value, as follows:
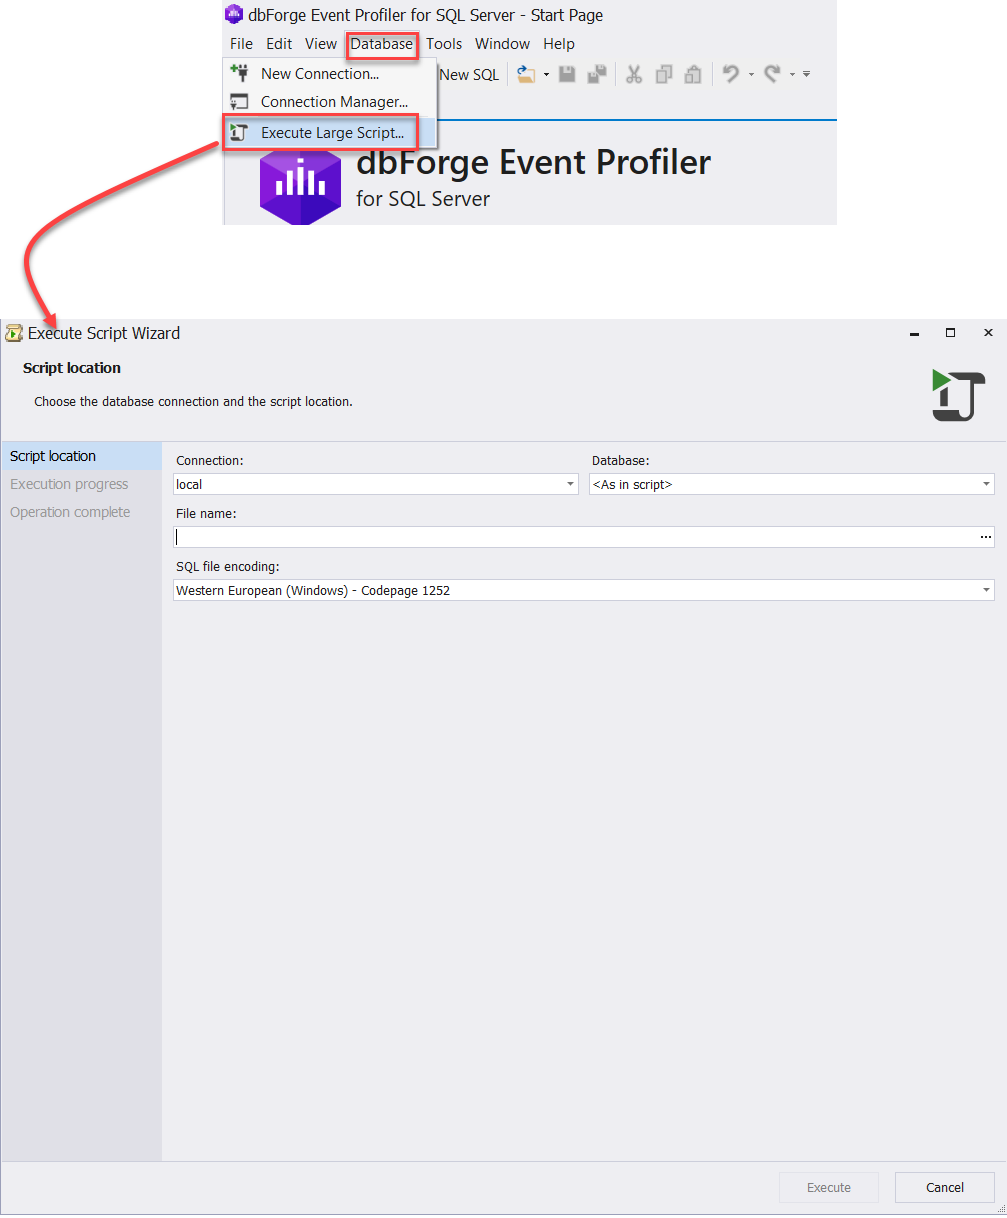
Most of the SQL Server database administrators encountered a situation when they tried to execute a large SQL Server file using SSMS that failed with OutOfMemory error. dbForge Event Profiler for SQL Server overcomes this issue by providing a feature to execute any large T-SQL script within a SQL file. What you need to do is only select the Execute Large Script option from the Database menu, then select the location for that script file, the database which this file will be executed on and the encoding that is used in that file, as shown clearly below:
Conclusion
From all the previous examples, you can see how the dbForge Event Profiler for SQL Server FREE 3rd party tool can be used to capture and analyze the different types of SQL Server events by overcoming all the drawbacks of the common events capturing tools. It is a FREE tool and it is definitely worth using.
Tags: database administration, sql server, tools Last modified: September 20, 2021