
Facing an SQL Server performance issue, you need to identify the source of that performance problem fast. Therefore, a tool for tracking the current workload and detecting the bottleneck issues without causing extra load is necessary.
SQL Server provides various tools to collect the SQL Server events. For instance:
- The SQL Trace tool, introduced in SQL Server 2000. It lets you define classes of events you plan to collect with many T-SQL stored procedures. You can collect certain events using the SQL Profiler or call it from the code. But the latter required specific development skills and effort.
- The SQL Server Profiler tool. You can use it to collect performance-related events, detect expensive queries, and enhance performance. It allows collecting variant numbers of SQL Server events and filter them according to your scenario variables.
- The SQL Server Extended Events tool, a light-weight event tracking tool, was introduced in SQL Server 2008 and enhanced in SQL Server 2012. It allows you to create and configure an Extended Events session, consisting of many predefined events. The tool targets performance-related events and issues, thus replacing deprecated SQL Trace and SQL Profiler tools.
The built-in profiling tools produce different impacts on your production environment when you configure them to collect SQL Server events. Besides, setting up and configuring these tools require development skills quite often. For instance, setting up the SQL Trace scenario is such a task.
All these tools require at least installing the SQL Server Management tools. The problem is, it might not be an option for some environments for security reasons. Such tools are applicable to connect to the SQL Server instance and retrieve the data.
Fortunately, the SQL Server administration tools market provides numerous options for SQL Profiling tools. One of the most useful and FREE SQL tracing tools is the free dbForge Event Profiler for SQL Server tool.
Using the dbForge Event Profiler for SQL Server tool for tracing events
This FREE solution lets you capture and analyze the SQL Server resources consumption and expensive queries-related events. You can store these data in a physical trace file for later troubleshooting and analysis. It also allows you to view all sessions running on your SQL Server and the queries executed under these sessions. In general, the Event Profiler applies to more than 1500 traceable events.
The dbForge Event Profiler helps define the application, node, or user with the heaviest running activity. It identifies the T-SQL statement or stored procedure with the worst performance and impact on the SQL Server, tracking the SQL Server resource consumption. It’s also worth mentioning the ability to collect events related to the SQL Server Analysis and Integration Services.
Compared to other SQL Server built-in profiling tools, the dbForge Event Profiler guarantees the highest tracer performance with the lowest server overload. You can download the application free of charge from the Devart download page and install to your machine:
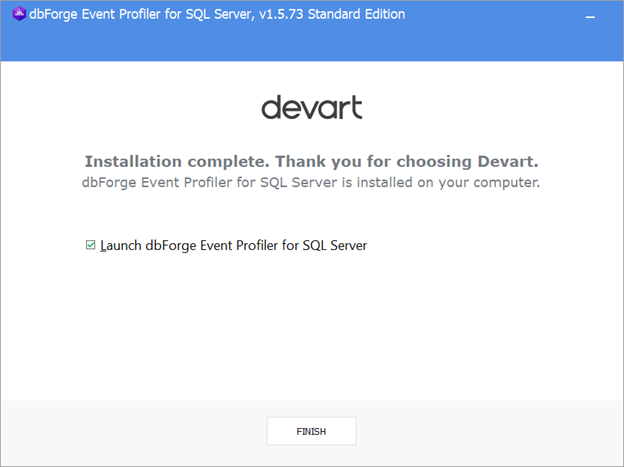
When the installation is complete successfully, the wizard will notify about it and allow you to launch the Event Profiler tool at once:
Configuring the dbForge Event Profiler for SQL Server tool
The tool has a user-friendly, simple interface, and robust functionality:
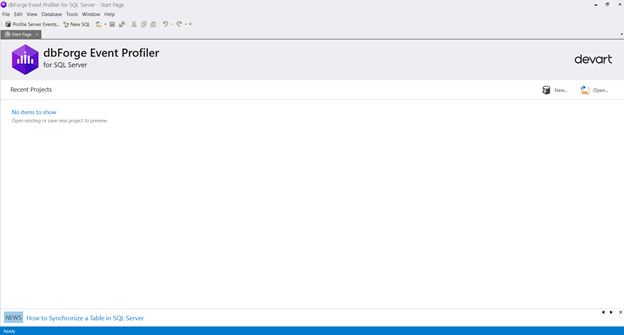
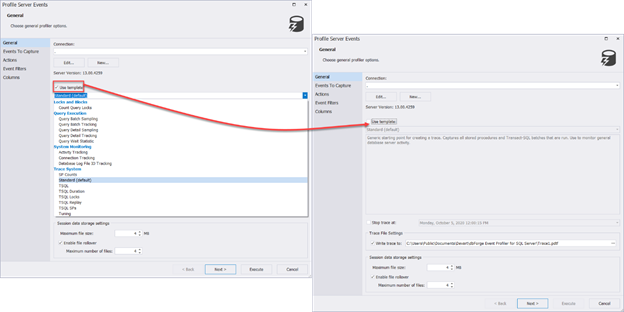
To start the event capturing project, click on the New option. It launches the Profile Server Events wizard.
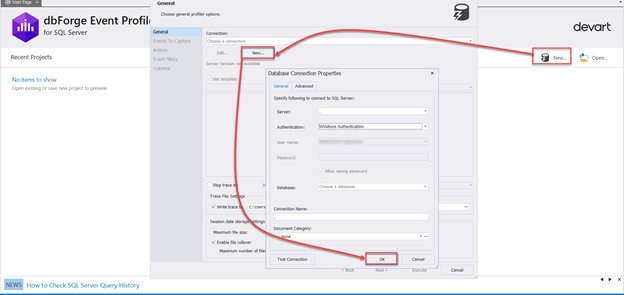
Select an existing connection from the previously used connections, or enter the name of an SQL Server instance, the authentication method, and credentials to establish connection:
Once connected to the SQL Server instance, you select an events template from the library. Each template consists of several events to serve a specific troubleshooting or performance tuning goal. You will see the list of events to capture at the Events To Capture page. Add or remove these events according to the tracing requirements.
From the same General page, you can provide the date and time to stop the event tracing process. It suits the scenario where you run the tool and let it stop automatically.
You can also change the default path for saving the generated physical trace file, the maximum trace file size, and the maximum number of files. Then you can rollover the generated files, as shown below:
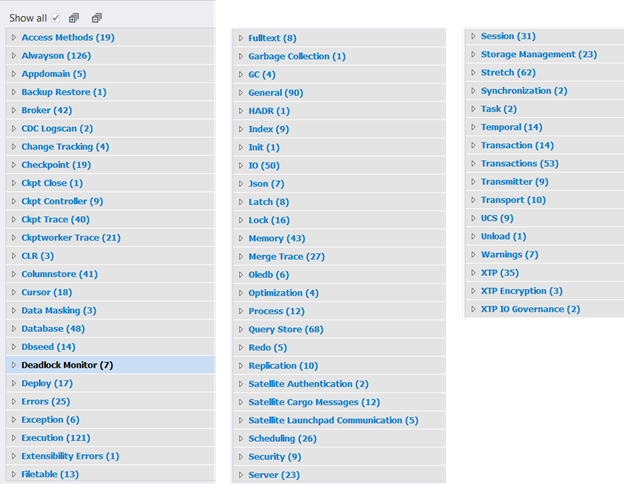
In case you don’t work with templates, compile the list of captured events manually. 1500+ events are available in the dbForge Events Profiler. Uncheck the templates option, and proceed to the next page to select the events you want to capture.
All these events are grouped under categories:
If you already know which event name you plan to capture, you can find it faster using the “search” option. Enter the event name into the search bar:
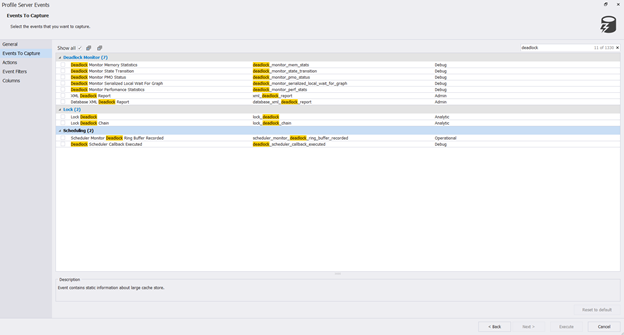
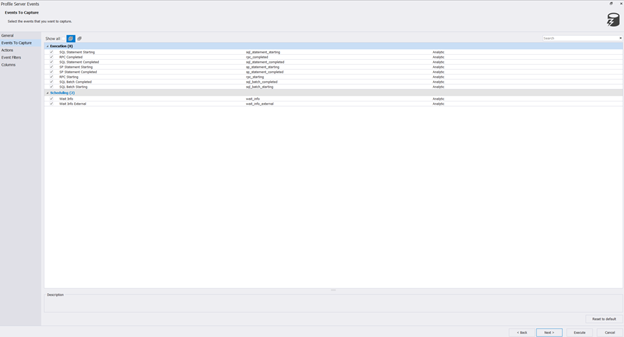
After checking all events to capture in the trace session, click Next to proceed:
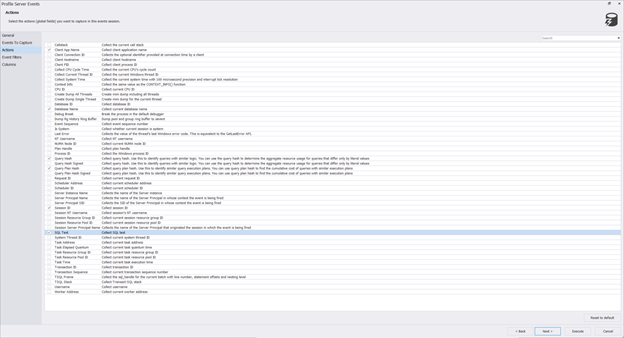
Under the Actions page, select the list of fields to capture in the event sessions:
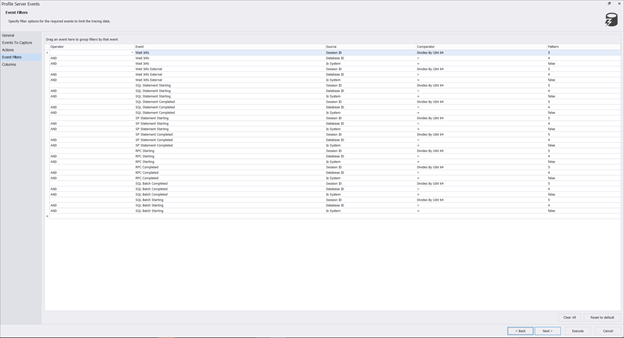
The dbForge Events Profiler tool offers a flexible “events” filter for each captured event. Use different operators, comparators, and patterns to control the filtering condition:
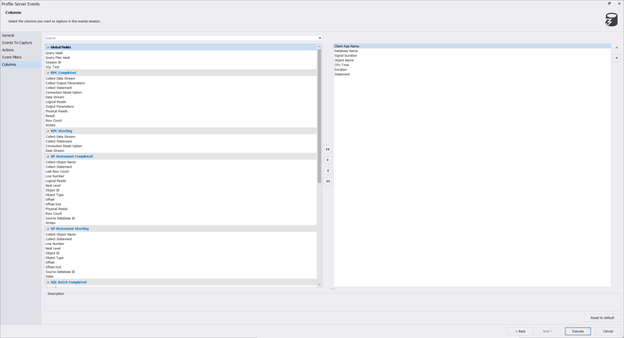
Finally, select the list of columns to capture in the events session.
When you finish customizing the events session, click Execute to start capturing specified events:
The dbForge Event Profiler tool starts to capture the events meeting the configured filters immediately.
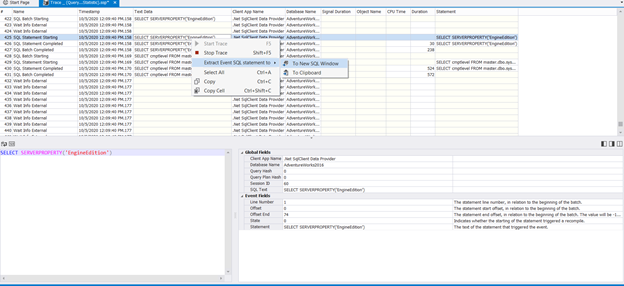
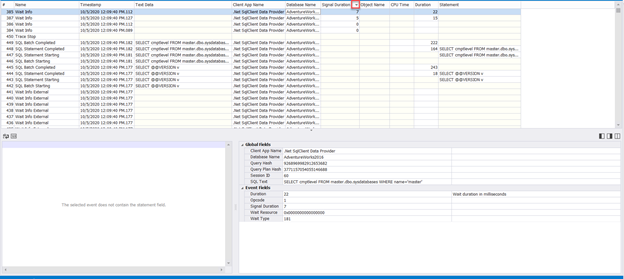
It generates a detailed event tracing session with useful information about each captured event and its statistics. The query texts are in separate grids, with the ability to extract a T-SQL query running under the captured event to a separate window:
When it captures all target events, you can stop the trace and filter the values returned from each captured column:
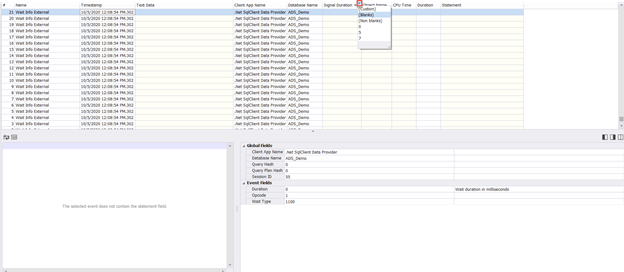
With the possibility of sorting values in each column, ascending or descending, you can analyze the captured events statistics, as shown below:
Recall that the captured events trace is already stored in a physical trace file. Thus, you can perform troubleshooting and analysis later.
Conclusion
The dbForge Event Profiler tool makes the events capturing process much more manageable. The configuration is intuitive and straightforward, and the automation options let you run and stop the sessions when you need it. You get detailed stats for the performance tuning and troubleshooting tasks.
See also
Watch this video to learn how you can use a trace file to find and troubleshoot SQL Server deadlocks.