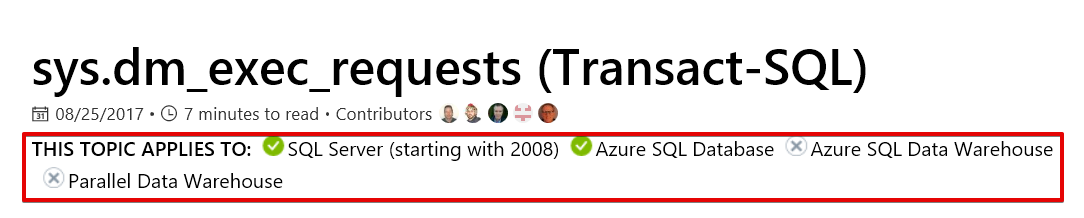
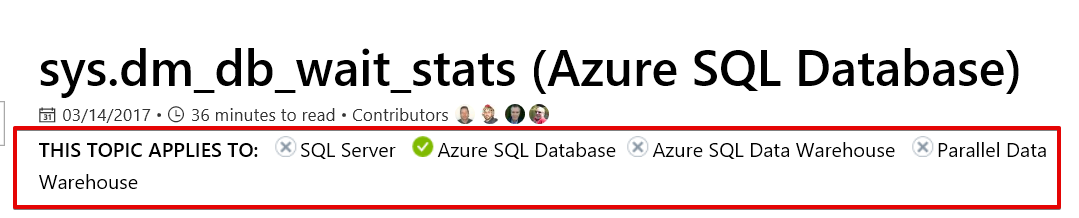
Performance monitoring and troubleshooting in SQL Server is a vast topic. In SQL Server 2005, dynamic management views, also known as DMV’s, have been introduced and became an essential helping tool for diagnosing SQL Server performance problems. At the same time, we can use dynamic management views for Azure SQL Database. Some of them can differ from SQL Server on-premise database but the logic of work is still the same. Microsoft has very good documentation about dynamic management views. The only thing, you need to be careful about the version and product validation of dynamic management views. Such as sys.dm_exec_request is available for SQL Server 2008 and later versions and for Azure SQL database but sys.dm_db_wait_stats is valid only for Azure SQL database.
In this post, we will talk about the basics of the sys.dm_exec_request. sys.dm_exec_requests is a dynamic management view which returns only the currently executing requests. It means that when you run sys.dm_exec_requests query, it snapshots request which is running in that time and does not include any historical data. Therefore, this view is very handy for monitoring real-time requests. In other words, it gives the answer to “what is going on in my server just now?” This view includes a lot of details but we will discuss the most important ones.
session_id: This value defines a session identification number. In SQL Server, session IDs which are equal to or less than 50 are dedicated to the background process.
start_time: This value defines the start date and time of the request.
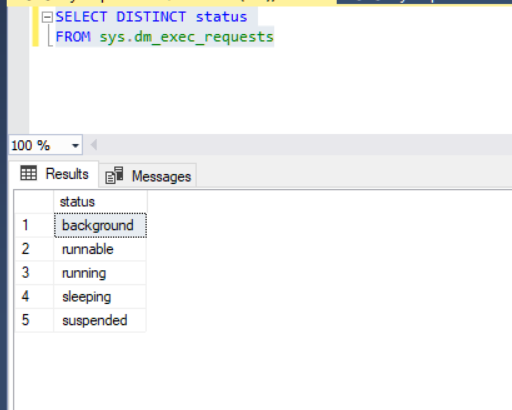
status: This value defines a status of the request. The available statuses are:
- background
- running
- runnable
- sleeping
- suspended
SELECT DISTINCT status
FROM sys.dm_exec_requests
WHERE session_id <>@@SPID
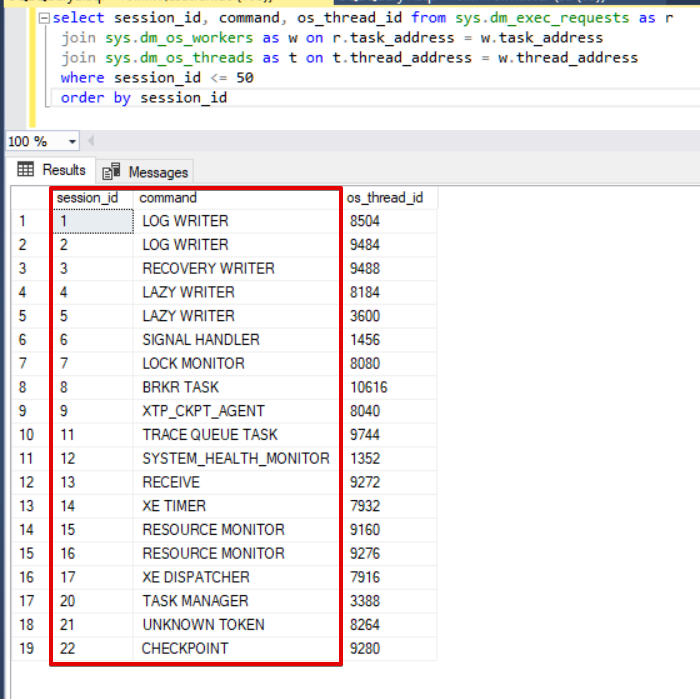
background: This status type defines the background processes. Some of them are LAZY WRITER, CHECKPOINT, and LOG WRITER.
select session_id, command, os_thread_id from sys.dm_exec_requests as r
 join sys.dm_os_workers as w on r.task_address = w.task_address
 join sys.dm_os_threads as t on t.thread_address = w.thread_address
 where session_id <= 50
 order by session_id
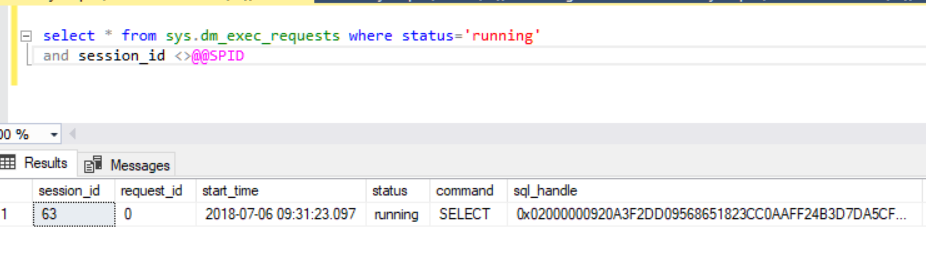
running: This status type defines that request is processing by CPU.
 select * from sys.dm_exec_requests where status='running'
 and session_id <>@@SPID
runnable: This status type can be simply defined as a request which is waiting in the CPU queue for running. If you detect a lot of runnable process in sys.dm_exec_requests, it can be a symptom of CPU pressure. This metric is not enough to diagnose this CPU performance issue. Because of this reason, we need to support this case with more evidence. This is significant for us to prove our theory. The sys.dm_os_wait_stats dynamic management view includes a column which is signal_wait_time_ms. This column value can be an assist to determine the CPU issue. The following query shows us the percentage of Signalwait. If this metric has a high value, most probably you are facing a CPU performance problem. You can deepen your review in this way.
---https://sqlserverperformance.wordpress.com/page/146/
---Glenn Berry's SQL Server Performance

SELECT signal_wait_time_ms=SUM(signal_wait_time_ms)
              ,'%signal (cpu) waits' = CAST(100.0 * SUM(signal_wait_time_ms) / SUM (wait_time_ms) AS NUMERIC(20,2))
              ,resource_wait_time_ms=SUM(wait_time_ms - signal_wait_time_ms)
              ,'%resource waits'= CAST(100.0 * SUM(wait_time_ms - signal_wait_time_ms) / SUM (wait_time_ms) AS NUMERIC(20,2))
FROM sys.dm_os_wait_stats;
suspended: This status type defines the waiting process of some resource. It can be I/O, LOCK, and LATCH etc. As mentioned above, we can use the sys.dm_os_wait_stats dynamic management view to detect wait_time_ms.
sleeping: It means that the request is connected to SQL Server but not currently running any commands.
command: This column defines a type of command which is being executed. At the same time, we can find additional information for particular commands which is a completion ratio. According to the online books, these are;
ALTER INDEX REORGANIZE
AUTO_SHRINK option with ALTER DATABASE
BACKUP DATABASE
DBCC CHECKDB
DBCC CHECKFILEGROUP
DBCC CHECKTABLE
DBCC INDEXDEFRAG
DBCC SHRINKDATABASE
DBCC SHRINKFILE
RECOVERY
RESTORE DATABASE
ROLLBACK
TDE ENCRYPTION
Demo:
- Connect the master database and start the backup for any database.
BACKUP DATABASE WideWorldImporters TO DISK ='NUL'
Tip: When you take the database backup to the “NUL” device, SQL Server does not write a backup file anywhere and you avoid the deletion of a test backup file. But don’t use this command in your production environment. It can cause to break the LSN chain.
Execute the following query:
SELECT command,percent_complete ,*
FROM sys.dm_exec_requests
WHERE session_id <>@@SPID
and session_id>50 and command='BACKUP DATABASE'
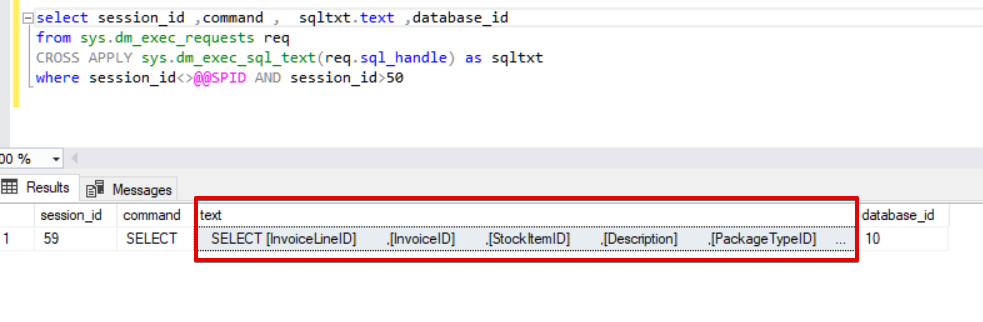
sql_handle: This value defines the SQL statement of the request. But this value is in the bitmap format. For this reason, we need to use the sys.dm_exec_sql_text table-valued function to convert the value into meaningful text.
select session_id ,command , sqltxt.text ,database_id
from sys.dm_exec_requests req
CROSS APPLY sys.dm_exec_sql_text(req.sql_handle) as sqltxt
where session_id<>@@SPID AND session_id>50
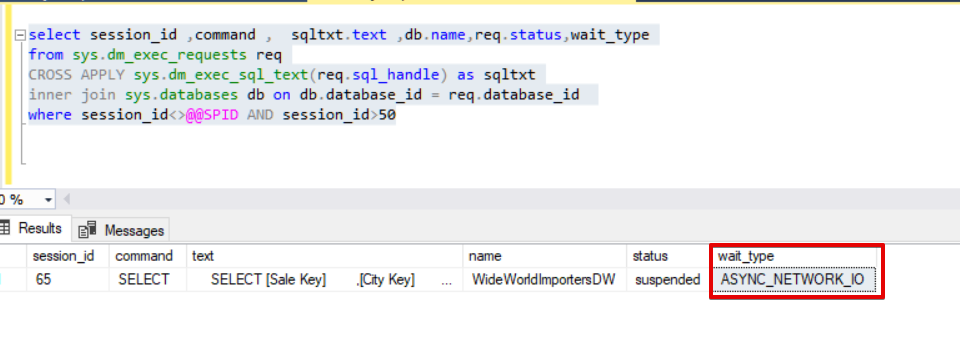
database_id: This value defines which database makes the request. We can join this field with sys.databases to get the database name.
select session_id ,command , sqltxt.text ,db.name
from sys.dm_exec_requests req
CROSS APPLY sys.dm_exec_sql_text(req.sql_handle) as sqltxt
inner join sys.databases db on db.database_id = req.database_id
where session_id<>@@SPID AND session_id>50
wait_type: This value defines the current wait type of the request. If the duration of the query execution takes longer than expected, you can check and determine the wait type of query.
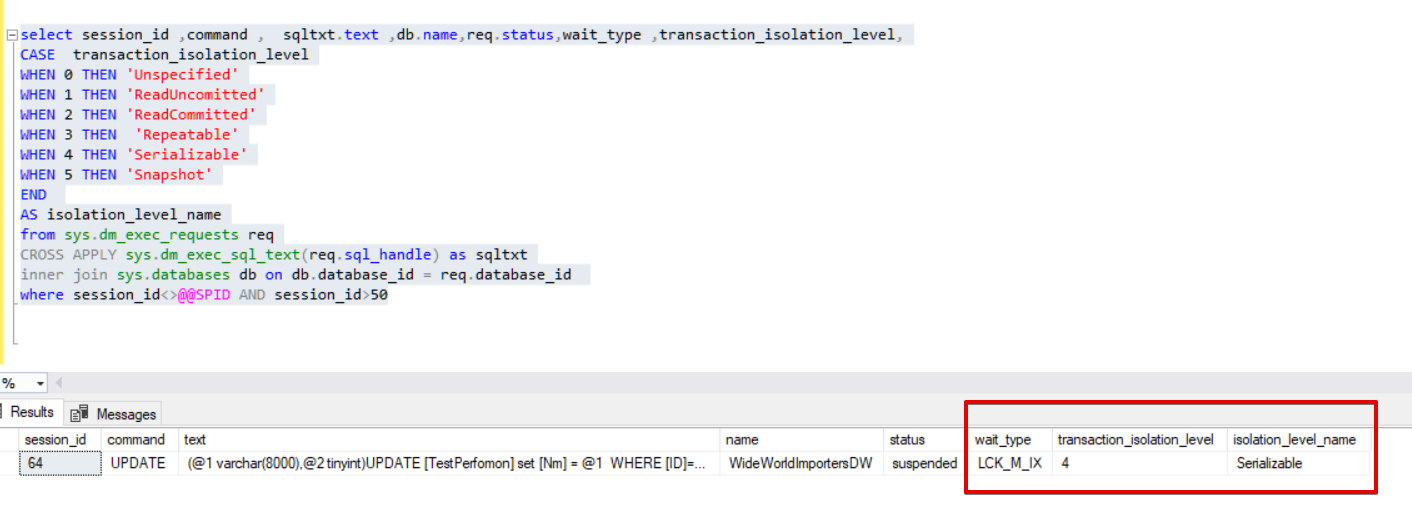
transaction_isolation_level: This value defines the transaction level of the submitted query:
0=Unspecified
1=ReadUncomitted
2=ReadCommitted
3=Repeatable
4=Serializable
5=Snapshot
select session_id ,command , sqltxt.text ,db.name,req.status,wait_type ,transaction_isolation_level,
CASE transaction_isolation_level
WHEN 0 THEN 'Unspecified'
WHEN 1 THEN 'ReadUncomitted'
WHEN 2 THEN 'ReadCommitted'
WHEN 3 THEN 'Repeatable'
WHEN 4 THEN 'Serializable'
WHEN 5 THEN 'Snapshot'
END
AS isolation_level_name
from sys.dm_exec_requests req
CROSS APPLY sys.dm_exec_sql_text(req.sql_handle) as sqltxt
inner join sys.databases db on db.database_id = req.database_id
where session_id<>@@SPID AND session_id>50
blocking_session_id: It is the id of the session which is blocking the request. If this column is NULL, the request has not blocked any session.
Demo:
- Open SQL Server Management Studio and execute the following query.
DROP TABLE IF EXISTS TestPerfomon
GO
CREATE TABLE TestPerfomon
(ID INT ,
Nm VARCHAR(100))

INSERT INTO TestPerfomon
VALUES(1,1)
GO
BEGIN TRAN
UPDATE TestPerfomon SET Nm='2'
WHERE ID=1

SELECT @@SPID AS blocking_session_id

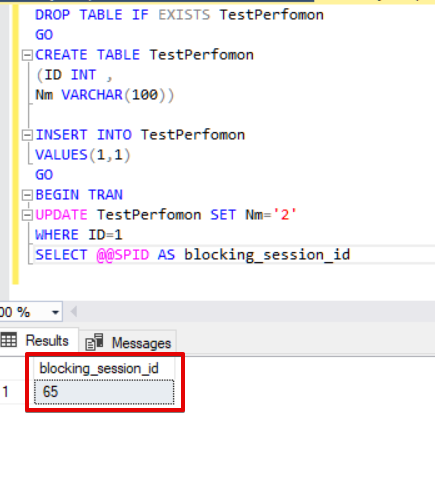
Open a new query window and execute the following query.
SET TRANSACTION ISOLATION LEVEL Serializable
BEGIN TRAN
UPDATE TestPerfomon SET Nm='3'
WHERE ID=1
Open another new query window and run this DMV query.
select session_id ,command , sqltxt.text ,db.name,req.status,wait_type ,transaction_isolation_level,
CASE transaction_isolation_level
WHEN 0 THEN 'Unspecified'
WHEN 1 THEN 'ReadUncomitted'
WHEN 2 THEN 'ReadCommitted'
WHEN 3 THEN 'Repeatable'
WHEN 4 THEN 'Serializable'
WHEN 5 THEN 'Snapshot'
END
AS isolation_level_name ,
blocking_session_id
from sys.dm_exec_requests req
CROSS APPLY sys.dm_exec_sql_text(req.sql_handle) as sqltxt
inner join sys.databases db on db.database_id = req.database_id
where session_id<>@@SPID AND session_id>50
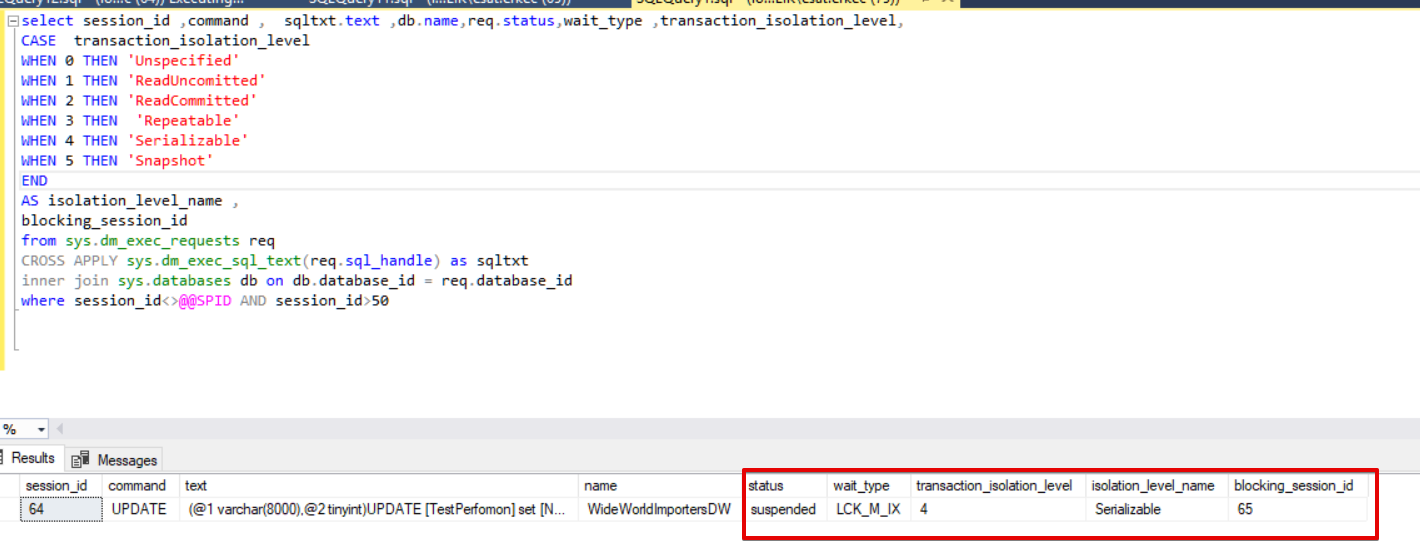
With this demonstration, we found out the reason why the second query is blocked and which session is blocked the request. When you run sp_BlitzWho 65, you can find out the details of blocking and the blocked session details.
sp_BlitzWho 65
In this demonstration, we retrieved the details of blocking and blocked sessions and at the same time, we got the details about these sessions. This is a very basic demonstration but it shows how the issue can be resolved.
In this post, we talked about sys.sys.dm_exec_requests. This dynamic management view gives us the flexibility to get a snapshot during the current rung of a request. Also, these details data can assist or guide us through the process of discovering the problem.
References
- sys.dm_exec_requests (Transact-SQL)
- Monitoring Azure SQL Database using dynamic management views
- sys.dm_db_wait_stats (Azure SQL Database)
Useful tool:
dbForge Monitor – add-in for Microsoft SQL Server Management Studio that allows you to track and analyze SQL Server performance.
Tags: azure sql, database administration, performance, sql server Last modified: September 22, 2021