As you know, the main responsibility of the database administrator lies in the monitoring of the SQL Server performance and intervening in determined time. You can find several SQL Server performance monitoring tools in the market but sometimes we need additional information about SQL Server performance to diagnosis and troubleshoot the performance issues. So we must have enough information about SQL Server Dynamic Management Views to handle issues about SQL Server.
Dynamic Management View (DMV) is a concept that helps us to discover SQL Server Engine performance metrics. DMV was first announced in SQL Server 2005 version and it continued in all versions of SQL Server afterward. In this post, we will talk about particular DMV whose database administrator must have enough information. This is sys.dm_os_wait_stats.
sys.dm_os_wait_stats
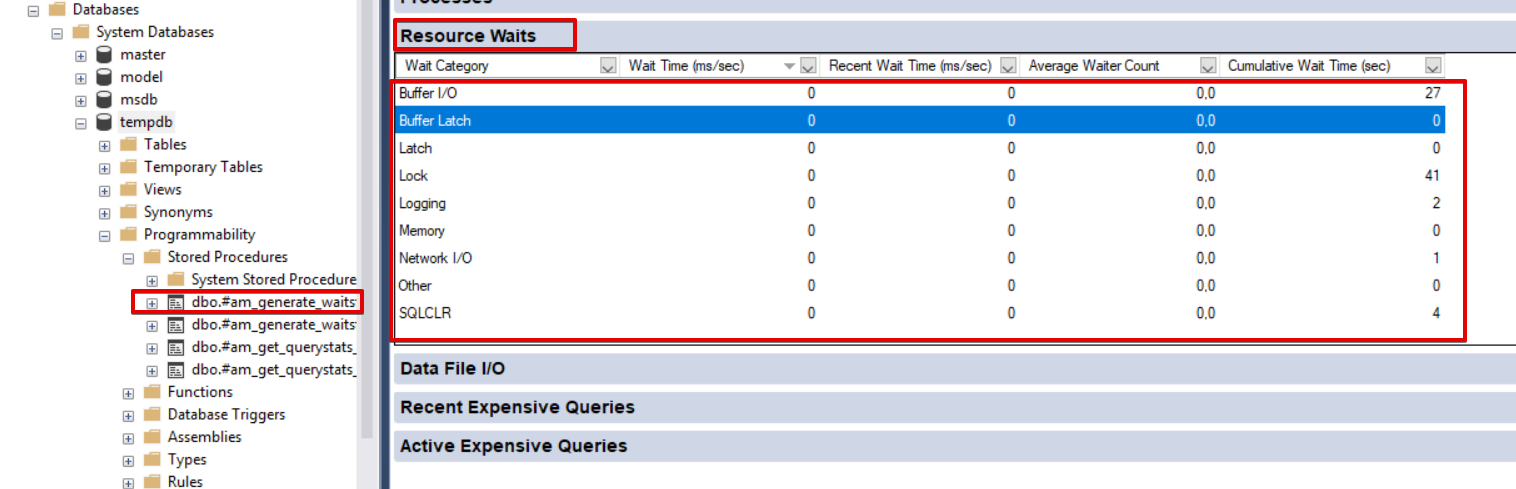
sys.dm_os_wait_stats supports essential metrics for diagnosing SQL Server performance problems. If you have some issues (CPU, Memory, I/O, Lock, Latch etc.) in SQL Server Engine, sys.dm_os_wait_stats data guides us to define the problem. Activity Monitor in SQL Server Management Studio includes a panel named as “Resource Waits”. “Resource Waits” gets these metrics from a special stored procedure. This temporary stored procedure name is “#am_generate_waitstats” and it uses sys.dm_os_wait_stats. You can find this temporary stored procedure in “tempdb”. At this point, I would like to add some notes about the temporary stored procedure. Because this type of stored procedure does not have a common usage.
The temporary stored procedure does not differ from permanent stored procedures. It has two types: local and global like temporary tables. Local stored procedure stays active in the current session and is dropped after the session closes. It can be created like this:
CREATE PROCEDURE #LocalTestSP
AS
PRINT Hello Local Stored Procedure
The global stored procedure also stays active in all the sessions and dropped after the created session closes. The global stored procedure can be created as:
CREATE PROCEDURE ##GlobalTestSP
AS
PRINT Hello Global Stored Procedure
Tip: When we open the Activity Monitor, it creates the #am_generate_waitstats temporary stored procedure and drops it after the closing.
Now we will look into the main idea and details of sys.dm_os_wait_stats. The below query will return all data about SQL Server “Wait Statistics”. This query is in the purest form. It is inconvenient to detect issues with such form. In the following sections, you will find more useful queries then sys.dm_os_wait_stats. Now we will explain the description of the SQL Server “Wait Statistics” columns:
SELECT *
FROM sys.dm_os_wait_stats
ORDER BY wait_time_ms DESC
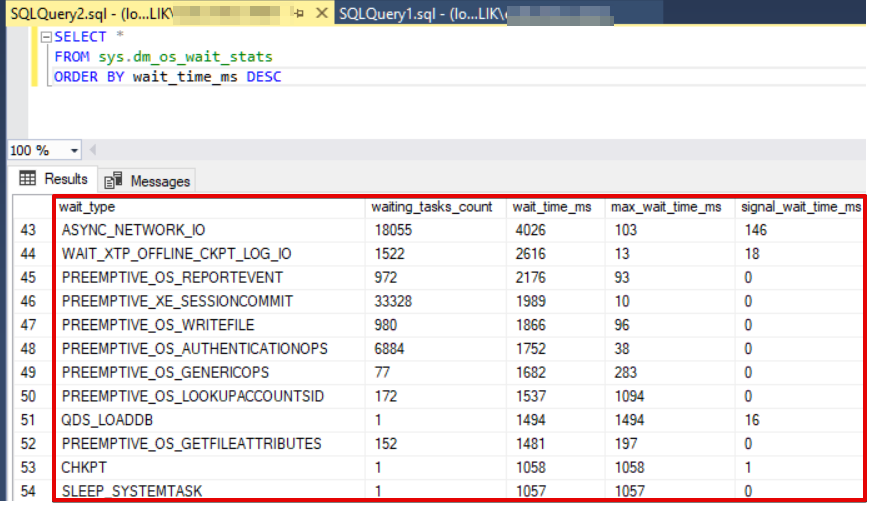
The wait_type column contains the definition or name of wait statistics. wait_type column data is significant for us because the definition of wait statistics that indicates the main reason for the problem. waiting_tasks_count indicates the frequency of wait type occurred in SQL Server.
wait_time_ms indicates the total wait time. The unit of measure is a millisecond.
max_wait_time_ms indicates the maximum wait time.
signal_wait_time_ms is described in MSDN as “Difference between the time that the waiting thread was signaled and when it started running”. Especially high value of this column signs to CPU pressure. So the query is waiting in the runnable queue and ready for running but CPU is busy with other queries. For this reason, the query is waiting in the queue. When the CPU resource available, CPU will get a new query from the runnable queue and will start processing. In short, we can describe signal_wait_time_ms as waiting time in the runnable queue which is state turn runnable to running.
Tip: In the best practice, the several wait statistics are most important than the others. These can be listed as:
• PAGEIOLATCH_*
• WRITELOG
• ASYNC_NETWORK_IO
• CXPACKET
• CPU
• LCK_M_*
• PREEMPTIVE_*
• PAGELATCH_*
Take a look at the Pinal Dave or Paul S. Randal wait for statistics queries. They eliminated several wait statistic types in their queries. The below resource wait types can be eliminated in sys.dm_os_wait_stats queries:
• BROKER_EVENTHANDLER
• BROKER_RECEIVE_WAITFOR
• BROKER_TASK_STOP
• BROKER_TO_FLUSH
• BROKER_TRANSMITTER
• CHECKPOINT_QUEUE
• CHKPT
• CLR_AUTO_EVENT
• CLR_MANUAL_EVENT
• CLR_SEMAPHORE
• DBMIRROR_DBM_EVENT
• DBMIRROR_DBM_MUTEX
• DBMIRROR_EVENTS_QUEUE
• DBMIRROR_WORKER_QUEUE
• DBMIRRORING_CMD
• DIRTY_PAGE_POLL
• DISPATCHER_QUEUE_SEMAPHORE
• EXECSYNC
• FSAGENT
• FT_IFTS_SCHEDULER_IDLE_WAIT
• FT_IFTSHC_MUTEX
• HADR_CLUSAPI_CALL
• HADR_FILESTREAM_IOMGR_IOCOMPLETION
• HADR_LOGCAPTURE_WAIT
• HADR_NOTIFICATION_DEQUEUE
• HADR_TIMER_TASK
• HADR_WORK_QUEUE
• LAZYWRITER_SLEEP
• LOGMGR_QUEUE
• MEMORY_ALLOCATION_EXT
• ONDEMAND_TASK_QUEUE
• PREEMPTIVE_HADR_LEASE_MECHANISM
• PREEMPTIVE_OS_AUTHENTICATIONOPS
• PREEMPTIVE_OS_AUTHORIZATIONOPS
• PREEMPTIVE_OS_COMOPS
• PREEMPTIVE_OS_CREATEFILE
• PREEMPTIVE_OS_CRYPTOPS
• PREEMPTIVE_OS_DEVICEOPS
• PREEMPTIVE_OS_FILEOPS
• PREEMPTIVE_OS_GENERICOPS
• PREEMPTIVE_OS_LIBRARYOPS
• PREEMPTIVE_OS_PIPEOPS
• PREEMPTIVE_OS_QUERYREGISTRY
• PREEMPTIVE_OS_VERIFYTRUST
• PREEMPTIVE_OS_WAITFORSINGLEOBJECT
• PREEMPTIVE_OS_WRITEFILEGATHER
• PREEMPTIVE_SP_SERVER_DIAGNOSTICS
• PREEMPTIVE_XE_GETTARGETSTATE
• PWAIT_ALL_COMPONENTS_INITIALIZED
• PWAIT_DIRECTLOGCONSUMER_GETNEXT
• QDS_ASYNC_QUEUE
• QDS_CLEANUP_STALE_QUERIES_TASK_MAIN_LOOP_SLEEP
• QDS_PERSIST_TASK_MAIN_LOOP_SLEEP
• QDS_SHUTDOWN_QUEUE
• REDO_THREAD_PENDING_WORK
• REQUEST_FOR_DEADLOCK_SEARCH
• RESOURCE_QUEUE
• SERVER_IDLE_CHECK
• SLEEP_BPOOL_FLUSH
• SLEEP_DBSTARTUP
• SLEEP_DCOMSTARTUP
• SLEEP_MASTERDBREADY
• SLEEP_MASTERMDREADY
• SLEEP_MASTERUPGRADED
• SLEEP_MSDBSTARTUP
• SLEEP_SYSTEMTASK
• SLEEP_TASK
• SP_SERVER_DIAGNOSTICS_SLEEP
• SQLTRACE_BUFFER_FLUSH
• SQLTRACE_INCREMENTAL_FLUSH_SLEEP
• SQLTRACE_WAIT_ENTRIES
• UCS_SESSION_REGISTRATIO
• WAIT_FOR_RESULTS
• WAIT_XTP_CKPT_CLOSE
• WAIT_XTP_HOST_WAIT
• WAIT_XTP_OFFLINE_CKPT_NEW_LOG
• WAIT_XTP_RECOVERY
• WAITFOR
• WAITFOR_TASKSHUTDOW
• XE_TIMER_EVENT
• XE_DISPATCHER_WAIT
• XE_LIVE_TARGET_TVF
Tip: SQL Server starts to collect DMV data when it starts or restarts. SQL Server automatically reset the wait statistics when it restarted and the below query forces to reset the wait statistics since SQL Server was last restarted:
DBCC SQLPERF('sys.dm_os_wait_stats', CLEAR)
Additionally, the measurement accuracy of wait statistics is the key point. At this point we can consider two approaches:
• Reset the wait statistics and recollect the wait statistics.
• Capture two different “time wait statistics” and measure the difference in values.
In my opinion, capturing and storing wait statistics for any history table approach is better than other. In this method, you can measure particularly time interval and do not loose wait statistics of historical data.
Now we will make a sample of the capturing of wait statistics and show captured data in Power BI with graphics.
We will create a history table to store wait statistics:
CREATE TABLE [dbo].[HistoryOfWaitStatistics](
[SQLStartTime] [datetime] NULL,
[Dt] [datetime] NOT NULL,
[WaitType] [nvarchar](60) NOT NULL,
[WaitTimeSecond] [numeric](25, 6) NULL,
[ResourcesWaitSecond] [numeric](25, 6) NULL,
[SignalWaitSecond] [numeric](25, 6) NULL
) ON [PRIMARY]
The below script inserts “wait statistics” to the history table. But you need to schedule this query in SQL Server Agent to store history table:
DROP TABLE IF exists #eliminate_WS
CREATE TABLE #eliminate_WS (wait_type NVARCHAR(100));
INSERT INTO #eliminate_WS VALUES ('ASYNC_IO_COMPLETION');
INSERT INTO #eliminate_WS VALUES ('CHECKPOINT_QUEUE');
INSERT INTO #eliminate_WS VALUES ('CHKPT');
INSERT INTO #eliminate_WS VALUES ('CXPACKET');
INSERT INTO #eliminate_WS VALUES ('DISKIO_SUSPEND');
INSERT INTO #eliminate_WS VALUES ('FT_IFTS_SCHEDULER_IDLE_WAIT');
INSERT INTO #eliminate_WS VALUES ('IO_COMPLETION');
INSERT INTO #eliminate_WS VALUES ('KSOURCE_WAKEUP');
INSERT INTO #eliminate_WS VALUES ('LAZYWRITER_SLEEP');
INSERT INTO #eliminate_WS VALUES ('LOGBUFFER');
INSERT INTO #eliminate_WS VALUES ('LOGMGR_QUEUE');
INSERT INTO #eliminate_WS VALUES ('MISCELLANEOUS');
INSERT INTO #eliminate_WS VALUES ('PREEMPTIVE_XXX');
INSERT INTO #eliminate_WS VALUES ('REQUEST_FOR_DEADLOCK_SEARCH');
INSERT INTO #eliminate_WS VALUES ('RESOURCE_QUERY_SEMAPHORE_COMPILE');
INSERT INTO #eliminate_WS VALUES ('RESOURCE_SEMAPHORE');
INSERT INTO #eliminate_WS VALUES ('SOS_SCHEDULER_YIELD');
INSERT INTO #eliminate_WS VALUES ('SQLTRACE_BUFFER_FLUSH ');
INSERT INTO #eliminate_WS VALUES ('THREADPOOL');
INSERT INTO #eliminate_WS VALUES ('WRITELOG');
INSERT INTO #eliminate_WS VALUES ('XE_DISPATCHER_WAIT');
INSERT INTO #eliminate_WS VALUES ('XE_TIMER_EVENT');


INSERT INTO HistoryOfWaitStatistics
SELECT
(SELECT sqlserver_start_time FROM sys.dm_os_sys_info ) as SQLStartTime,GETDATE() AS Dt,Wait_type as WaitType,
wait_time_ms / 1000. AS WaitTimeSecond,

(wait_time_ms - signal_wait_time_ms)/1000. AS ResourcesWaitSecond,
signal_wait_time_ms/1000. AS SignalWaitSecond
FROM sys.dm_os_wait_stats
WHERE wait_type IN(SELECT wait_type FROM #eliminate_WS)
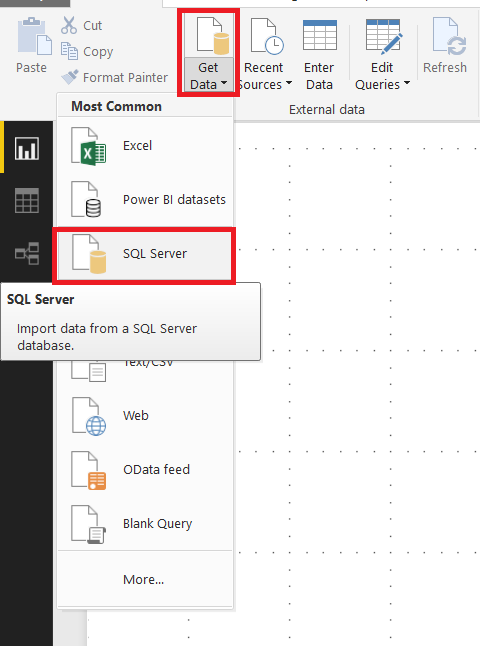
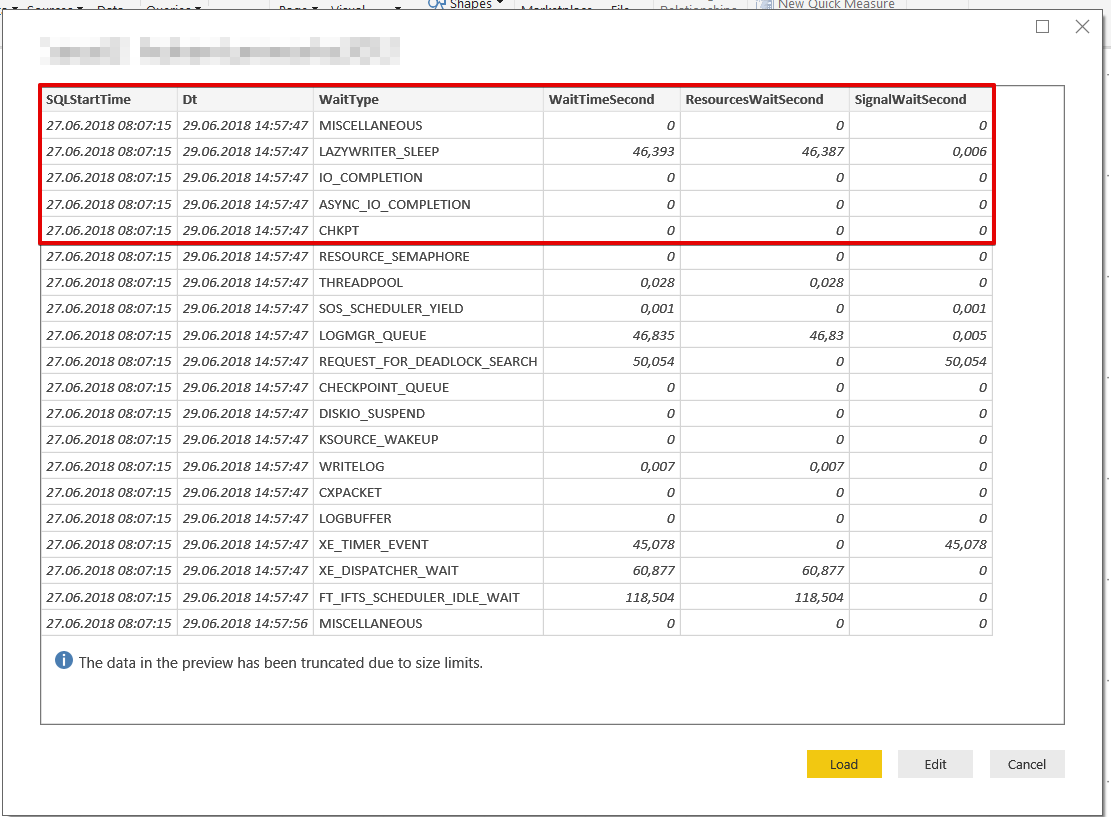
After the historical data has been stored, we open Power BI and develop our wait statistics dashboard.
Click Get Data and select SQL Server:
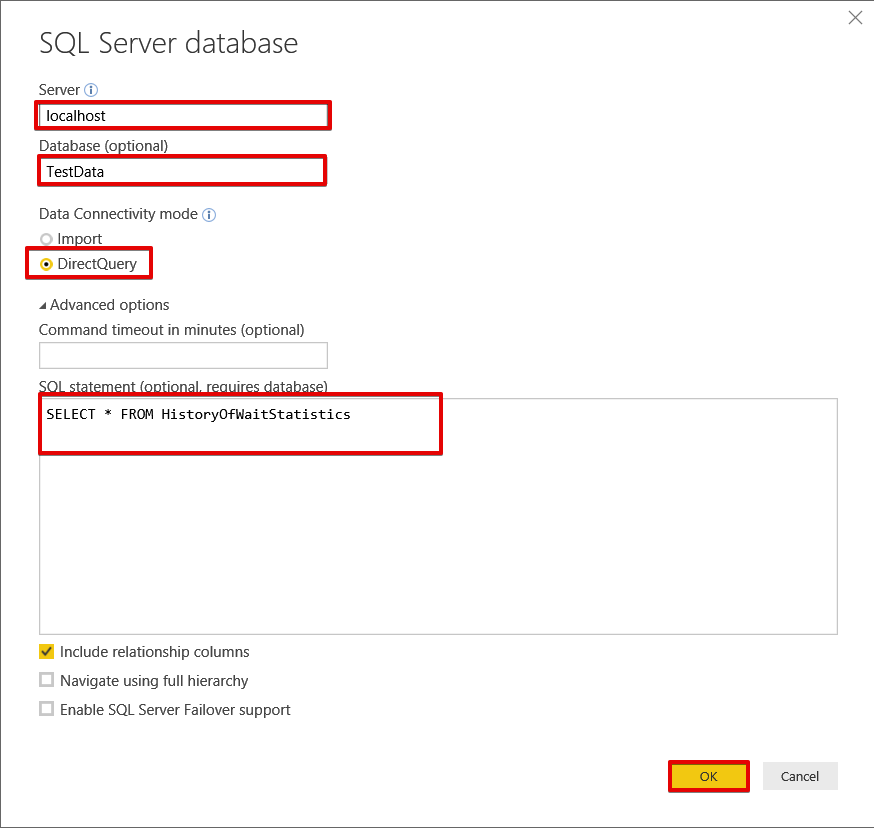
Set the connection settings and then write the query to SQL statement (optional, requires a database). Click OK.
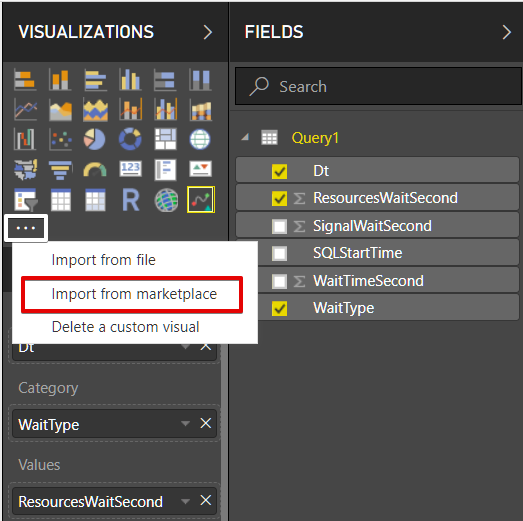
Click Import from Marketplace
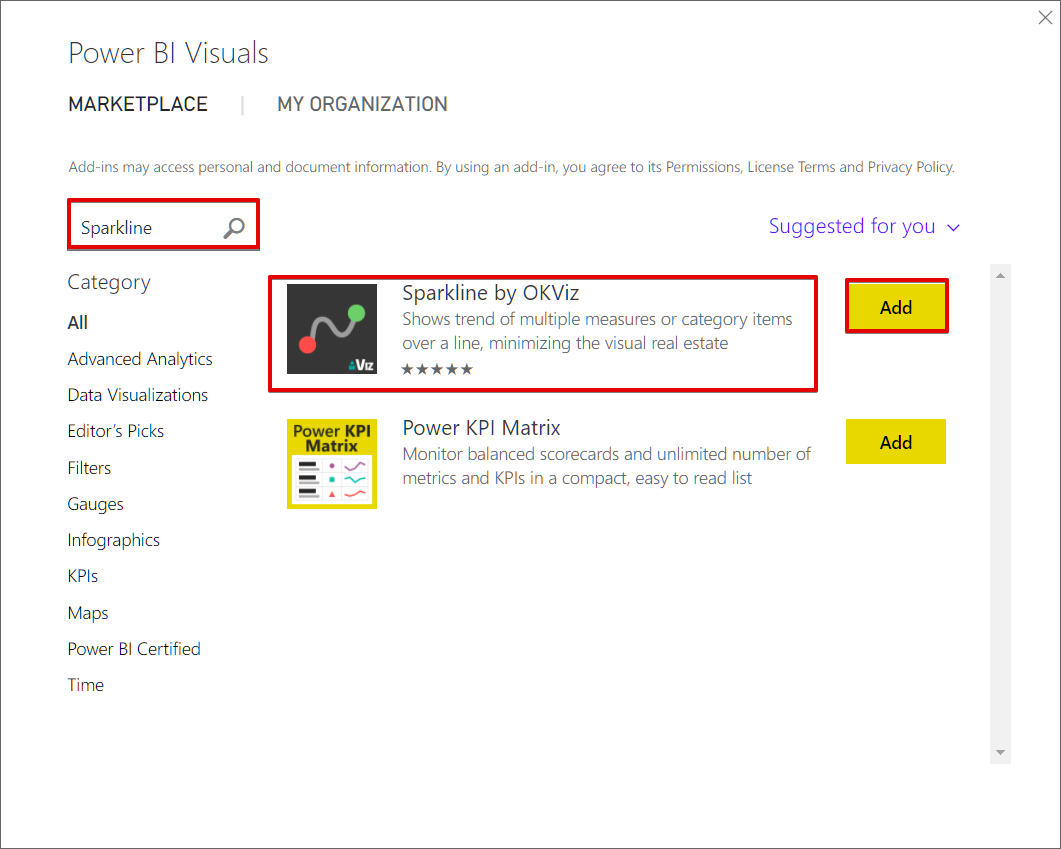
Find Sparkline by OKViz visual component and Add Power BI
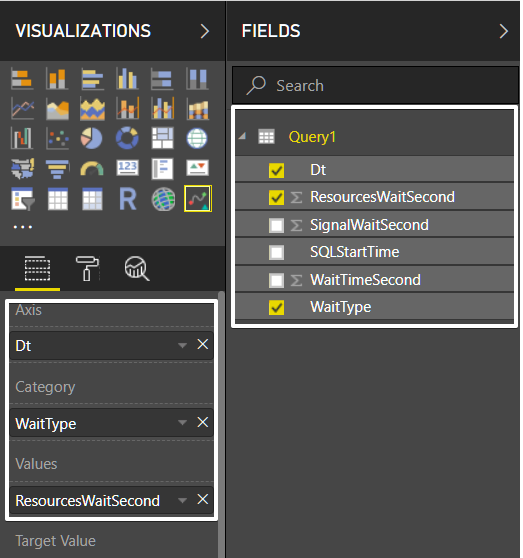
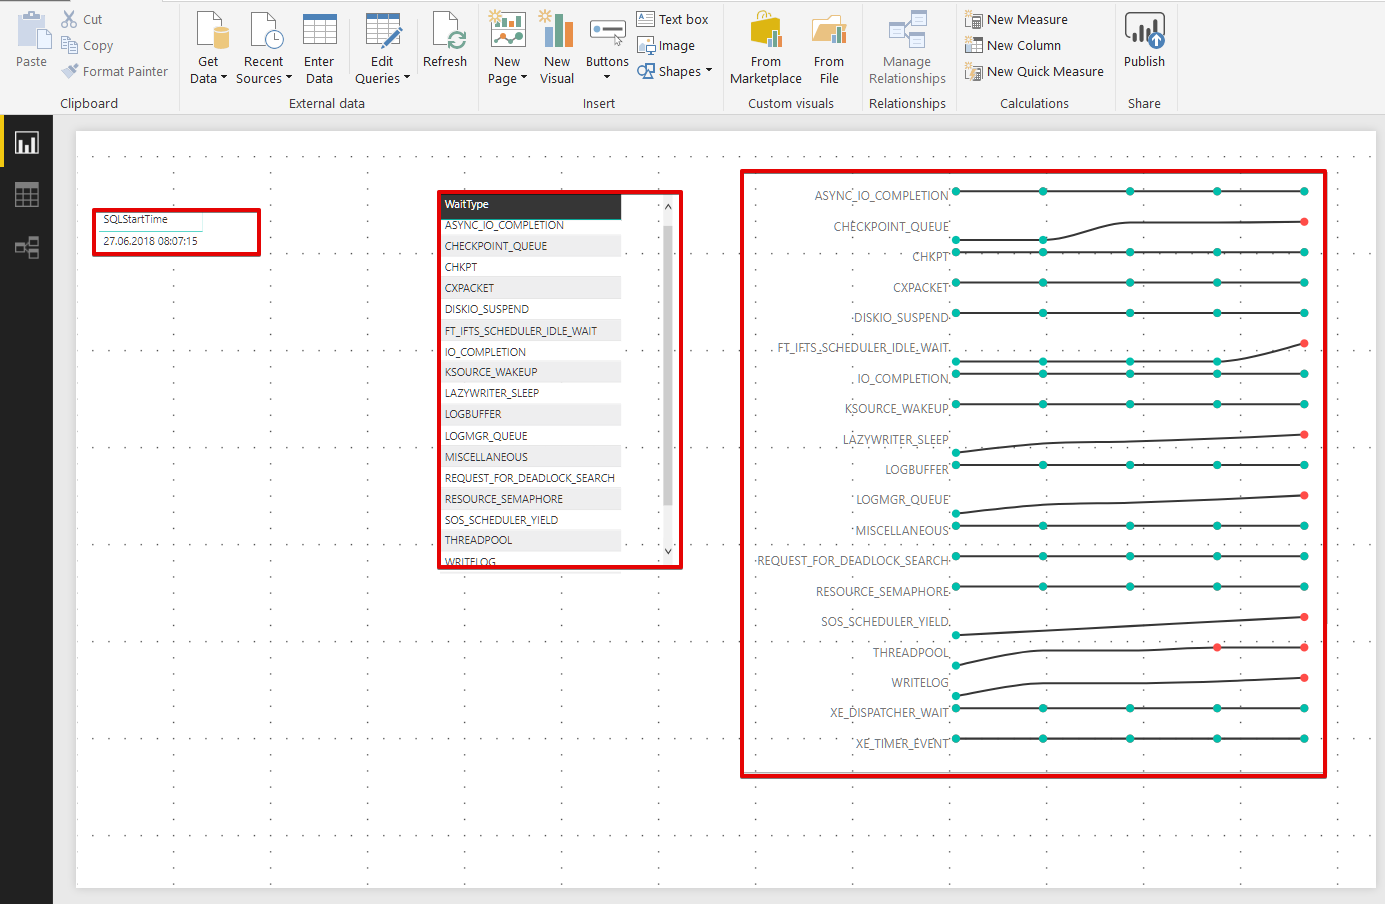
Add Sparkline to Power BI design panel and drag and drop dataset columns as in the below image:
Add two table components to filter: SQLStartTime and WaitType. Finally, the dashboard should be like this:
How toDiagnosis Resource Wait Issue:
In this section, we will mention the methodology and discipline of diagnosing wait statistics problems. Particularly, we have to figure out one point about wait statistics: it simply defines the main structure of the problem but never gives details. For this reason, we need to research wait details and reasons. Therefore, “wait statistics” allows us turning our research into this direction. After, we should use other tools (PerfMon, Extended Events, 3rd party monitoring tools, etc.) and other DMVs to define exact problems.
Assuming that, we observe ASYNC_NETWORK_IO in SQL Server, this resource wait is related to slow network connection from a client to server side. But this information does not help to troubleshoot the main reason of the problem because we may have several network configuration between server and client side. For this example we need to look:
• Large result sets queries
• Network Interface Card configurations
• Settings of network environment between server sides to the client side.
• Check network adapter bandwidth.
As you can see in the example, we need to complete some tasks to define the exact problem. Wait statistics do not indicate the target of the problem.
Conclusions
In this post, we talked about the main concept of the sys.dm_os_wait_stats dynamic management view. At the same time, we discussed the simplicity of usage and significant points, at which it is necessary to pay attention.
Useful tool:
dbForge Monitor – add-in for Microsoft SQL Server Management Studio that allows you to track and analyse SQL Server performance.
Tags: database administration, performance, ssms Last modified: October 08, 2021