When you develop large chunks of T-SQL code with the help of the SQL Server Management Studio tool, it is essential to test the “Live” behavior of your code by making sure that each small piece of code works fine and being able to allocate any error message that may cause a failure within that code.
The easiest way to perform that would be to use the T-SQL debugger feature, which used to be built-in over the SQL Server Management Studio tool. But since the T-SQL debugger feature was removed completely from SQL Server Management Studio 18 and later editions, we need a replacement for that feature. This is because we cannot keep using the old versions of SSMS just to support the T-SQL Debugger feature without “enjoying” the new features and bug fixes that are released in the new SSMS versions.
If you plan to wait for SSMS to bring back the T-SQL Debugger feature, vote in the Put Debugger back into SSMS 18 to ask Microsoft to reintroduce it.
As for me, I searched for an alternative tool for a T-SQL Debugger SSMS built-in feature and found that Devart company rolled out a new T-SQL Debugger feature to version 6.4 of SQL – Complete tool. SQL Complete is an add-in for Visual Studio and SSMS that offers scripts autocompletion capabilities, which help develop and debug your SQL database project.
The SQL Debugger feature of SQL Complete allows you to check the execution of your scripts, procedures, functions, and triggers step by step by adding breakpoints to the lines where you plan to start, suspend, evaluate, step through, and then to continue the execution of your script.
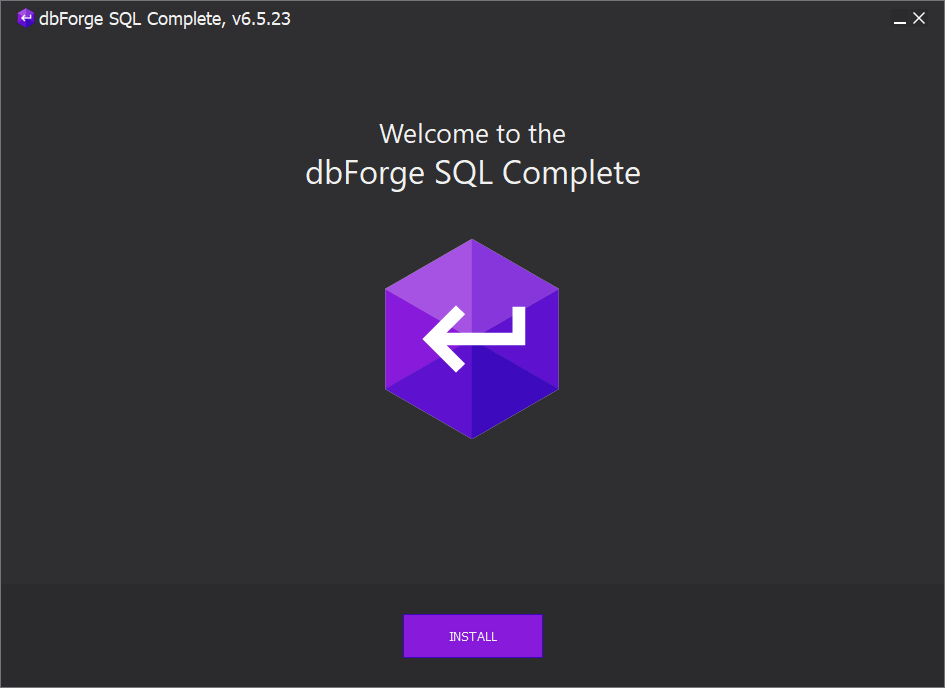
You can download SQL Complete from the dbForge Download page and install it on your machine using a straight-forward installation wizard. The wizard will ask you to specify the installation path for the SQL Complete tool and the versions of SSMS and Visual Studio that you plan to install the SQL Complete on, as an add-in, from the versions that are installed on your machine, as shown below:
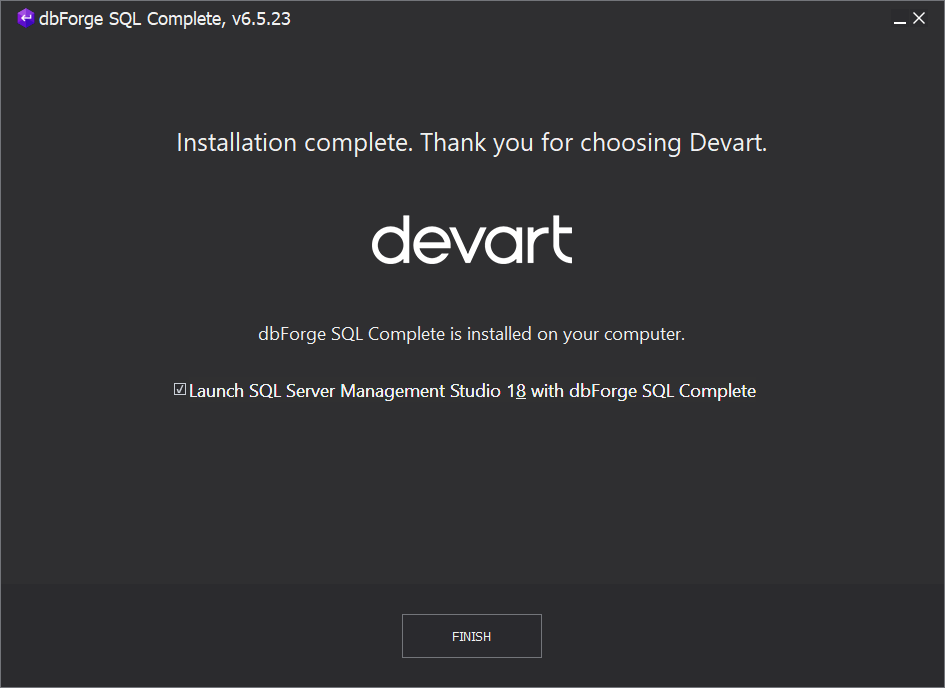
Once SQL Complete is fully installed on your machine, the dbForge SQL Complete installation wizard will notify you of whether the installation was completed successfully or the wizard faced any specific issue that you can troubleshoot and fix easily. If there are no issues, the wizard will provide you with an option to open the SSMS tool and start using the SQL Complete tool, as displayed below:
When you open SSMS, you will see a new “Debug” tools menu, under which you can navigate the SQL Debugger feature options. Besides, you will see a list of icons that will be used to control the debug mode of the T-SQL query at the leftmost side of the SSMS tool. If you cannot see the list, you can go to View -> Toolbars -> Debugger to make these icons visible.
During the debugging session, the SQL Debugger icons will be as follows:
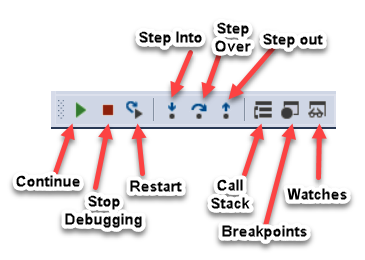
The functionality of these icons within the SQL Debugger can be summarized as:
- Adding Breakpoints to control the execution pause of the T-SQL script at a specific statement allows you to check the debugging information of the T-SQL statements such as the values for the parameters and the variables.
- Step Into is “navigate” through the script statements one by one, allowing you to check how each statement behaves.
- Step Over is “execute” a specific stored procedure if you are sure that it contains no error.
- Step Out is “return” from the stored procedure, function, or trigger to the main debugging window.
- Continue executing the script until reaching the next breakpoint.
- Stop Debugging is “terminate” the debugging session.
- Restart “stop and start” the current debugging session.
Debug an SQL Script
To debug your script using SQL Debugger SSMS add-in, open a new query window in SSMS, write your code, and place breakpoints based on your debugging requirements by clicking the grey bar to the left of each statement. Right-click the statement and choose the Insert Breakpoint option or use the Toggle Breakpoint (F9) option from the Debug tools menu, as shown below:

The breakpoints specify the statement at which the execution of the script will be paused, allowing you to validate the script till that point. Click on the Continue option to start the debugger and see how it pauses on the first statement with a breakpoint in the script, as shown below:
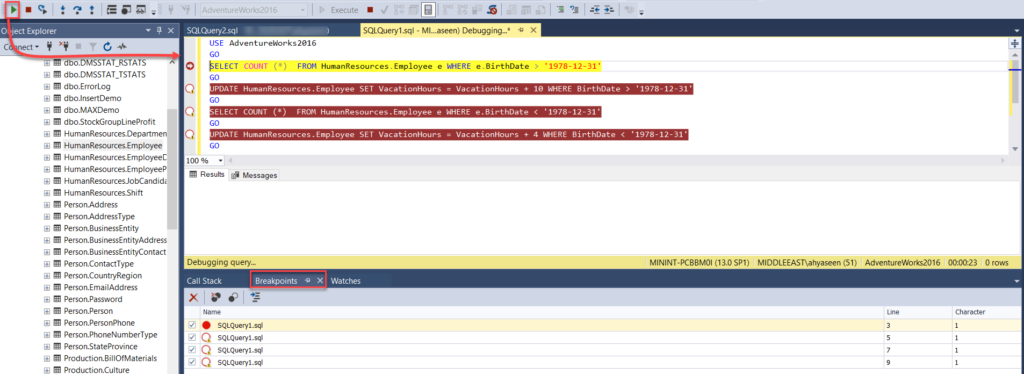
Before you run the first breakpoint, check the Breakpoints tab at the bottom of the query window that contains the list of breakpoints set in your script. Note that you can disable and enable it from here. Also, the Call Stack window shows the stack of your script calls, and the Watches window displays the values for the variables and the parameters that are used in your code during the execution of the script.
To run the first breakpoint that you have set and step to the next breakpoint, use the Continue option, where it will execute all statements and pause on the next breakpoint. In our example below, we need to check the number of rows that will be affected before executing the modification operation, as shown below:
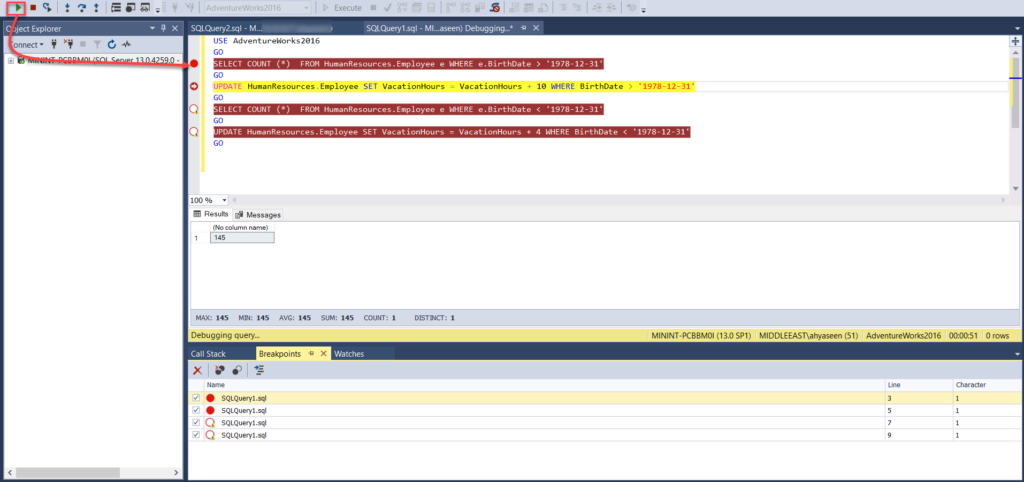
Continue debugging the script using the proper operation that complies with the script statements type and meets the debugging requirements. Go on monitoring the stack calls and the values of the variables until you execute the last breakpoint statement where the debugging session will be terminated, as shown below:
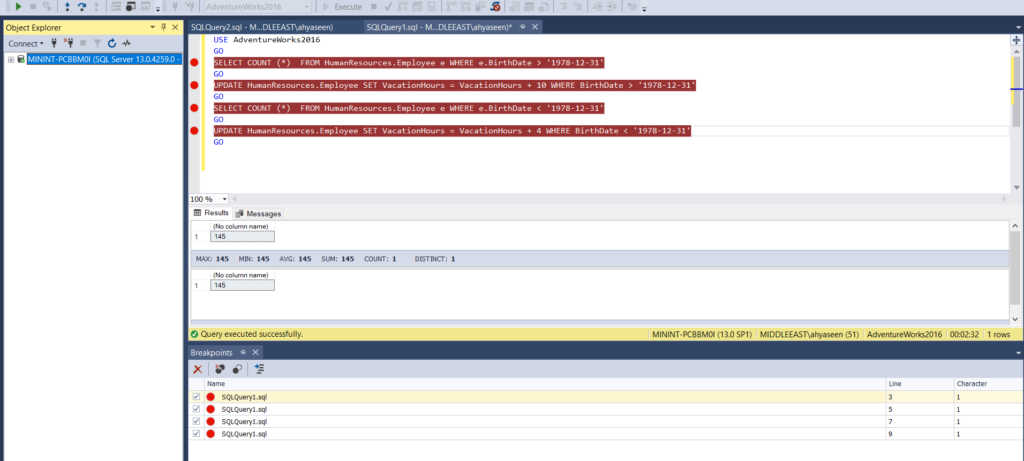
When you finish your debugging process, you can easily disable or enable the existing breakpoints from the Breakpoints tab, by clicking on the Disable All Breakpoints option, where the disabled breakpoints will be in the shape of empty red circles and the enabled ones as filled red circles, as shown below:

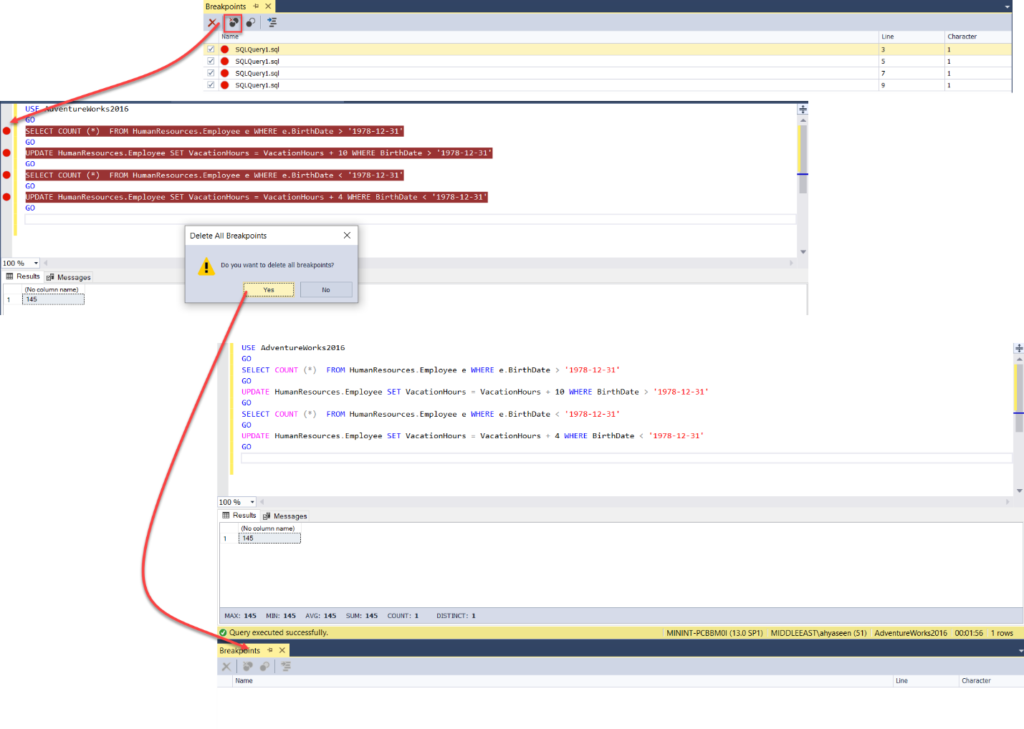
In addition, you can easily delete the existing Breakpoints from the Breakpoints tab, by clicking on the Delete All Breakpoints. As a result, the breakpoints will be completely removed from the query window and the Breakpoints tab, as follows:
Conclusions
In this article, we have shown a good alternative to the T-SQL Debugger feature, which was removed from SSMS 18.0 and later versions, and demonstrated the use of dbForge SQL Complete – SQL Debugger tool. This instrument enables you to easily debug your script, stored procedure, function, or trigger by adding as many breakpoints as you need. Apart from that, you can monitor your script behavior and, at the same time, pause at any statement, step through the statements based on your debugging requirements, and watch the stack calls of your script statements, the values for the parameters, and variables during the script debugging process.
Tags: sql, sql debugger, sql server, sql server stored procedure, ssms, t-sql queries Last modified: September 28, 2021


