When we are beginning to think of migrating our on-premises databases to Azure SQL, we have to decide on a proper purchase model, a service tier, and a performance level. Before starting the Azure SQL migration process, we have to find logical and provable answers to the following questions:
- Which purchase model is suitable for my apps and business requirements?
- How much budget do I need?
- Which performance level meets my requirements?
- Can I achieve the acceptable performance of my apps?
The purchase model and service tiers will certainly affect the Azure bills. On the other hand, we have to achieve the maximum performance with the selected service tier.
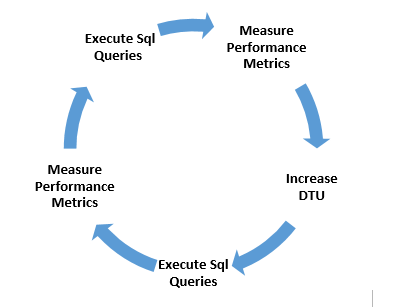
Another main topic is how to migrate the on-premises database to Azure SQL. In my opinion, this diagram can help us to determine the steps of the on-premises database migration to Azure SQL.
In this article, we are going to explore how to choose the right purchase model and service tier.
Volume 1: Choice
First, we have to decide on the right purchasing model that will meet our requirements. Microsoft offers two different purchase models: vCore-based model and DTU-based model. They include different features, service tiers, and some limits.
Let’s describe these purchasing models in details.
VCore-based model
It allows us to scale compute (service tier + a number of vCores + generation of hardware), memory, and storage resources very flexible. It means that we can decide on the hardware configuration of an Azure SQL database and pay money for this configuration. It is a simple way to migrate your on-premises database to cloud. The reason is that you can create almost the same or closest hardware configuration of the on-premises box in the cloud. This purchasing model includes General Purpose and Business Critical service tiers.
DTU-based model
What is database transaction unit (DTU)?
Microsoft creates a new metric for Azure SQL that is used for DTU-based model service tiers. A database transaction unit (DTU) is a metric which defines a mixture of CPU, memory and read/write rates. At the same time, the DTU value can be defined as a horsepower of your database. When we raise the DTU value, database resources are automatically increased. As a result, this operation will boost the database performance.
Another benefit of DTU is to simplify the process of measuring the Azure SQL performance. When we want to talk about the database performance, we can discuss only one metric because it consists of other several metrics. But I would like to note that increasing the service tier or DTU value does not resolve non-related performance problems, such as deadlock, network etc.
DTU-based purchasing model offers three types of service tiers. They are “Basic”, “Standard”, and “Premium”. These service tiers have different features and performance levels, as well as limitations. At the same time, the cost is also changing according to the service tiers.
When we want to decide on one of these service tiers, the key point is DTU, storage, and price because they impact the cost of Azure SQL.
How to decide on the DTU value?
If we decide to migrate our on-premises database to cloud, we may face the following question “How much DTU does my database require?”
To estimate this value, we can use Azure SQL Database DTU Calculator. It needs our utilization metrics of on-premises database performance to capture as an input. These performance counters are as follows:
- Processor – % Processor Time
- Logical Disk – Disk Reads/sec
- Logical Disk – Disk Writes/sec
- Database – Log Bytes Flushed/sec
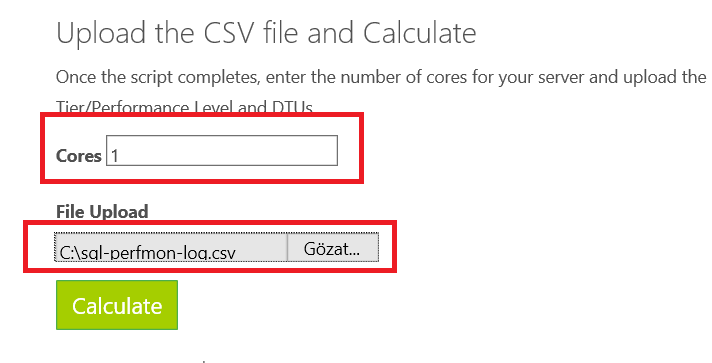
Then, you can upload this utilization metrics as a .CSV file and set a number of your server cores. Finally, the DTU calculator counts the estimated DTU.
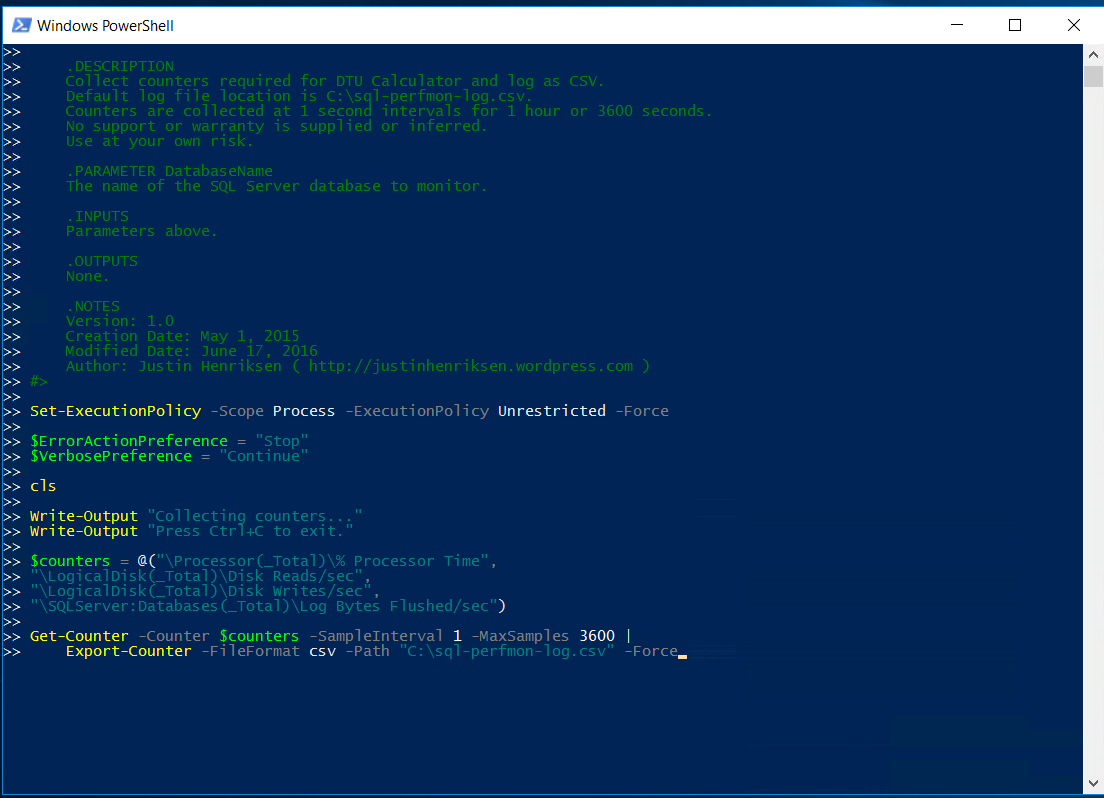
Now, we will make a demo with the PowerShell script. To do this, download the PowerShell script that captures the database utilization to a .CSV file.
Then, copy this script to Windows PowerShell and run it.
PowerShell will start to collect database performance counters and record these metrics to a .CSV file. To stop collecting data, press Ctrl+C.
Also, I would like to share some recommendations:
- Collect performance data at peak times
- Collect performance data at least per 1 hour
We will store the .CSV file to this path: C:\ sql-perfmon-log.csv.
The next step is to upload this file to the DTU calculator website and click Calculate.
At this step, you can find two graphics.
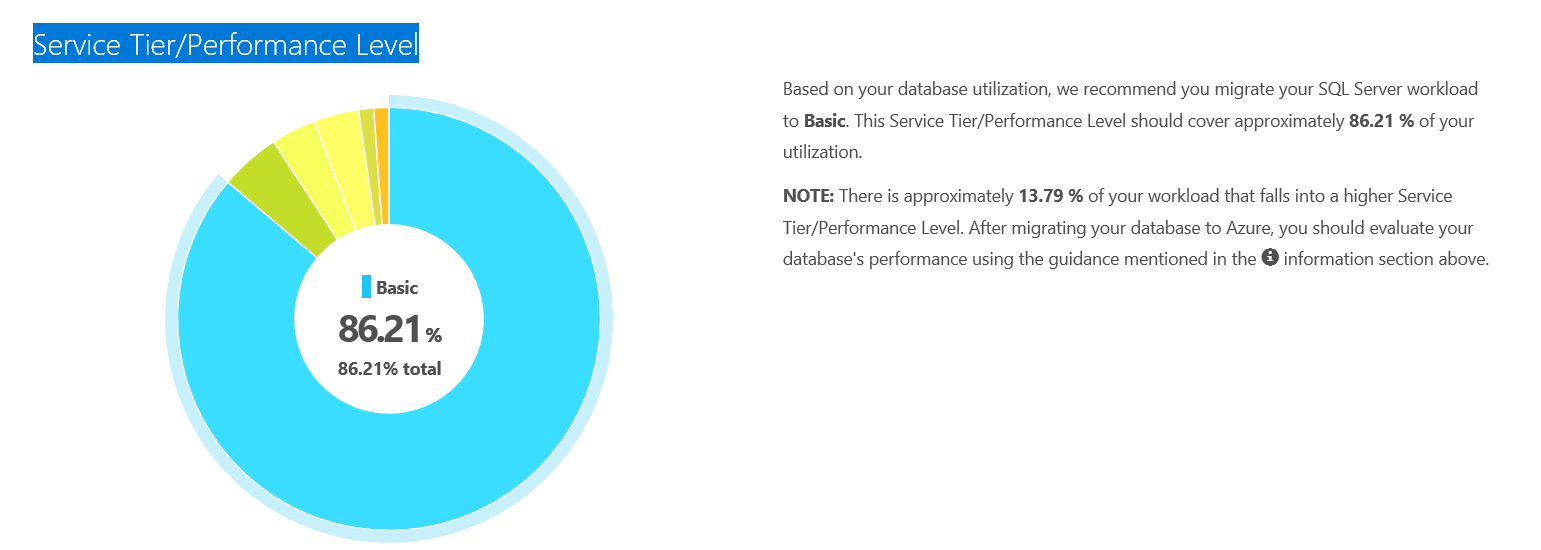
Service Tier/Performance Level
This pie graph represents 86.21% of on-premises workload that should be migrated to the Basic tier. Also, 13.79% relates to the Performance level. This percentage may confuse our mind. To prevent this situation, collect the workload of the database at different time intervals and compare the percentage of service tiers and find the optimum service tier.
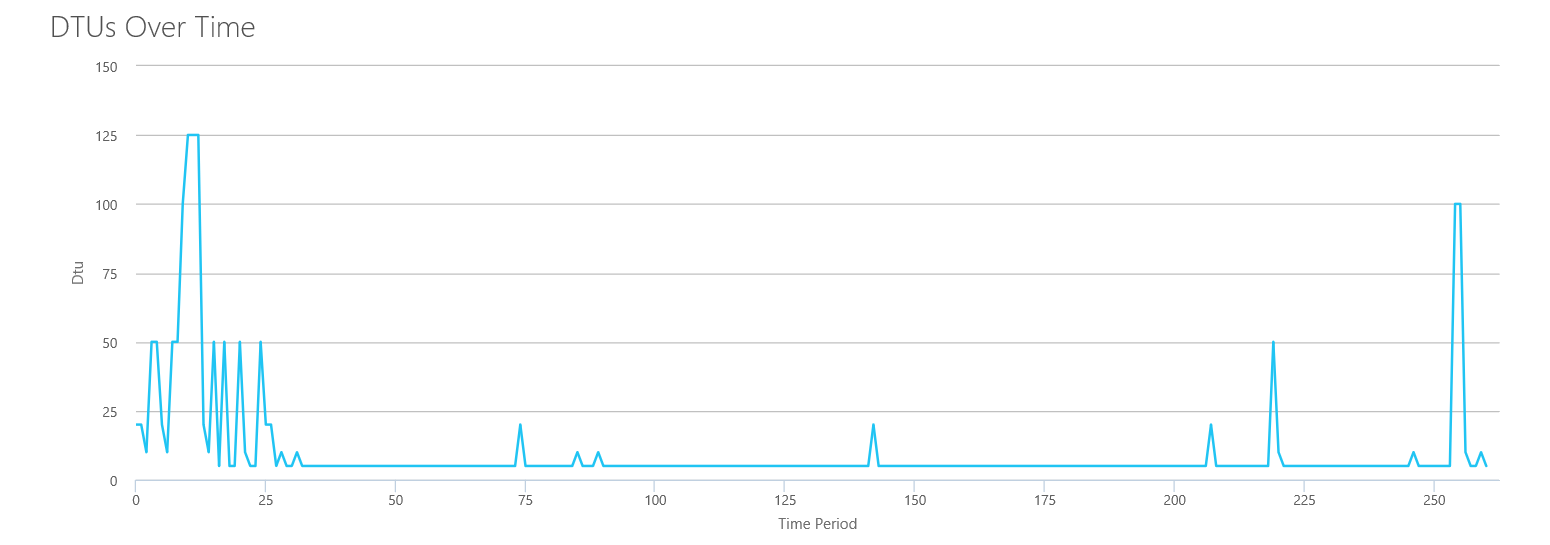
DTUs Over Time
This graph represents your database heartbeat of DTU. With this chart, you can estimate your database requirement of DTU.
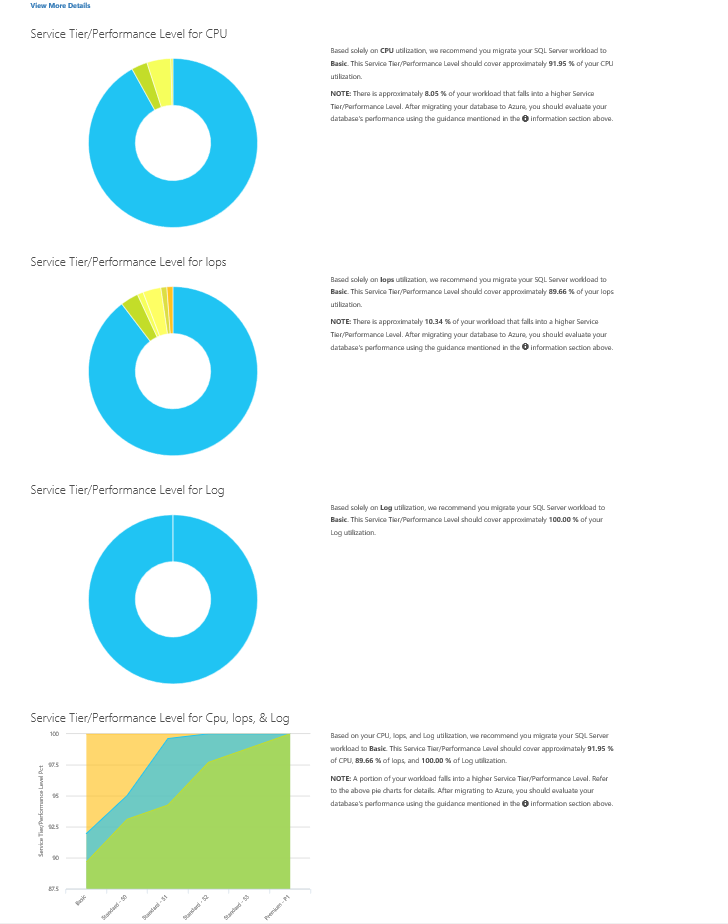
Below you can find another chart with some detailed information.
Once these steps are gone through, we decided on the purchasing model and service tier.
Volume 2: Test
We are going to create a simple performance test and analyze how DTU may affect performance.
Simple Performance Test
Requirements are as follows:
- SQLQueryStress
- Azure SQL
Scenario
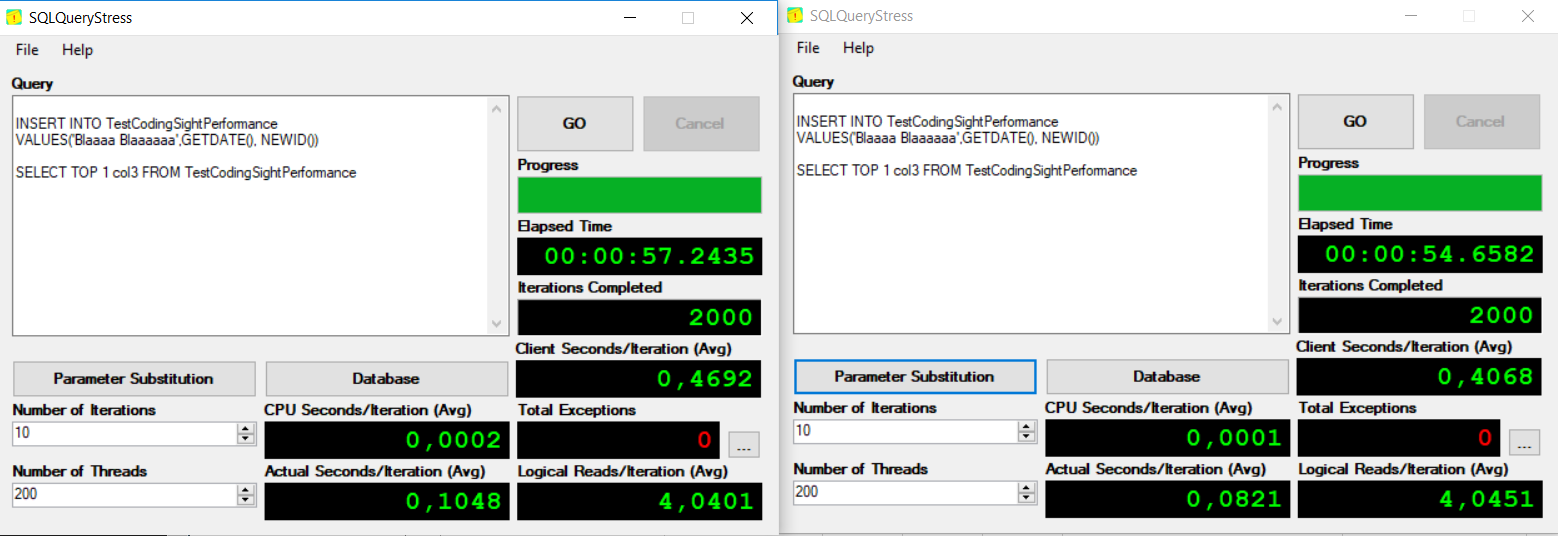
For this test, we will create a table in Azure SQL and execute INSERT and SELECT statements with the 1000 iterations and 10 threads. Finally, we will measure performance metrics of Azure SQL. Then, we will increase DTU and repeat the test scenario.
The diagram below illustrates the test cycle.
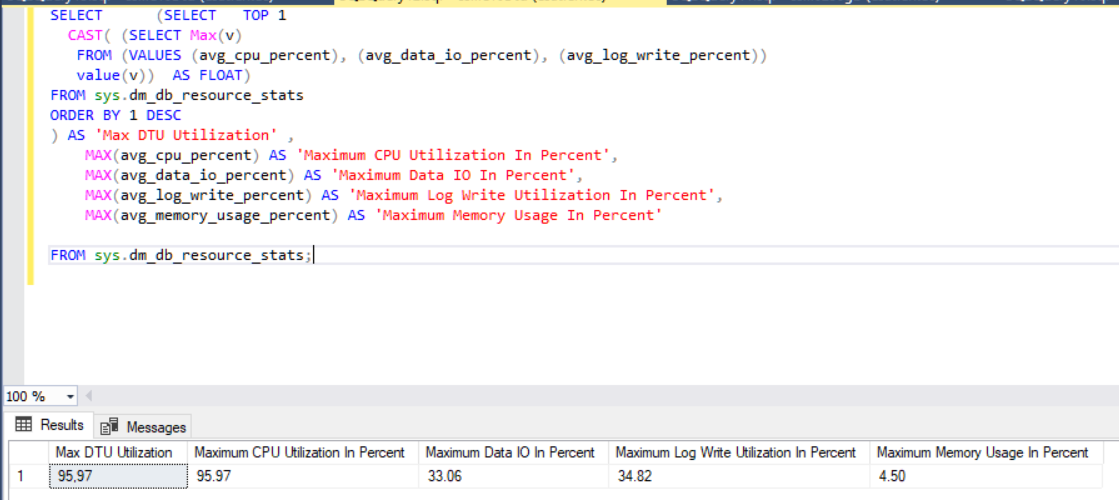
We can measure these metrics with the sys.dm_db_resource_stats DMV. It works particularly for Azure SQL and returns CPU, I/O, and memory consumptions.
Test
- Connect to Azure portal and create a test table.
CREATE TABLE TestCodingSightPerformance
(ID INT PRIMARY KEY IDENTITY(1,1) ,
colvar VARCHAR(200), col2datetime DATETIME ,
col3 uniqueidentifier)
- Connect to Azure SQL with SQLQueryStress.
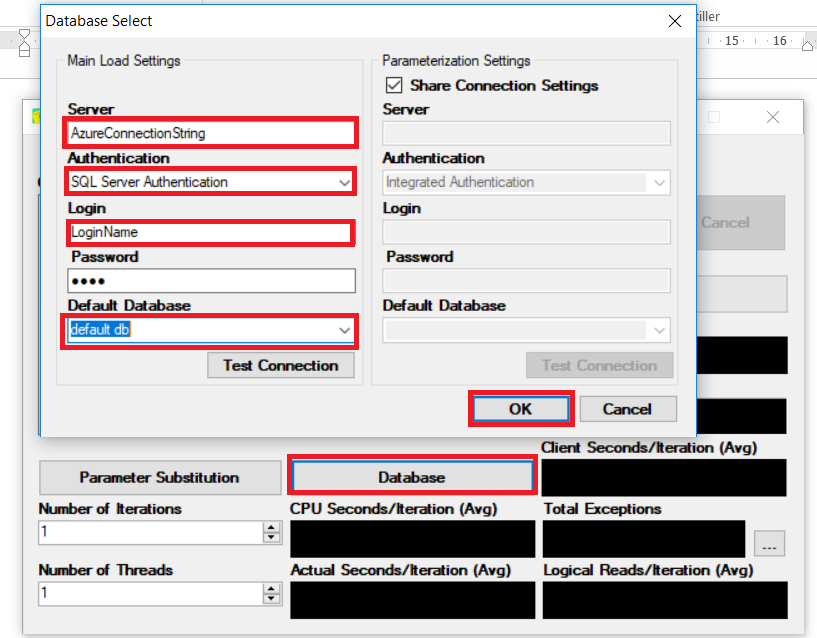
- Click Database and then fill in the connection string parameters to connect to Azure SQL.
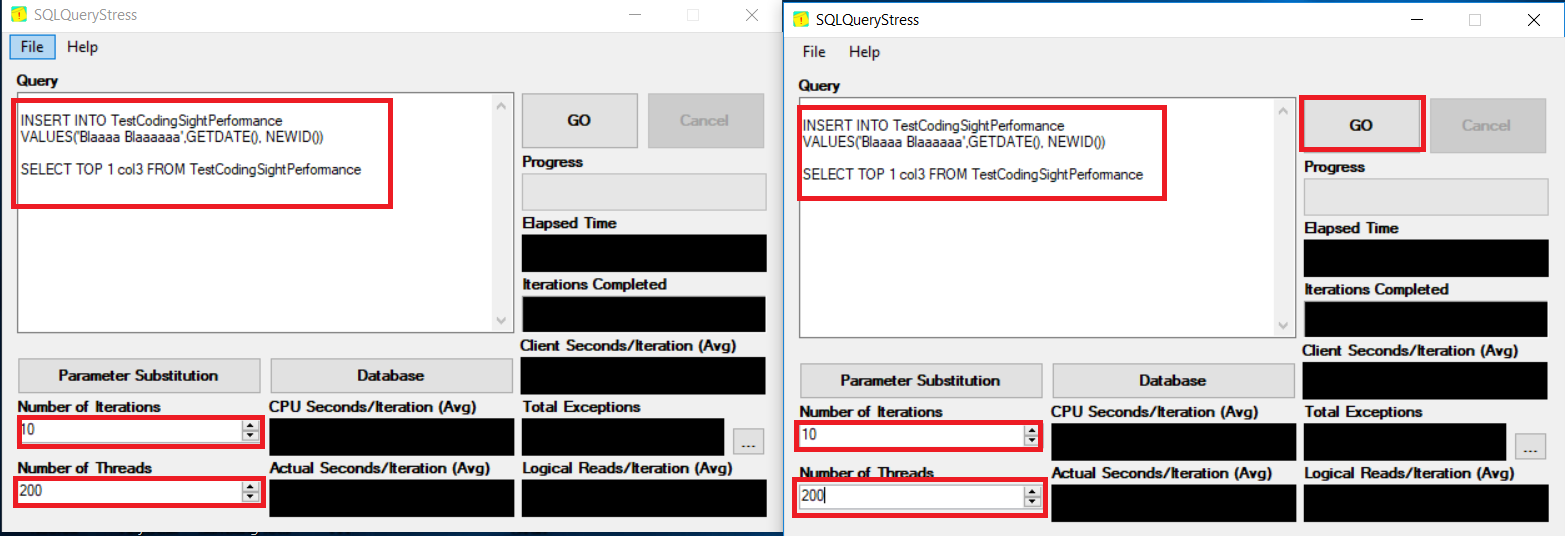
- Set the number of iterations, number of threads and insert a query. Then, click GO.
Note: We will open two SQLQueryStress applications because one program allows maximum 200 threads.INSERT INTO TestCodingSightPerformance VALUES('Blaaaa Blaaaaaa',GETDATE(), NEWID()) SELECT TOP 1 col3 FROM TestCodingSightPerformanceThis DMV query will measure the performance metrics to the maximum values.
SELECT  	(SELECT   TOP 1
  CAST( (SELECT Max(v)
   FROM (VALUES (avg_cpu_percent), (avg_data_io_percent), (avg_log_write_percent))
   value(v))  AS FLOAT)
FROM sys.dm_db_resource_stats
ORDER BY 1 DESC
) AS 'Max DTU Utilization' ,
    MAX(avg_cpu_percent) AS 'Maximum CPU Utilization In Percent',
    MAX(avg_data_io_percent) AS 'Maximum Data IO In Percent',
    MAX(avg_log_write_percent) AS 'Maximum Log Write Utilization In Percent',
    MAX(avg_memory_usage_percent) AS 'Maximum Memory Usage In Percent'

FROM sys.dm_db_resource_stats;
Test 1 – Standard S0: 10 DTUs, 250 GB
In this test scenario, we will use Standard S0: 10 DTUs, 250 GB to measure performance metrics.
This table shows test results of Standard S0: 10 DTUs.
Test 1 – Standard S1: 20 DTUs, 250 GB
In this test scenario, we will use Standard S1: 20 DTUs, 250 GB to measure performance metrics.
This table displays test results of Standard S1: 20 DTUs.
Test 2 – Standard S2: 50 DTUs, 250 GB
This table defines test results of Standard S2: 50 DTUs.
Once all these test scenarios are performed, we can illustrate all results in one table.
As you can see, DTU affects performance dramatically. When we increase DTU, the elapsed time will decrease.
Conclusions
Azure SQL offers a different type of purchase models that include different service tiers. Also, we have analyzed the impact of DTU and found out that it greatly influences the Azure SQL performance. However, DTU not only affects the performance but also plays a key role in the Azure SQL cost. For this reason, we have a stabilized DTU and cost management.
References
Monitor Azure SQL Database using Azure SQL Analytics (Preview) in Log Analytics
Tags: azure sql, performance Last modified: September 22, 2021



 This DMV query will measure the performance metrics to the maximum values.