
Often, we need to gather system statistics regarding running SQL Server Instances, such as the number of total connections attempted to SQL Server instance since its start, or the time that SQL Server spent in active operations, etc. Microsoft brought us a separate set of system functions to retrieve the system-related statistics. Today, I am going to explain such system statistical functions with the use cases.
System Statistical Functions in SQL
System Statistical functions are a type of scalar function returning a single value in the output. This one provides statistical information about the system. An essential note is that all functions that fall under this category will not return the same output when you execute them. For every execution, you get a different result. That’s why system statistical functions are non-deterministic.
SQL Server has several in-built system statistical functions returning the system-related statistics. Below is the list:
- @@CONNECTIONS
- @@PACK_RECEIVED
- @@CPU_BUSY
- @@PACK_SENT
- @@TIMETICKS
- @@IDLE
- @@TOTAL_ERRORS
- @@IO_BUSY
- @@TOTAL_READ
- fn_virtualfilestats
- @@PACKET_ERRORS
- @@TOTAL_WRITE
Now, let’s explore them deeper.
Understanding @@CPU_BUSY and @@TIMETICKS System Functions
@@CPU_BUSY is crucial when we need to understand how much time in milliseconds CPU has spent working on SQL Server operations. The result of this function is incremental every time you run it since the last restart of SQL Server. It means that for each run we get an incremental value in the output. See the example:
--Execute below T-SQL to get how busy your CPU is
SELECT @@CPU_BUSY
The output:
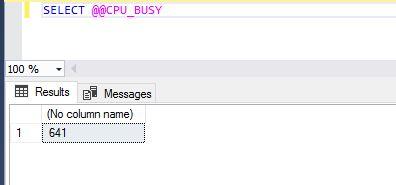
It returns a single numeric value meaning that the CPU has spent 641 milliseconds on running the SQL Server transactions since the last SQL Server service restart.
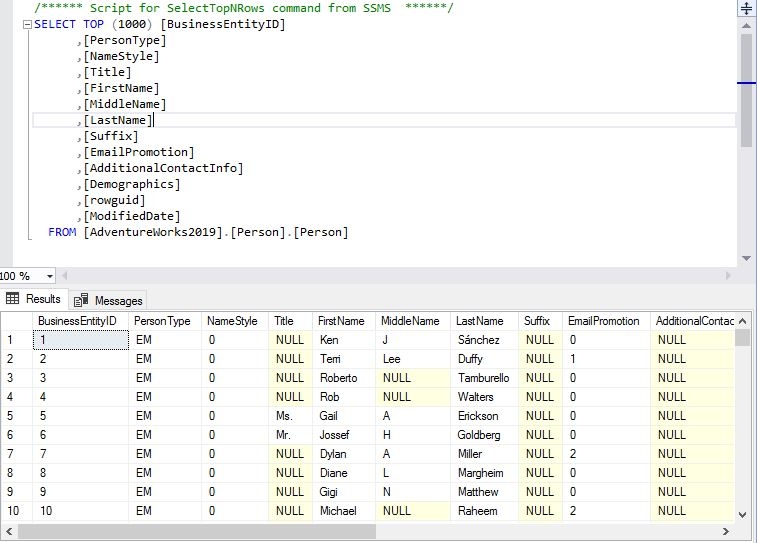
Now, let’s execute a simple SELECT statement. I will run the above T-SQL statement again to verify whether the output is incremental.
--Fetch top 1000 rows for a table
SELECT TOP (1000) [BusinessEntityID]
      ,[PersonType]
      ,[NameStyle]
      ,[Title]
      ,[FirstName]
      ,[MiddleName]
      ,[LastName]
      ,[Suffix]
      ,[EmailPromotion]
      ,[AdditionalContactInfo]
      ,[Demographics]
      ,[rowguid]
      ,[ModifiedDate]
  FROM [AdventureWorks2019].[Person].[Person]
The output:
Let’s run SELECT @@CPU_BUSY again to see its output:
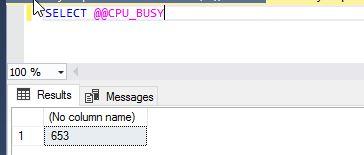
Here, we can see an incremental value of 653 milliseconds as compared to the 641 milliseconds value returned in the first screenshot. Therefore, we have validated that these system functions return single incremental values.
Now, let’s dive deeper. We are going to check how to use @@CPU_BUSY in various scenarios for our requirements.
As stated above, the @@CPU_BUSY system function returns output in milliseconds. If you want to get its output in microseconds, you need to use the @@TIMETICKS function while running the @@CPU_BUSY T-SQL statement (see the below commands).
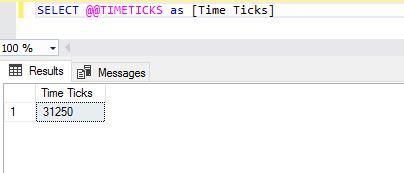
@@TIMETICKS returns the number of microseconds per tick.
Tick is a kind of scheduling event which causes the schedulers to run. The amount of time per tick is the computer-dependent value which can be fetched by running the below T-SQL statement:
--Get @@TIMETICKS output
SELECT @@TIMETICKS
Here is its output:
We will use both functions together to get their output in microseconds and seconds:
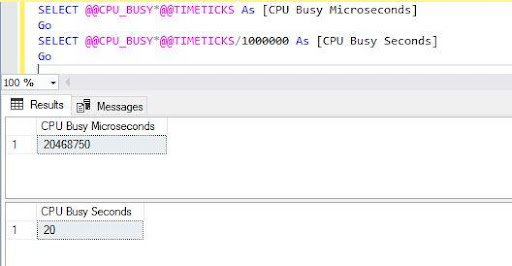
--Get @@CPU_BUSY output in Microseconds & seconds
SELECT @@CPU_BUSY*@@TIMETICKS As [CPU Busy Microseconds]
Go
SELECT @@CPU_BUSY*@@TIMETICKS/1000000 As [CPU Busy Seconds]
Go
After executing both T-SQL statements, we can see the outputs:
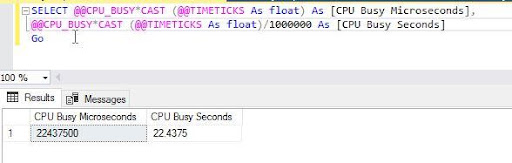
Note: If you have a requirement to get the @CPU_BUSY output in a float data type, you can also get it done by running the below set of statements:
--Get @@CPU_BUSY output in Microseconds & seconds with float data type
SELECT @@CPU_BUSY*CAST (@@TIMETICKS As float) As [CPU Busy Microseconds],
@@CPU_BUSY*CAST (@@TIMETICKS As float)/1000000 As [CPU Busy Seconds]
Go
The output:
Go ahead and use the @@CPU_BUSY & @@TIMETICK system functions as per your business need.
Understanding @@IO_BUSY System Function
As its name suggests, this system function returns the total time in milliseconds that the SQL Server has spent performing IO operations (Input\Output operations) since the last restart of SQL Server. The output of this system function is also incremental every time you run it.
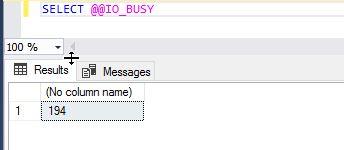
Run the below T-SQL statement:
--Get total time SQL Server has taken in IO operations since its last restart
SELECT @@IO_BUSY
The output in the below image is 194 milliseconds.
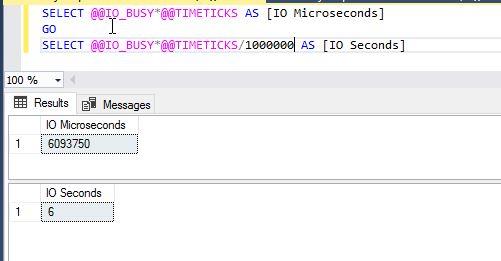
We can also use the @@TIMETICKS system function to get the value in microseconds:
--Get total time SQL Server has taken in IO operations since its last restart
SELECT @@IO_BUSY*@@TIMETICKS AS [IO Microseconds]
GO
SELECT @@IO_BUSY*@@TIMETICKS/1000000 AS [IO Seconds]
Here is the output of the above T-SQL statement:
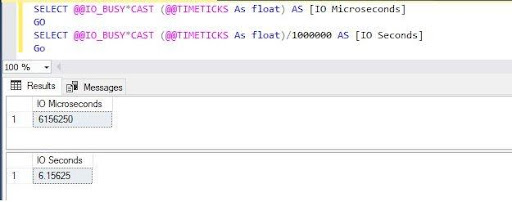
If you want to avoid arithmetic overflow while converting the value to microseconds using the @@TIMETICKS system function, run the below command to get its output in a float data type as we have done for the @@CPU_BUSY function earlier:
--Get total time SQL Server has taken in IO operations since its last restart
SELECT @@IO_BUSY*CAST (@@TIMETICKS As float) AS [IO Microseconds]
GO
SELECT @@IO_BUSY*CAST (@@TIMETICKS As float)/1000000 AS [IO Seconds]
Go
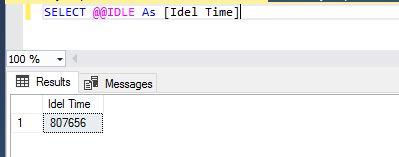
Understanding @@IDLE System Function
This system function returns the time in milliseconds for the SQL Server idle status since the last restart. Run the below command:
--Get total time SQL Server was idle
SELECT @@IDLE
Here is the output:
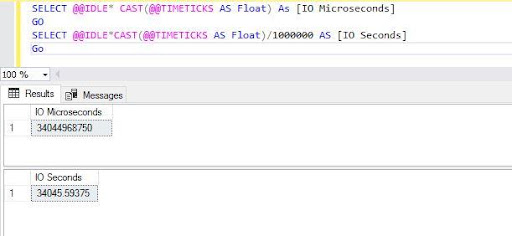
You can also use the GETDATE() function along with all the above system functions to get their value between the current time and the time when SQL Server restarted. If you want to get this value in microseconds, use the @@TIMETICKS function as shown for @@CPU_BUSY and @@IO_BUSY functions.
The below T-SQL statement is very much similar to the previous examples. It returns the number of seconds and microseconds in a float data type.
--Get total time SQL Server was idle
SELECT @@IDLE* CAST(@@TIMETICKS AS Float) As [IO Microseconds]
GO
SELECT @@IDLE*CAST(@@TIMETICKS AS Float)/1000000 AS [IO Seconds]
Go
The output:
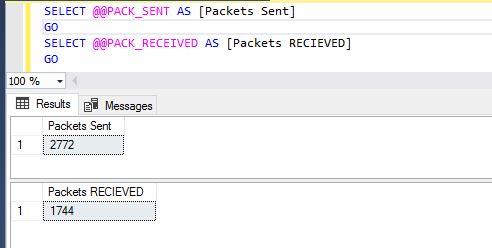
Understanding @@PACK_SENT, @@PACK_RECEIVED, and @@PACKET_ERRORS
These system statistical functions relate to network packets. They are extremely useful in analyzing the information on network packets.
- @@PACK_SENT – returns the number of output packets written to the network by SQL Server since the last restart.
- @@PACK_RECEIVED – displays the number of input packets read from the network by SQL Server since the last restart.
- @@PACKET_ERRORS – displays the number of network packet errors that occurred on SQL Server connections since the last restart.
We can use the below T-SQL statements to get the number of input and output packets to read or written by SQL Server.
--Get the number of packets received or sent
SELECT @@PACK_SENT AS [Packets Sent]
GO
SELECT @@PACK_RECEIVED AS [Packets RECIEVED]
GO
The details about these packets are in the output:
You can also run @@PACKET_ERRORS similarly to get the total number of packet errors:
--Get number of packets Errors
SELECT @@PACKET_ERRORS
Understanding @@TOTAL_READ, @@TOTAL_WRITE and @@TOTAL_ERRORS
The disk-related system statistical functions get the number of the disk reads, disk writes, and disk write errors that SQL Server has performed.
- @@TOTAL_READ – displays the number of disk reads by SQL Server since the last restart.
- @@TOTAL_WRITE – displays the number of disk writes by SQL Server since the last restart.
- @@TOTAL_ERRORS – displays the number of the disk write errors by SQL Server since the last restart. Remember, non-fatal write errors are not captured by this function – they are handled by the system itself.
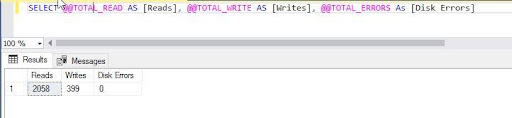
I have clubbed all 3 system functions in one T-SQL statement to display the output of them all in one shot:
--Get Disk related statistics
SELECT @@TOTAL_READ AS [Reads],
@@TOTAL_WRITE AS [Writes],
@@TOTAL_ERRORS As [Disk Errors]
Below you can see the number of disk reads, writes, and write errors:
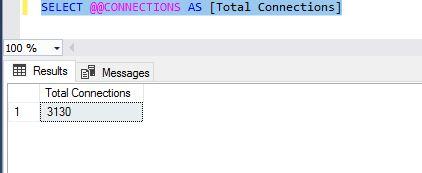
Understanding @@CONNECTIONS System Function
This system function displays the total number of attempts to connect to SQL Server irrespective of their success since the last restart of SQL Server. Run the below T-SQL statement:
--Get the number of attempted connections
SELECT @@CONNECTIONS AS [Total Connections]
The below output shows that the total number of attempted connections is 3130 for this SQL Server instance. It does not mean that all 3130 attempts were successful.
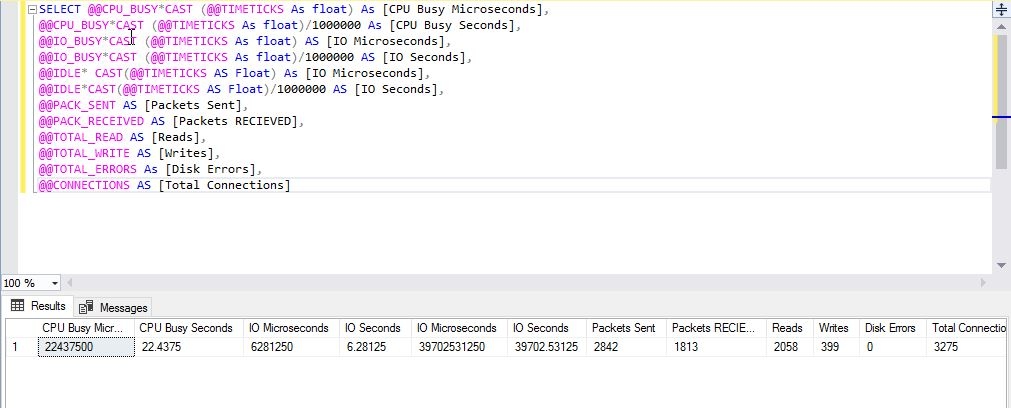
All System Statistical Functions in One T-SQL Statement
We can also combine all these system functions in one T-SQL statement and get a single output for each system statistics value. I have explained each of the system functions separately because these might be very useful for your work needs and requirements.
Run the below T-SQL script to get the output of all the described system statistics in one shot:
--Get system statistics
SELECT @@CPU_BUSY*CAST (@@TIMETICKS As float) As [CPU Busy Microseconds],
@@CPU_BUSY*CAST (@@TIMETICKS As float)/1000000 As [CPU Busy Seconds],
@@IO_BUSY*CAST (@@TIMETICKS As float) AS [IO Microseconds],
@@IO_BUSY*CAST (@@TIMETICKS As float)/1000000 AS [IO Seconds],
@@IDLE* CAST(@@TIMETICKS AS Float) As [IO Microseconds],
@@IDLE*CAST(@@TIMETICKS AS Float)/1000000 AS [IO Seconds],
@@PACK_SENT AS [Packets Sent],
@@PACK_RECEIVED AS [Packets RECIEVED],
@@TOTAL_READ AS [Reads],
@@TOTAL_WRITE AS [Writes],
@@TOTAL_ERRORS As [Disk Errors],
@@CONNECTIONS AS [Total Connections]
Here is the output of the above script which shows all the statistics-related information in one output:
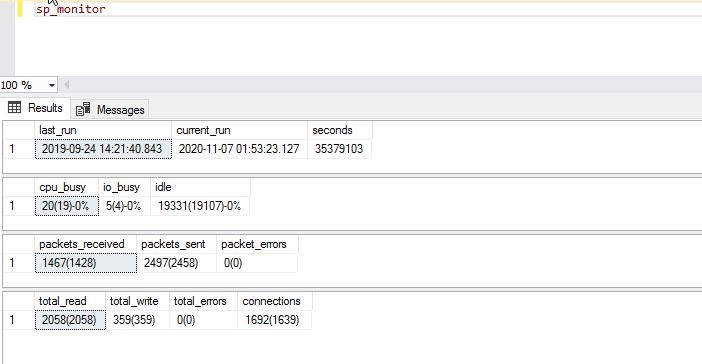
Using Stored Procedure for Getting SQL Server Statistics
There is also a dedicated Microsoft system stored procedure that allows us to see a similar view of the system statistics. The name of this stored procedure is sp_monitor. It is excellent for tracking the usages and values of each SQL Server statistics type since the last run by the same stored procedure
Note: You need to have the sysadmin role to execute this stored procedure.
I have executed the sp_monitor stored procedure – see its out is showing in a specific form like value(value)-value% or value(value). We can see the cpu_busy output showing as 20(19)-0%. Now, you might think about how we can read this output. Read and understand the below table – it presents the explanation for both output types:
| System Parameter | Output | Interpretation |
| Cpu_busy | 20(19)-0% | CPU was busy 20 seconds since SQL Server was last started\restartedCPU was busy 19 seconds since sp_monitor was the last run0% of the total time since sp_monitor was the last run. |
| Packets_received | 1467(1428) | SQL Server has received 1467 packets since it was last started\restartedSQL Server has received 1428 packets since sp_monitor was executed last time. |
Conclusion
Now you can see how to get the system-related statistics for your SQL Server instance. The system functions and stored procedure sp_monitor will be very efficient and convenient. Go ahead and use these T-SQL codes in your development work or for system analysis activities.
Please share this article on your favorite social networks. And if you want to discuss this information and share your opinions and tips, you are welcome to the Comments section.
Tags: statistical functions, system statistics, t-sql scripts Last modified: March 31, 2023