
The time intelligence functions for the data models or databases running behind a Power BI report are really helpful. To make the most use of them, we can create a Date table on the Power BI desktop.
This article focuses on the steps required to perform this task. Also, it highlights the importance of having such Date tables for authoring the Power business intelligence (BI) reports to work as the output of a fully functional data warehouse BI solution.
About the Date Table
The story of the Date table goes back to the early days of data warehouse business intelligence solutions. Then it was decided to use a dedicated table of prepopulated dates to enhance the date and time-related analysis and reporting.
Date Dimension Table in Power BI
The true representation of the Date table is the Date dimension that comes in the context of both traditional and modern data warehouse BI solutions. The Date dimension is like a specific SQL table containing prepopulated calendar dates and some other date-related fields, such as a month, year, week, etc.
In a traditional data warehouse architecture, the Date dimension is created during the OLAP/ROLAP Cube configuration process when using Analysis Services Multidimensional Project. Refer to the article on SQL Server Business Intelligence – Traditional Tools and Technologies for information.
Add the Date table into the Scenario
In modern BI scenarios, the Date dimension is created as the Date Table in a tabular model running behind a Power BI report.
The Date Table can be created through the DAX (Data Analysis Expressions) script instantly. The primary advantage is enhancing the analytical and reporting experiences with the help of the time intelligence features and functions. It helps you to speed up the date-and-time-related queries. Also, it offers more time intelligent functions and a detailed view of the data across different periods (quarters, years, months, weeks, or days).
Without the Date Table
If you decide not to use the Date Table, then you are definitely missing a lot of time intelligence-related features and functionality.
The same is true if you are designing a Power BI report which connects to the underlying data warehouse database or the Power BI Dataset (as per modern data warehouse practices).
You will still be able to perform the date-and-time-related queries. However, you’ll need a lot of coding effort to do so. There is no reason for not using Date Tables and their many handy built-in features.
Date Table in Power BI Desktop
To create the Date Table in a Power BI desktop (the Power BI report designer tool), you need first of all to ensure fulfillment of the following requirements:
- The Date table has at least one date-type column.
- The date-type column is unique.
- The date-type column is filled up completely to show a period such as a full year.
- The date-type column does not have any gaps, blanks, or Nulls in between the dates.
- Finally, the date-type column in the Date table must be defined as the Date Table in a Power BI report.
Understanding the Importance of the Date Table in Power BI
As discussed before, the Date table is pivotal in business intelligence scenarios. Without it, you cannot fully apply the time intelligence functions that come as part and parcel of the latest BI reporting solutions, including Power BI reports.
The Date table speeds up the date-and-time-related queries against the data warehouse databases or data models.
Creating the Date Table in Power BI using DAX Function
Let us explore this using a typical BI scenario.
We are importing data from the data warehouse database containing the laptop orders placed by customers over some time. Thus, we are going to add the Date table into the scenario. It allows us to take advantage of all the available time intelligence functions and speed up related requests.
Open Power BI Desktop to Create the Data Sample
First, you need to download the Power BI desktop and install it, if you have not already done that.
Our data sample contains a table LaptopSale that comes from the data warehouse database. To replicate this scenario for test purposes, we can manually enter data into the table.
Open your Power BI Desktop and click Get Date:
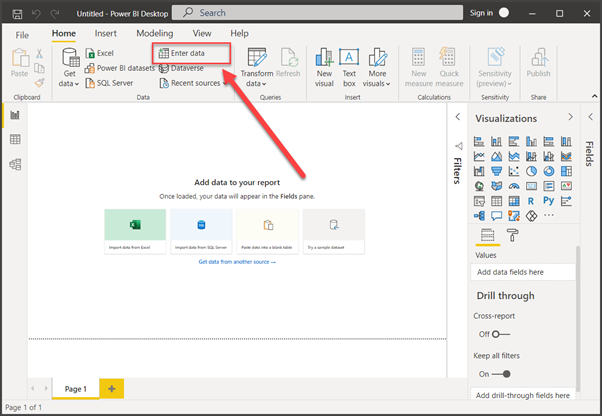
Select Enter Data from the toolbar:
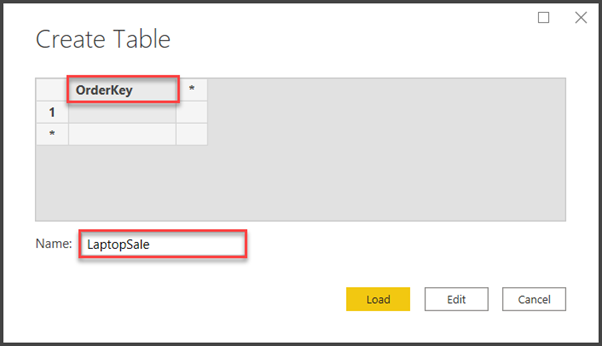
Rename Column 1 to OrderKey and rename the table to Laptop Sale:
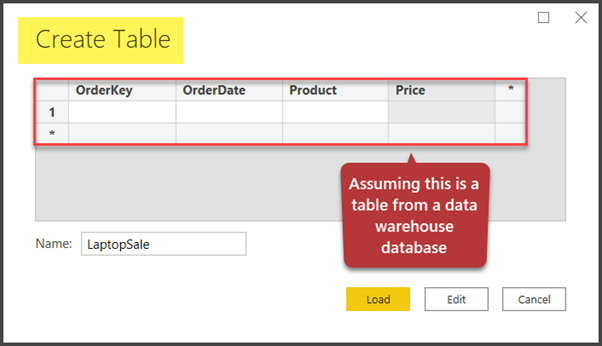
Add the following columns:
- OrderKey.
- OrderDate.
- Product.
- Price.
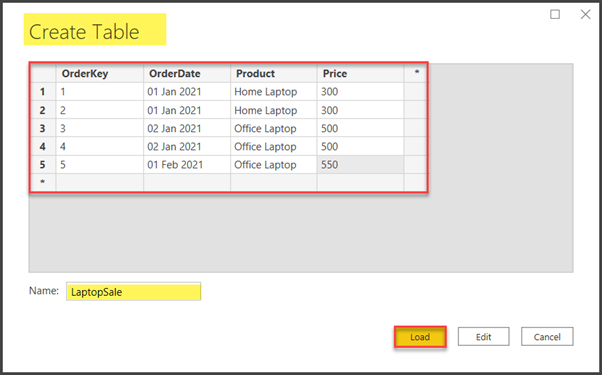
Next, populate the table as follows:
| 1 | 01 Jan 2021 | Home Laptop | 300 |
| 2 | 01 Jan 2021 | Home Laptop | 300 |
| 3 | 02 Jan 2021 | Office Laptop | 500 |
| 4 | 02 Jan 2021 | Office Laptop | 500 |
| 5 | 01 Feb 2021 | Office Laptop | 550 |
Click Load to put the entered data into the table:
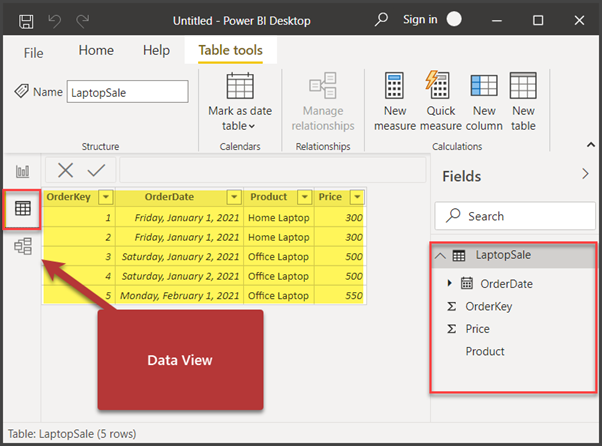
Check the Data Sample
Check the loaded LaptopSale table by clicking the Data View icon on the left:
Create a New Calendar Date Table in Power BI
As we can see, the LaptopSale table has order dates in it. We must make use of the time intelligence offered by BI solutions as the dedicated Date table.
Click New table on the toolbar on the Table Tools tab on the Ribbon:
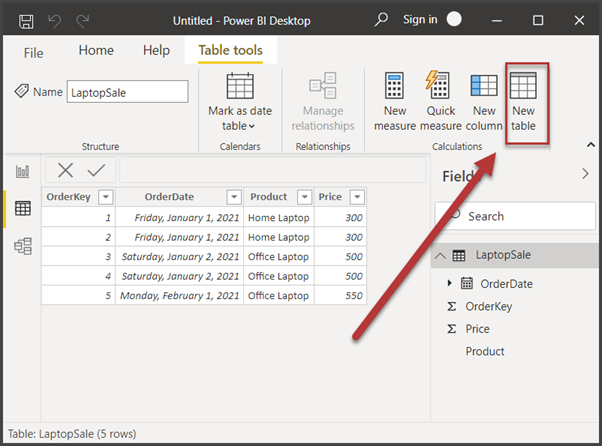
Now, start with the Date table. First, create a column of dates for the year 2021 using the CALENDAR function.
Date = CALENDAR("01 Jan 2021","31 Dec 2021")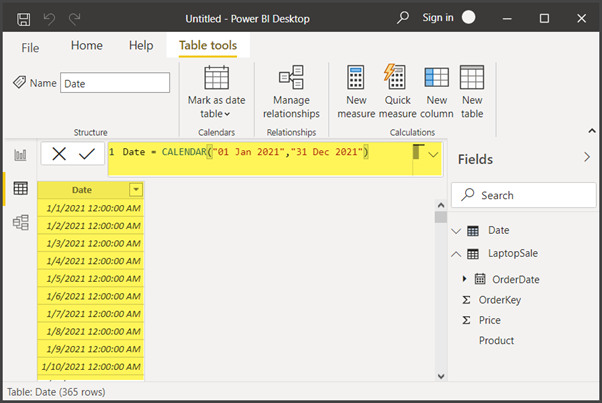
Note: You can create the Date column for any range of dates and many years to meet your requirements. However, we have decided to populate the Date table for the year 2021 based on the order dates placed that this year.
Click New Column in the toolbar and create the Year column as follows:
Year = 'Date'[Date].[Year]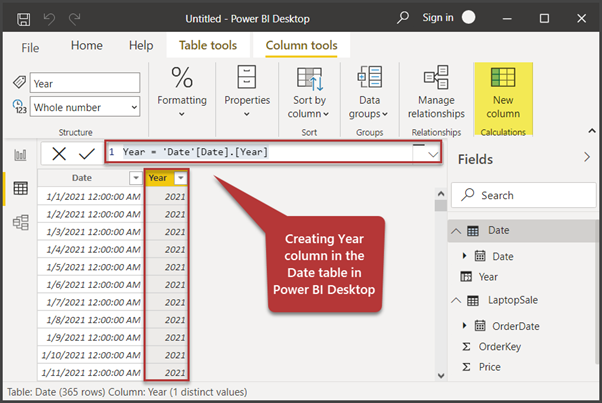
Create a new Column Quarter as follows:
Quarter = FORMAT('Date'[Date],"\Quarter Q")Next, create another new column called Month as follows:
Month = FORMAT('Date'[Date],"MMM YYYY")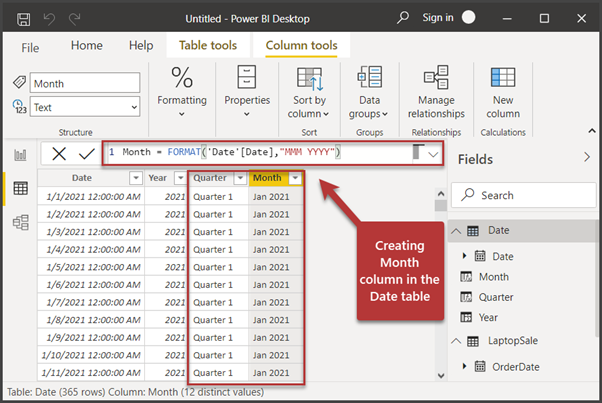
We can also create the Week Name column to have the week of the year:
Week Name = FORMAT('Date'[Date],"\Week WW")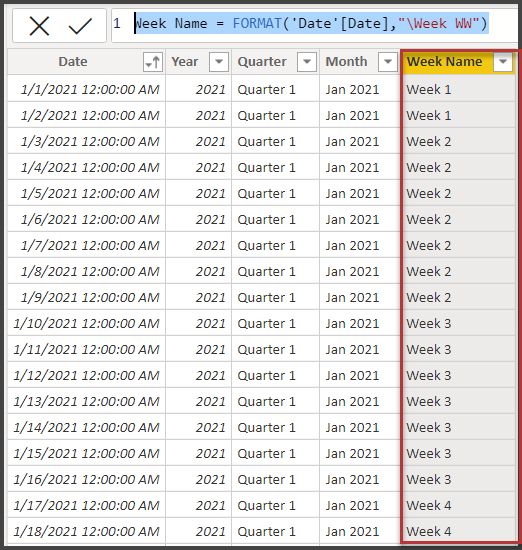
You still have to create another important column – Day. It is necessary if you want to view the data narrowed down to days:
Day = FORMAT('Date'[Date],"DD")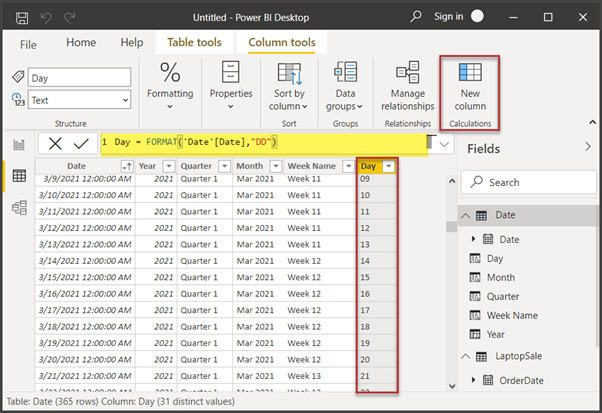
Solving the Month and Week Sorting Problem
One more thing needs to be addressed. It is implementing correct sorting of the following columns:
- Month.
- Week Name.
To understand the problem, sort the Month column in ascending order – click the arrow next to the column name and choose the required sorting order:
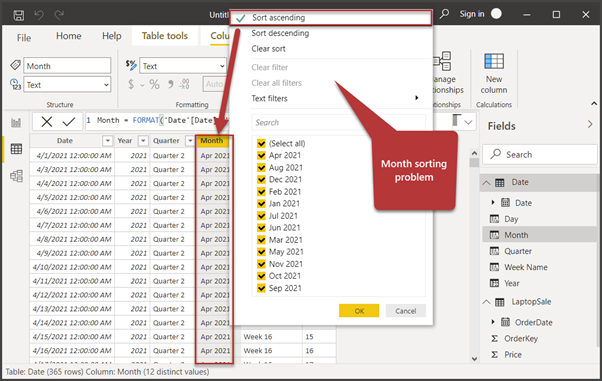
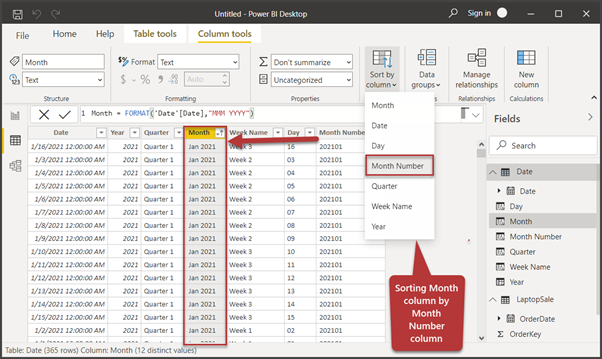
If we sort the Month column from small to large, the Month starts from April 2021, which is incorrect. To correct it, we add a new column called Month Number as follows:
Month Number = FORMAT('Date'[Date],"YYYYmm")Next, select the Month column > get to the Column tools tab > click Sort by column. Choose Month Number:
Finally, create another column called Week Number as follows:
Week Number = FORMAT('Date'[Date],"YYYYmmww")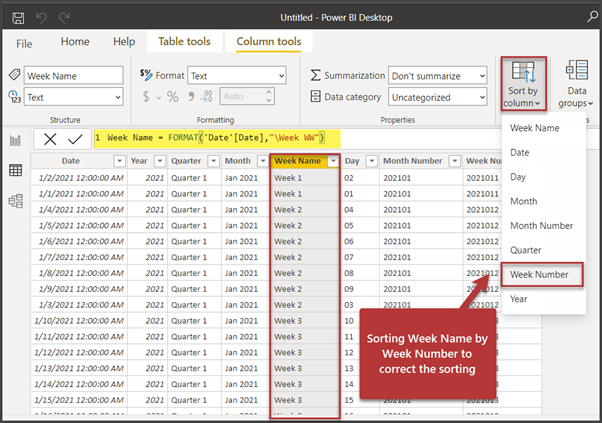
Mark the Date Table
This step is one of the most important ones to perform before you can fully utilize the Date table BI features.
We need to mark the date to declare that this is the date table.
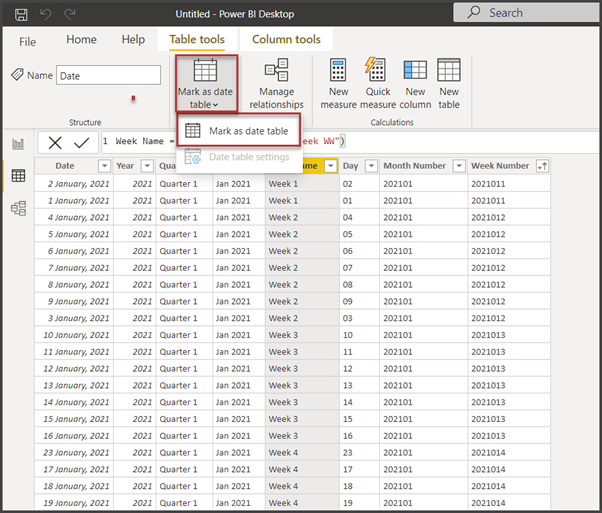
Now we can use the time intelligence functions associated with the Date table. In other words, we have a fully functional Date table at hand.
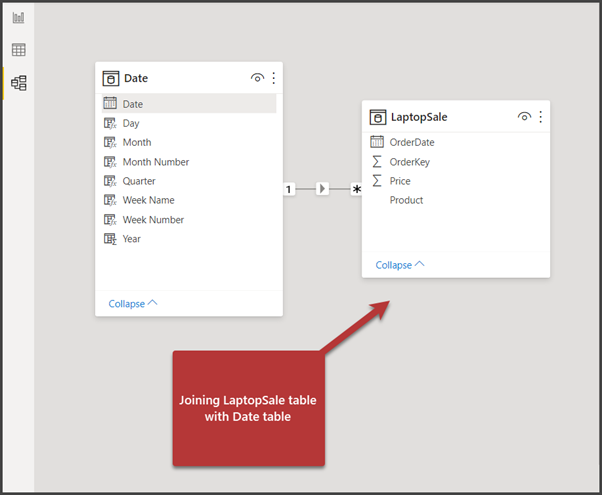
Join the Date Table with the LaptopSale Table
Go to the Model view and join the LaptopSale table with the Date table. For that, drag the OrderDate column into the LaptopSale table and drop it onto the Date column in the Date table:
The relationship properties must match the following configurations:
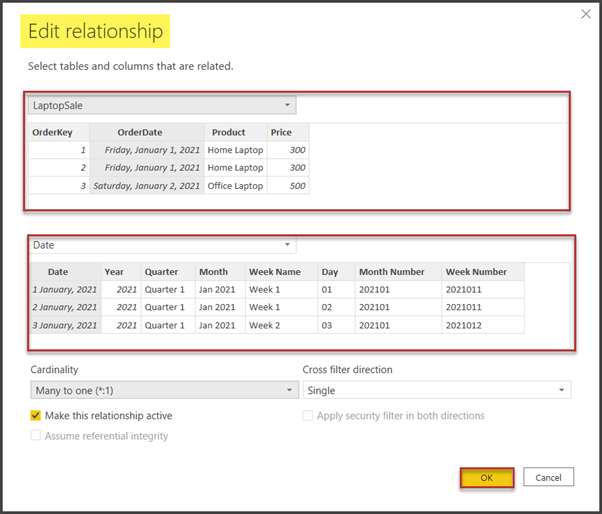
Save the Power BI report as Laptop Sales Report.
Congratulations! You have successfully created a Date Table for the Power BI report. Now we can use the time intelligence functions. Stay in touch to see how we’ll use this created Date table to serve the queries, and which interesting features and functions we get with the Date table.
Things to Do
You can try the following things to improve the skills further:
- Create a copy of the report and add five more rows to the LaptopSales table for the year 2019. Then create the Date Table from scratch. The dates range should be from 01 January 2019 to 31 December 2021.
- Create and populate the Article table mentioned in the sample SQLDevBlogV6 database in Implementing Full-Text Search in SQL Server 2016 for beginners. The add and join the Date Table for it
- Try adding a BookPublished Date column into the Book table of the BooksSample database referenced in this article. After that, populate the table as we did in this article, and add the respective Date Table.