Why are custom hierarchies Date tables essential for analysis and reporting? Let’s explore this issue. The current article focuses on the essence of custom hierarchies and using them for viewing the data in a Power BI report.
What Is a Hierarchy?
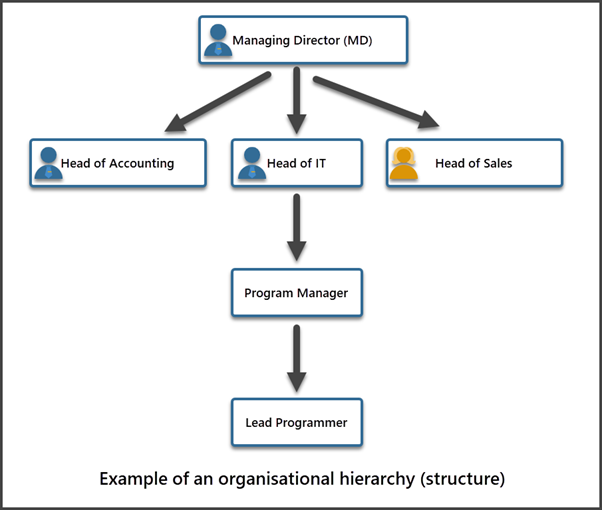
A hierarchy is a method of arranging the report data into an organizational top-down style. An item in the top-level has related sub-items in the lower levels, and so on.
For example, if you look at the business organizational structure, you find the Managing Director (MD) on the top. Below the MD, there can be several heads of departments, such as Head of Sales, Head of Accounts, Head of HR, Head of IT, etc. Under the Head of IT, you will see the Program Manager, and below there will be the Lead Programmer, and so on.
What Is a Date Hierarchy?
The Date hierarchy is a way of structuring your Date table for comfortable drilling down or drilling up the data based on different grouped time slices.
For example, you can create the Date hierarchy to put months under years and weeks under months. This allows you to view such fields as sales for the whole year. Plus, you can then drill down to the month when the sale happened in a particular year, and drill down further to a particular week of that month.
The Date Hierarchy Benefits
The Date hierarchy makes the data viewing more convenient and intuitive. It is an effective approach to speed up the report data access and restrict users from overstretching reports straight away.
Examples of Date Hierarchies
We can create different types of (custom) Date hierarchy including the following:
- Year-Month Hierarchy.
- Year-Quarter-Month Hierarchy.
- Year-Month-Week Hierarchy.
Creating Date Hierarchies in Power BI
Prerequisites
Before we proceed to the practical tasks, make sure that you have the following requirements fulfilled:
- You have the Power BI desktop installed.
- You are familiar with the Power BI reports and concepts.
- You are familiar with the Date table concept.
In the previous How to Creating Date Table in the Power BI article, we configured the Power BI report called Laptop Sales Report necessary for our further practical works. This report has the Date table populated for the year 2021 and related to the Laptop Sale table. Make sure that you have the same report ready. Refer to the previous article if needed to refresh the knowledge.
Let us do a quick check.
Open the Laptop Sales Report and switch it to the Model View:
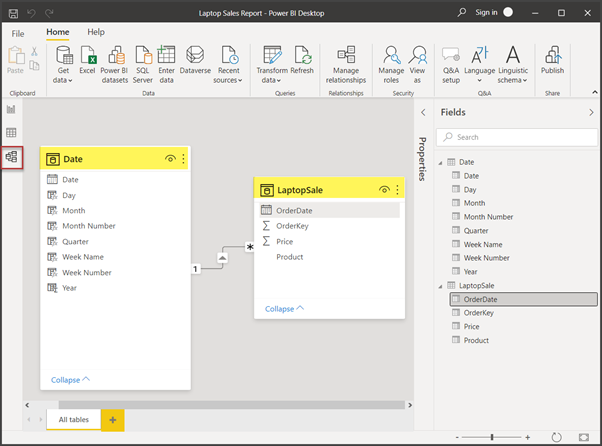
We can see the two tables joined with each other via the key. The Sales is marked as the Date table. Thus, it can leverage the features of that table.
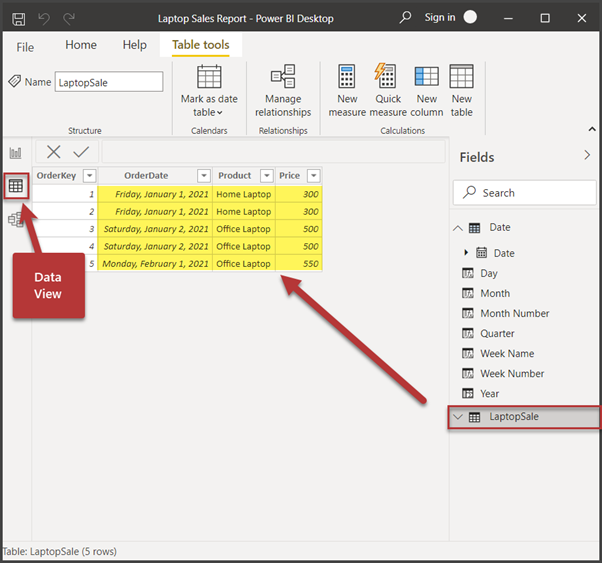
Switch to the Data view and click the Laptop Sales table to display the data:
Creating the Year-Quarter-Month Hierarchy
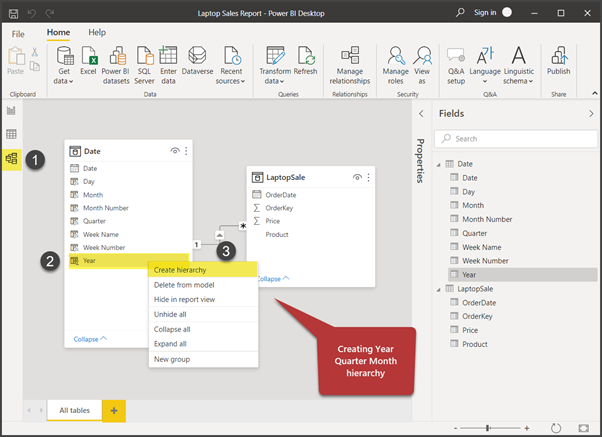
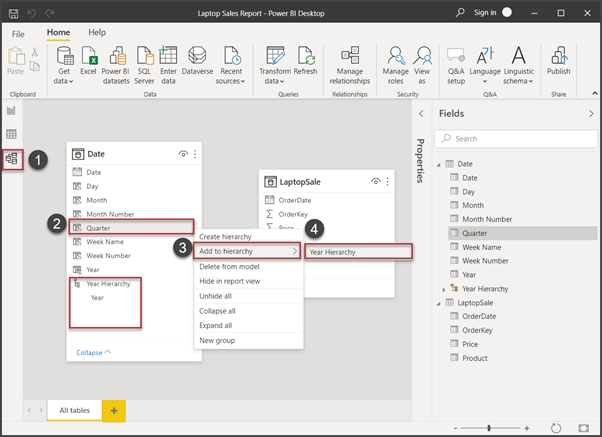
Go to the Model View in your Power BI Desktop and right-click the Year column (field). Click Create hierarchy:
Next, right-click on the Quarter field/column of the Date table.
Click Add to hierarchy > Year hierarchy:
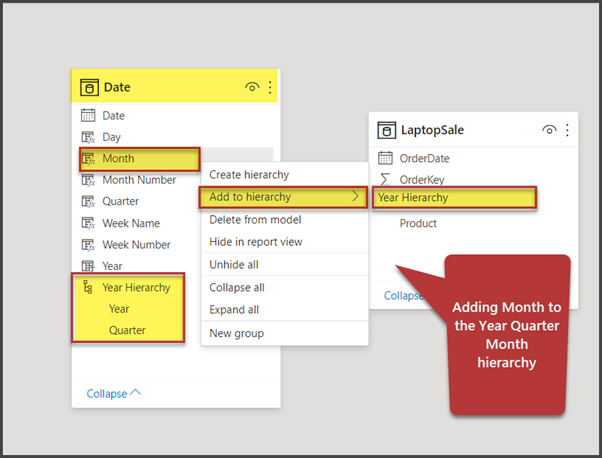
The next step adds the Month value to the existing hierarchy as follows:
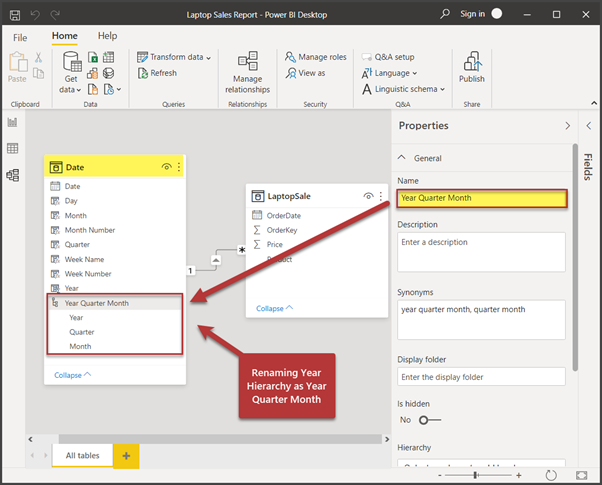
Click Year Hierarchy and set its name as Year Quarter Month under the Properties menu on the right:
Using the Year-Quarter-Month Hierarchy to View Sales
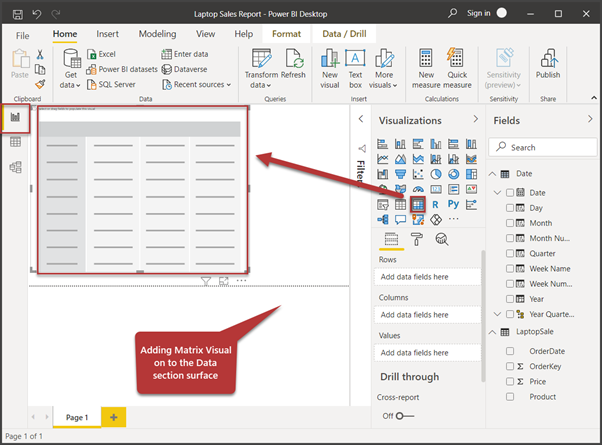
Now it is our turn to utilize the Year-Quarter-Month hierarchy. Go to the Report View in the Power BI Desktop and drag-drop the Matrix visual mode on the report designer surface as shown below:
Select the Product and Price fields from the Fields menu on the right side. You can now view the results:
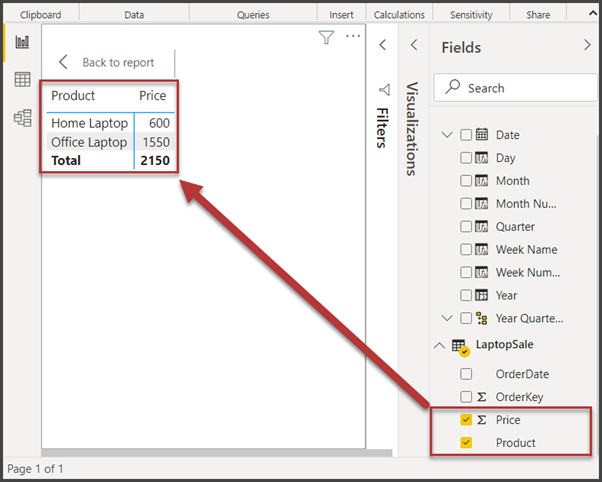
As soon as you select the Year-Quarter-Month hierarchy, you’ll see a + sign preceding the product names. It means you can drill the data down from year to quarters and from quarters to months.
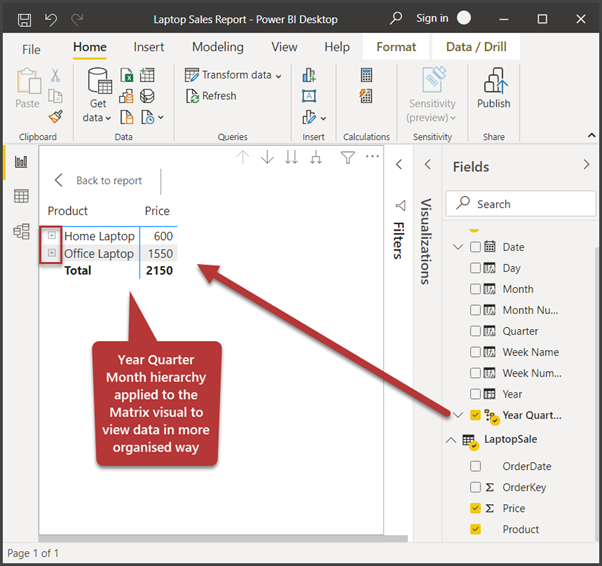
Click that plus sign to expand the Office Laptop product (node). You will see the total data for the year. Next, click the year 2021 > Quarter 1 for the details:
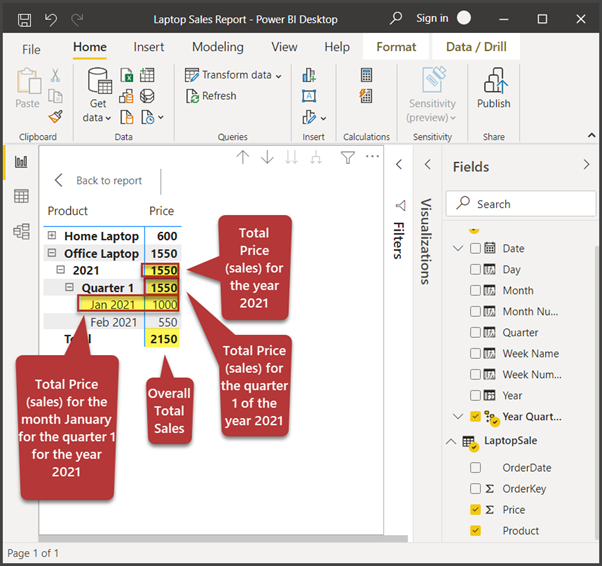
As you can see, the system provides us with a lot more information than before applying the Date hierarchy. For instance, we can see the following data break-downs:
- Overall Total Sales (Price field).
- Total Sales for the year 2021.
- Total Sales for the quarter (Quarter) 1 of the year 2021.
- Total Sales for January for quarter 1 of the year 2021.
And so on.
Creating the Year-Month-Week Hierarchy
Right-click on the Year field > Create Hierarchy> change the property name to Year-Month-Week in the Properties menu:
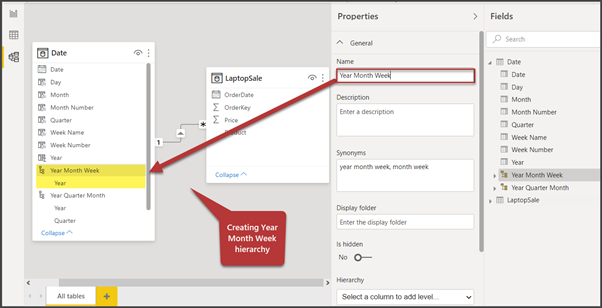
Add Month to the hierarchy:
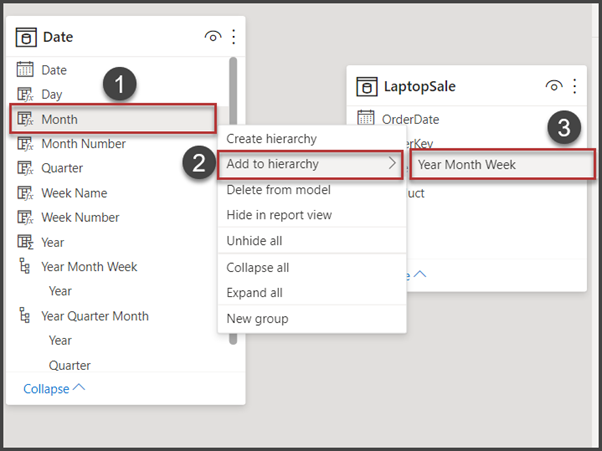
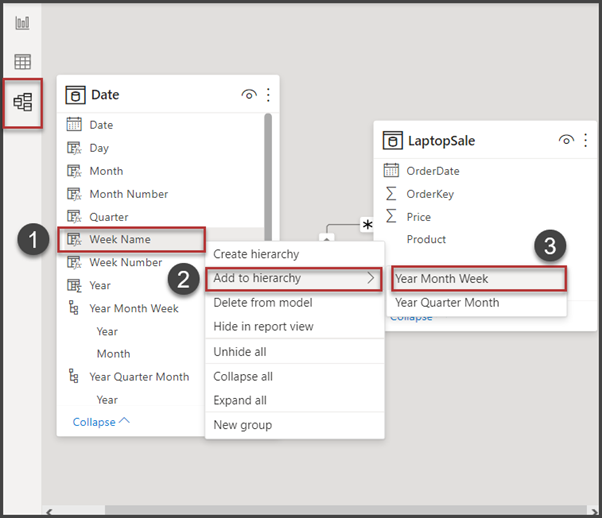
Right-click on Week Name > Add to hierarchy > Year Month Week:
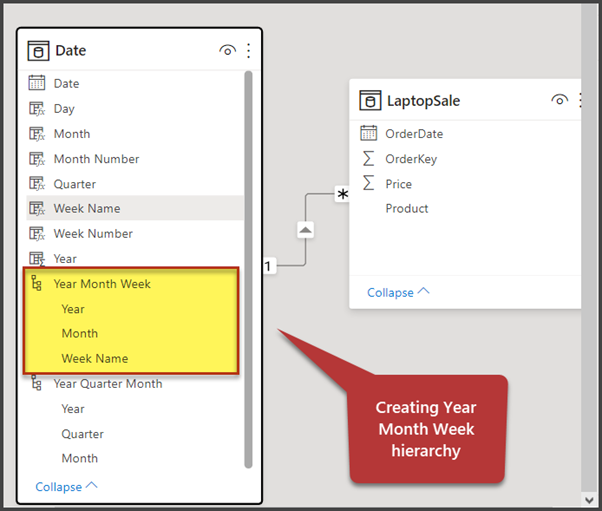
Let’s view the newly created hierarchy:
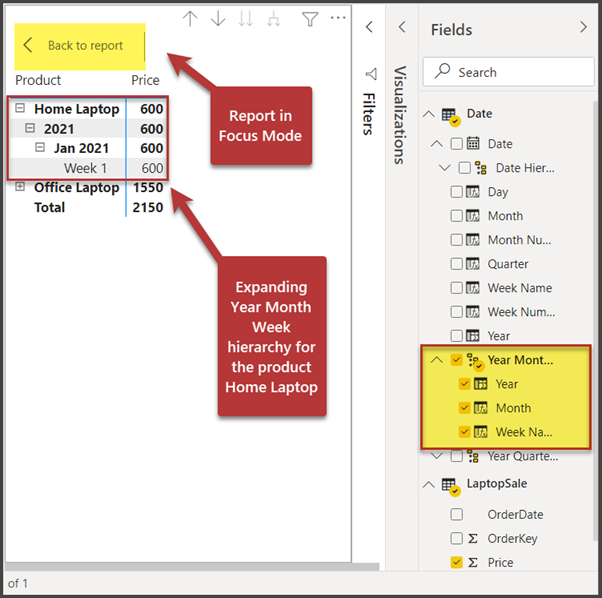
Switch to the Data View, uncheck Year Quarter Month, and check Year Month Week:
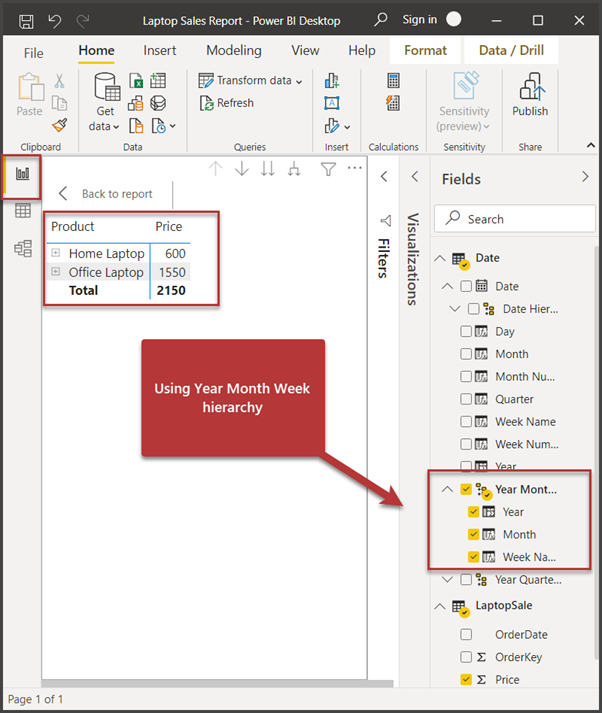
Expand Home Laptop by drilling down the sales from year to months and then from month to weeks:
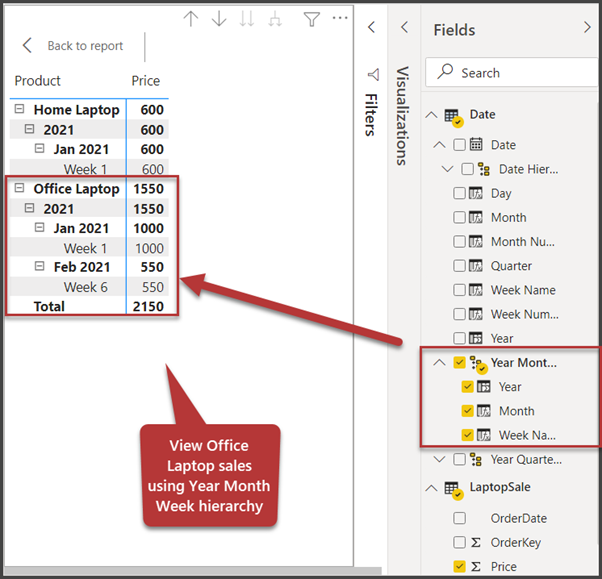
Similarly, click Plus before Office Laptop to view its sales in the date slices (year, month, and week):
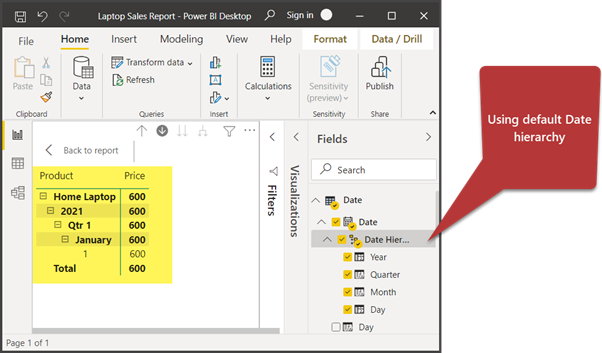
The Default Date Hierarchy
Remember that you get the default date hierarchy as soon as you create and mark the Date table. You can use it even before creating custom date hierarchies.
However, those custom date hierarchies we’ve created here will help you to cater to your business requirements more precisely.
Power BI Date Hierarchy Slicer
Power BI Date Hierarchy Slicer is a highly useful addition to Power BI which boosts its possibilities. To add a Hierarchy Slicer, go to a visualization pane and add a top level of the hierarchy. The next level can be found in the Field Box under the top-level field. Multiple levels can be added in the same way, and you can switch between them using the arrows in the Slicer.
For your comfort, the slicer can be changed to a drop-down mode or a single select. In the latter mode, you can select the whole level. The search can be also turned on by ticking it in a list.
Remove Date Hierarchy
If you want to remove a Date Hierarchy, you can go to File, select Options and Settings, click Options, then click Current File, choose Data Load, and turn off Auto Date/Time.
Congratulations! You have successfully mastered the creation and usage of the custom date hierarchies in Power BI reports. This way, you can meet your business objectives much better. Besides, you can give a more personal experience to your customers having specific preferences for the data display across time.
Things to Do
Try the following exercises to improve your skills further:
- Create and use another hierarchy named Year-Quarter-Week for the sales data.
- Try creating and using a custom date hierarchy called Year-Week-Day.
- Try to start with a new Power BI report to create and populate the Article table mentioned in the SQLDevBlogV6 sample database (refer to the article Implementing Full-Text Search in SQL Server 2016 for beginners). Then add and join the Date Table and create the custom date hierarchies.
- Try adding a BookPublished Date column into the Book table of the BooksSample database (referenced in this article). Then populate the table as we did earlier, add the respective Date Table, and create your custom date hierarchies using a new Power BI report.