There are already a number of articles and blog posts that reveal the benefits of the SQL Operations Studio tool. The demand created across the software and the related tools are relatively unimaginable than ever before. The trend and growth will continue to increase in the upcoming days.
The graphical representation is in the vogue today. Visualizing data helps us to better understand this and to make decisions. It’s no wonder that data visualization continues to attract a growing number of users. The development of any toolset could provide opportunities to speed up the software development lifecycle process.
This article demonstrates the advantages of using custom SQL queries or complex T-SQL to provide a great insight into the database and explains how one can use this insight to build custom widgets. In this case, the SQL Operations Studio Widget is a customized piece of the code to personalize the SQL Server Dashboard for effective management of SQL instances.
The more time you spend working with the tool, the more you realize that this intelligent light-weight cross-platform application can create interesting things.
In this article, you will learn the following:
- Introduction to SQL Operations Studio
- How to run a custom SQL query and view it as a chart
- How to use default and custom widgets
- Various panes and options in SSOS
- Explain the different chart options
- Create a custom insight
- Details to define a custom widget step by step
- And more…
SQL Operations Studio is a cross-platform lightweight tool for data management and administration, modern database development and operations that support SQL Server, Azure SQL DB and SQL DW from Windows, macOS, and Linux. SQL Ops Studio is a tool for both database developers and database administrators.
A widget is a small block such as a pie chart, which represents the data as a visual logical image and gives an overview to a user.
Widgets can be placed into three broad categories:
- Standard widget
- Database widget
- Server widget
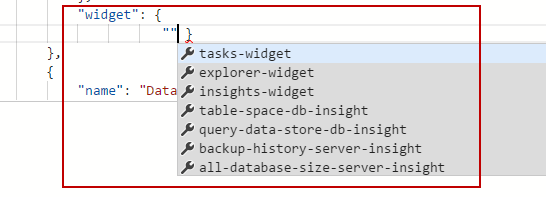
The standard widget can be further classified into three types:
- Tasks-widget
- Explorer-widget
- Insights-widget
The database widgets are divided into:
- Table-space-db-insight
- Query-data-store-db-insight
- The query store feature provides an insight into the query plan choices and its performance.
- This requires the QUERY_STORE parameter to be enabled on a database. Use the following query to enable the QUERY_STORE option.
ALTER DATABASE <DatabaseName> SET QUERY_STORE = ON
The server widget insights are:
- Backup-history-server-insight
- All-database-size-server-insight
How to add a default database-server insight widget to the dashboard
We can add insight widgets such as “table-space-db-insight”, “query-data-store-db-insight”, “Backup-history-server-insight“ and “All-database-size-server-insight” to “dashboard.database.widgets” in user settings.
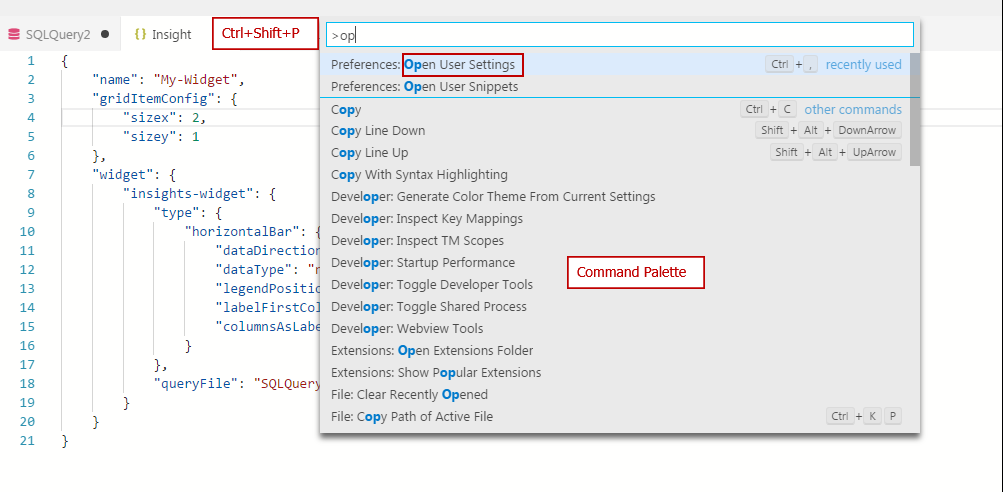
- To open user settings, press Ctrl+Shift+P.
- In the command palette that appears, type Open User settings.

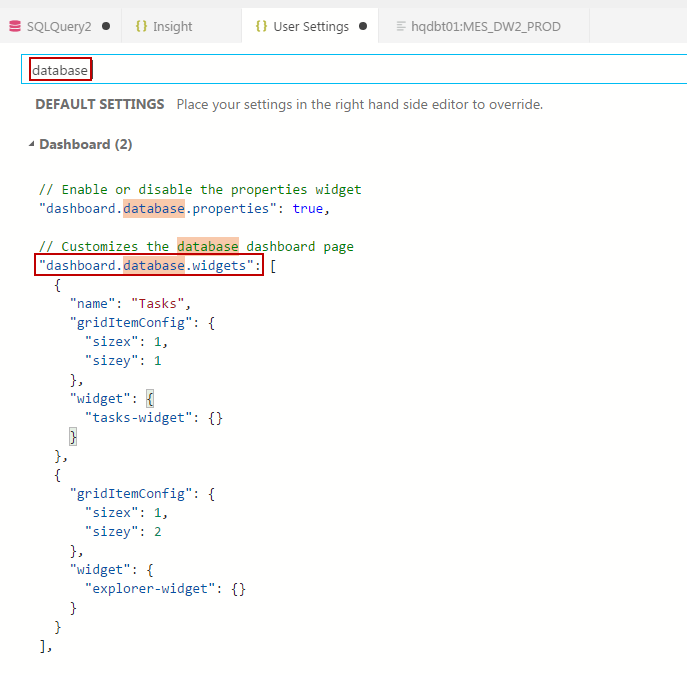
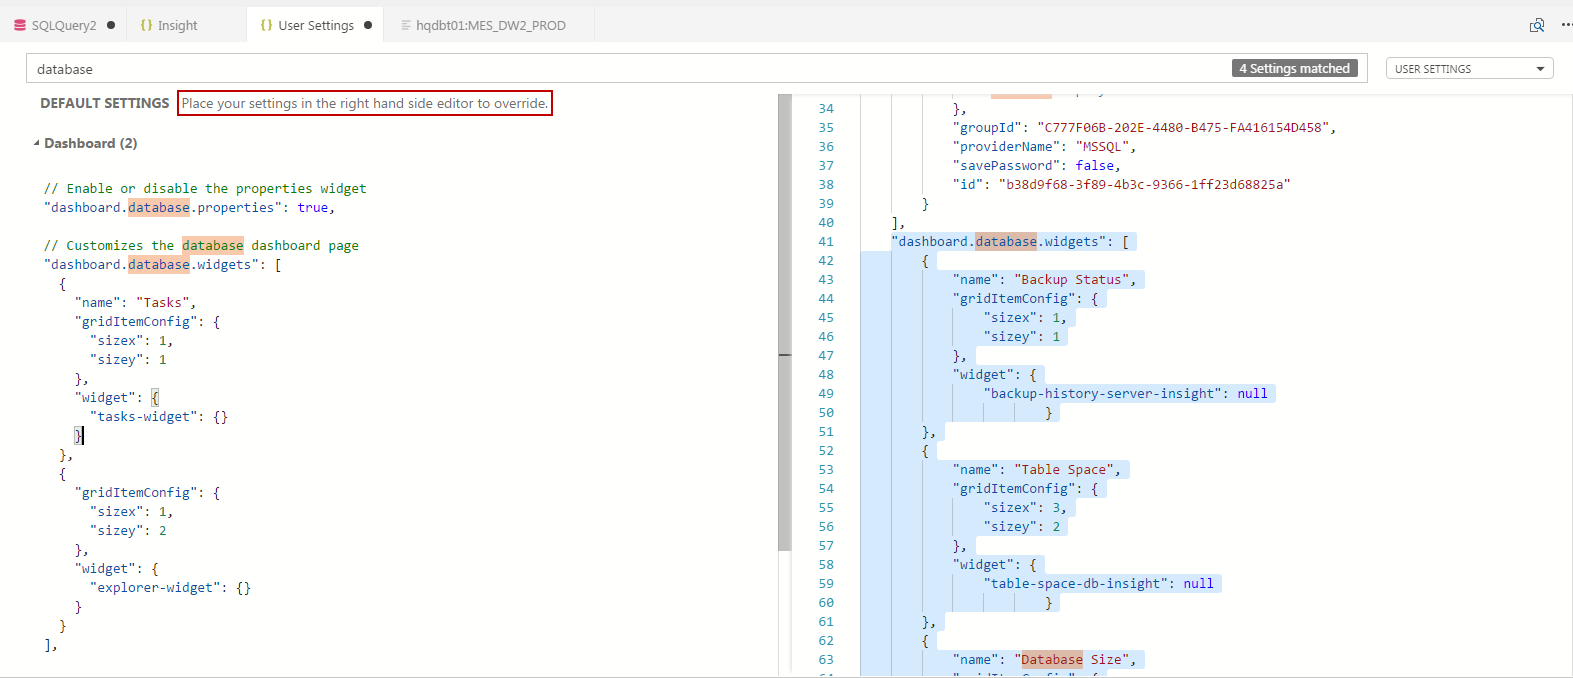
- In the User settings search box, type database to locate a database widget.

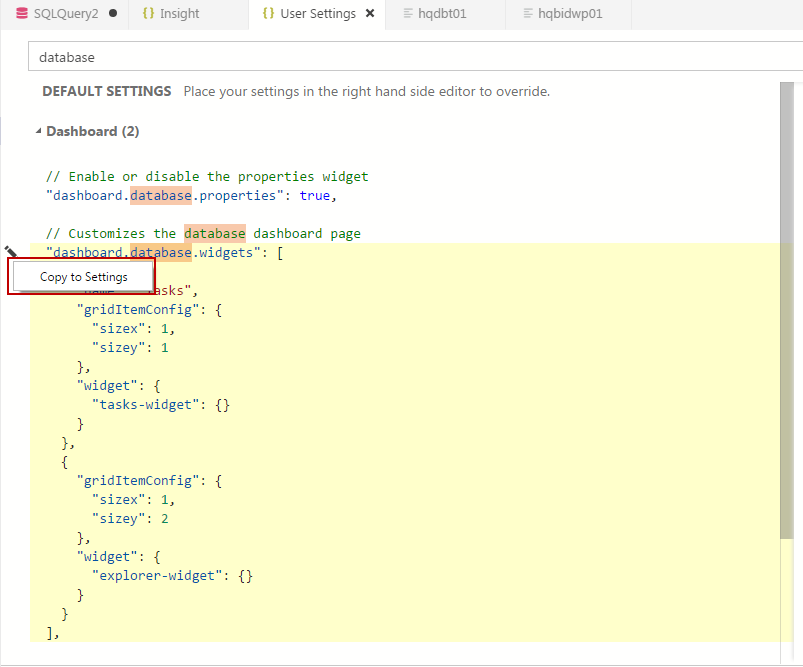
- To customize the database widget dashboard, click the edit icon to the left of the text and select the Copy to Settings option.

- The database dashboard settings are copied to the right half of the user settings.
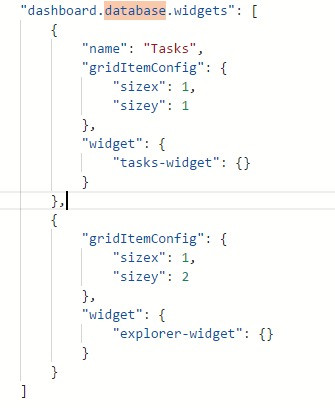
- Now, edit the JSON tags with the corresponding entries. These properties will appear on the dashboard.database.widgets settings.

 For example, copy and paste the following JSON items as shown above into the default database insight widgets.
"dashboard.database.widgets": [ { "name": "Backup Status", "gridItemConfig": { "sizex": 1, "sizey": 1 }, "widget": { "backup-history-server-insight": null } }, { "name": "Table Space", "gridItemConfig": { "sizex": 3, "sizey": 2 }, "widget": { "table-space-db-insight": null } }, { "name": "Database Size", "gridItemConfig": { "sizex": 1, "sizey": 1 }, "widget": { "all-database-size-server-insight": null } }, { "name": "Query DataStore", "gridItemConfig": { "sizex": 1, "sizey": 1 }, "widget": { "query-data-store-db-insight": null } } ] - Press Ctrl+S to save the user settings.
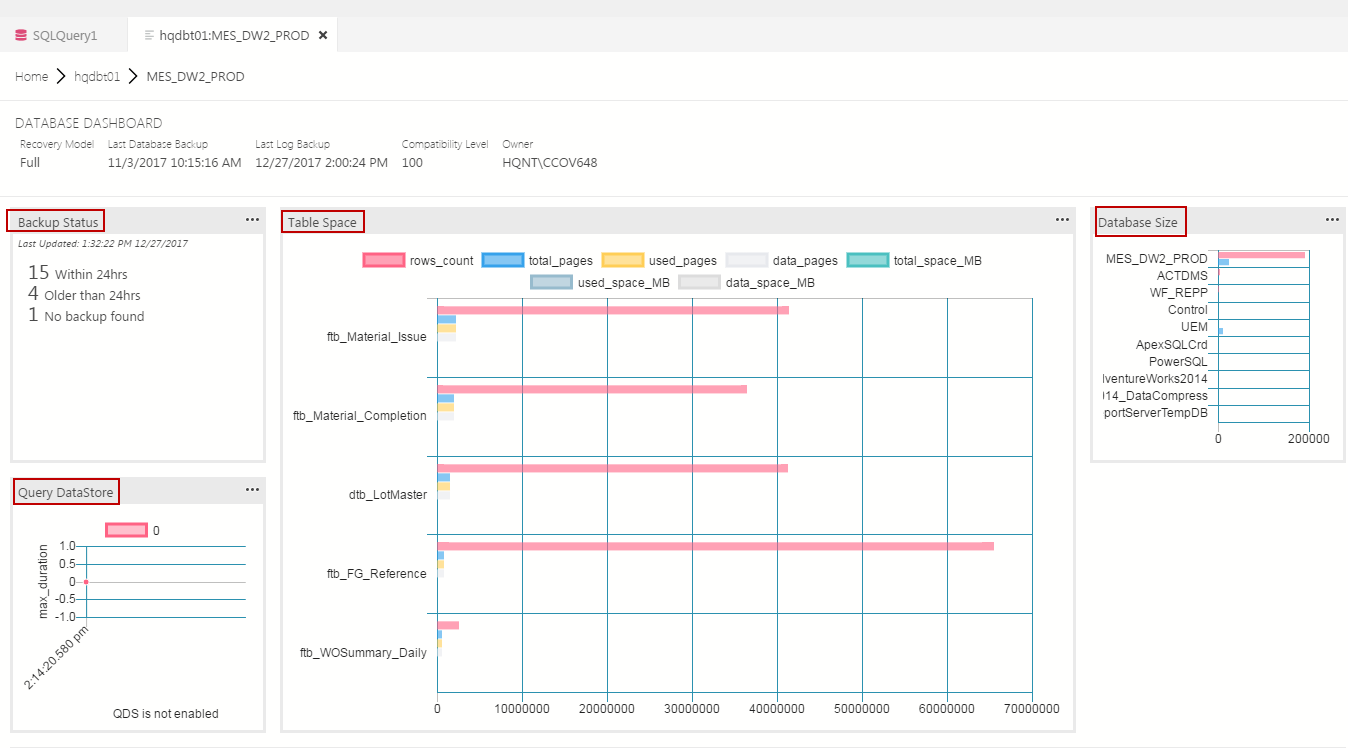
- To open the database dashboard, right-click the database and click Manage.
- You can see the default database widgets dashboard. In this case, the QDS is not enabled on the database. Hence, the output displays “QDS is not enabled”.

 For example, copy and paste the following JSON items as shown above into the default database insight widgets.
How to add a custom database insight widget to the dashboard
The first step in preparing the custom widget is to create a SQL query that can be a simple query or a complex T-SQL script. In this case, we are going to work with complex database growth statistics or T-SQL script. You can find the script in the Appendix (A) section.
The steps are very simple and interesting too! Let’s follow them to create a custom database widget.
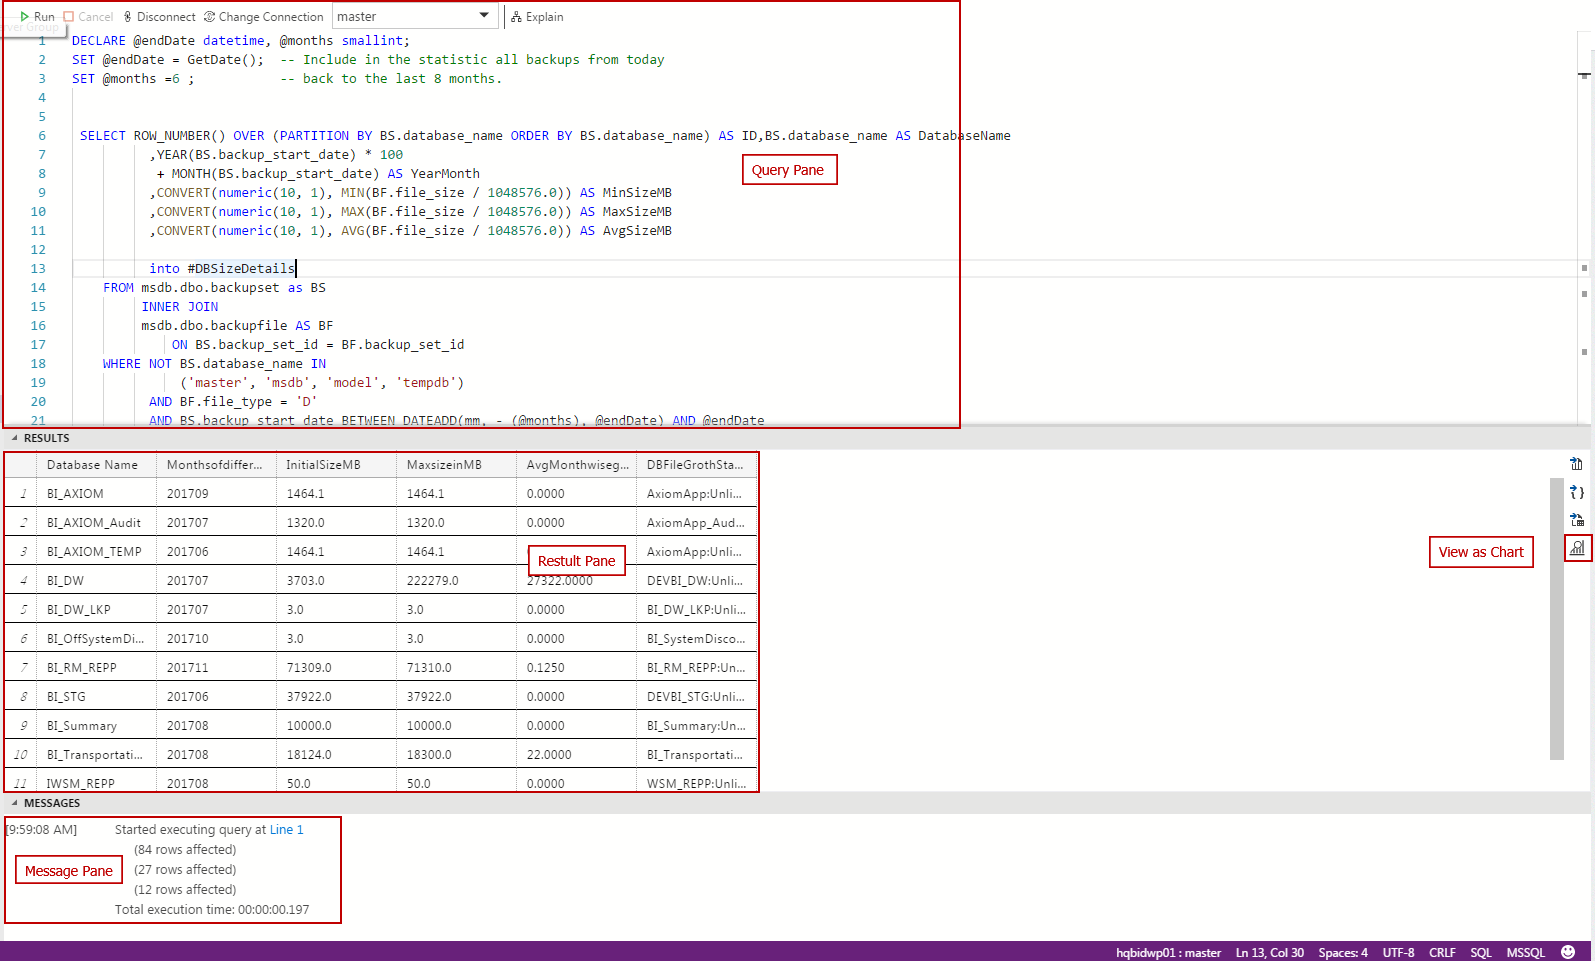
- On the query pane of the new query window (Ctrl+N), prepare the SQL query.
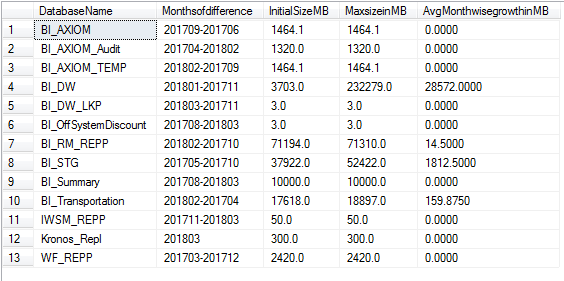
- Run (F5) the SQL query and validate the result in the results pane.
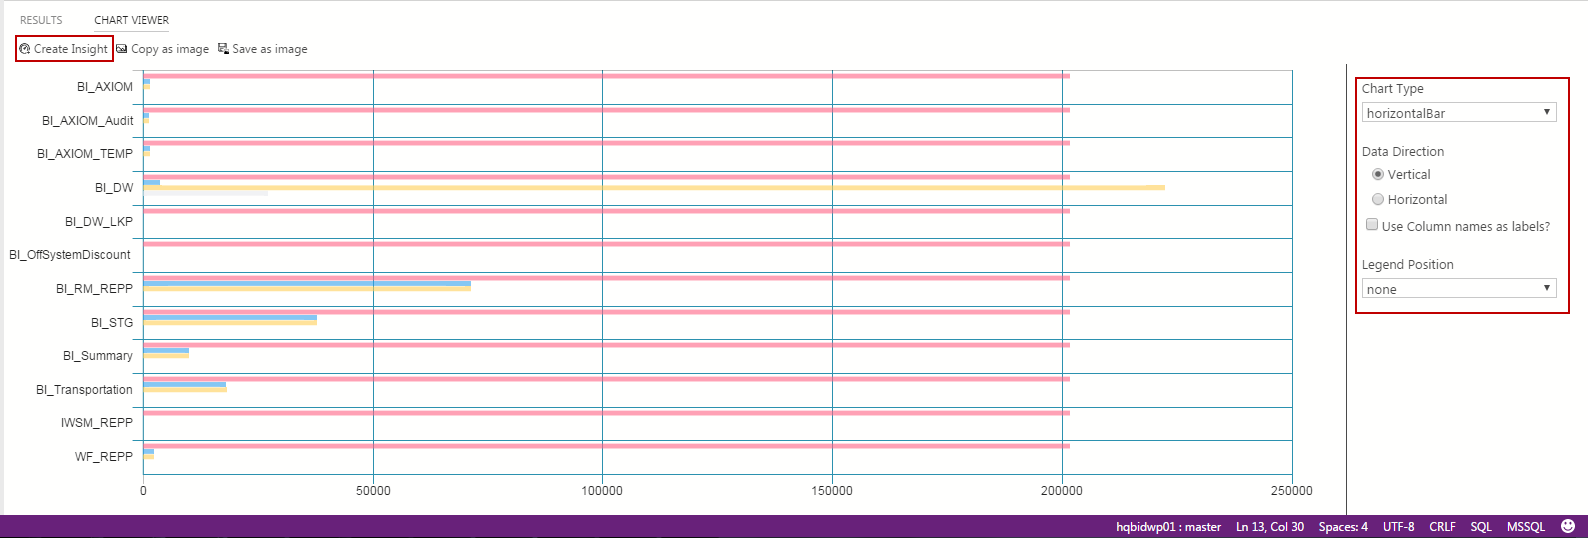
- In the results pane, click View as chart to create insights.

- Customize the chart according to your requirements. We can adjust the output by changing the orientation, adding a legend or by choosing the chart type. It’s very simple to customize the output to make it look more meaningful.

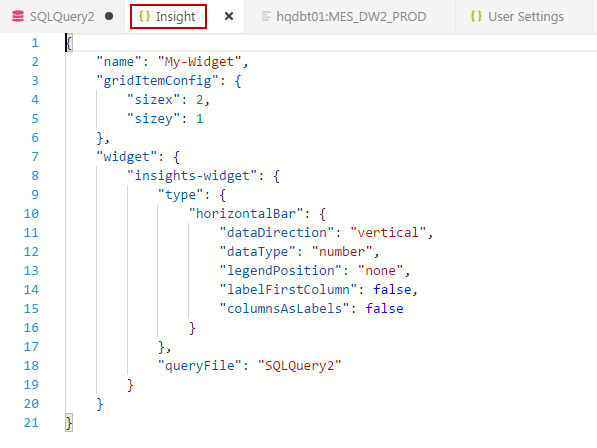
- Now, click the Create Insight button on Chart Viewer to generate the JSON.

- Save the query and call it c:\SQL2014\dbGrowthSqlQuery.sql.
- To add the JSON data to the database dashboard widget, copy the code into User Settings.
- To open user settings, press Ctrl+Shift+P.
- In the search box, type Open User settings.
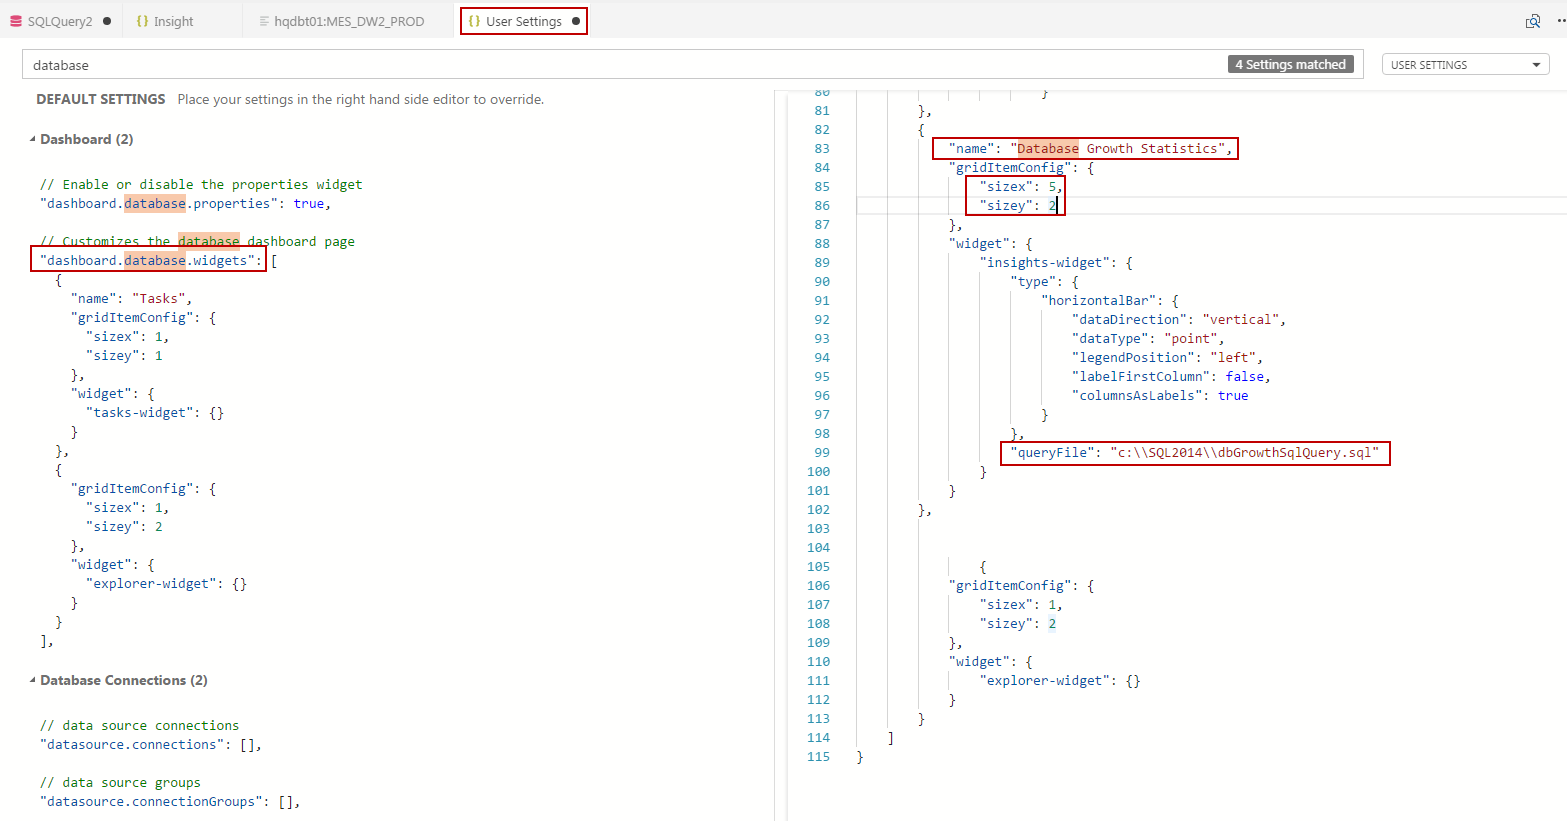
- Search for the keyword – “database”.
- Select database.widgets.
- On the split screen, add the JSON data.
- Modify or customize the highlighted JSON tags.

{ "name": "Database Growth Statistics", "gridItemConfig": { "sizex": 5, "sizey": 2 }, "widget": { "insights-widget": { "type": { "horizontalBar": { "dataDirection": "vertical", "dataType": "point", "legendPosition": "left", "labelFirstColumn": false, "columnsAsLabels": true } }, "queryFile": "c:\\SQL2014\\dbGrowthSqlQuery.sql" } } } - Press Ctrl+S to save your user settings.
- Open the database dashboard by right-clicking the database and selecting Manage.
- Now, we can see the dashboard representing the database growth statistics.

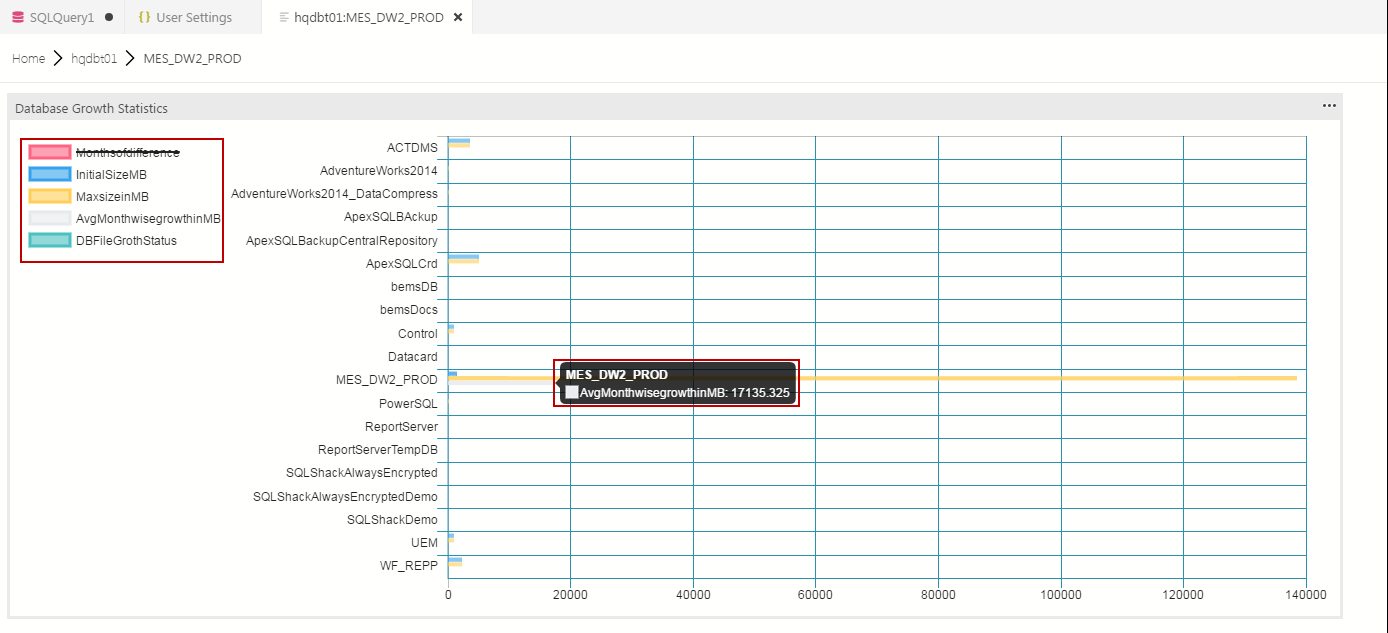
The other advantage is that you can remove the columns without the need to redefine the code.
That’s all for now!
Wrapping Up
In this article, we discussed how to configure a various default database and server widget insights. Also, the article highlights the steps to add a custom SQL as a part of the dashboard. We saw how simple it is to define and customize the dashboard. While SSMS is still the de-facto tool compatible with SQL Server instances, it’s more of an integrated environment. When you just want to play with SQL or create light widgets, SQL Operations Studio has several advantages over the SQL Server Management Studio.
As it’s available on Linux and easy to be integrated with PowerShell, it’s becoming a promising SQL toolset for many developers and administrators alike.
What do you think? Give it a download if you haven’t, and feel free to comment below.
References
https://docs.microsoft.com/en-us/sql/sql-operations-studio/tutorial-build-custom-insight-sql-server
https://docs.microsoft.com/en-us/sql/sql-operations-studio/tutorial-qds-sql-server
https://docs.microsoft.com/en-us/sql/sql-operations-studio/tutorial-table-space-sql-server
Appendix (A)
The T-SQL shows how to fetch the growth metrics of all the databases.
[expand title=”Code”]
DECLARE @endDate datetime, @months smallint;
SET @endDate = GetDate();  -- Include in the statistic all backups from today
SET @months =12 ;           -- back to the last 8 months.


 SELECT ROW_NUMBER() OVER (PARTITION BY BS.database_name ORDER BY BS.database_name) AS ID,BS.database_name AS DatabaseName
          ,YEAR(BS.backup_start_date) * 100
           + MONTH(BS.backup_start_date) AS YearMonth
          ,CONVERT(numeric(10, 1), MIN(BF.file_size / 1048576.0)) AS MinSizeMB
          ,CONVERT(numeric(10, 1), MAX(BF.file_size / 1048576.0)) AS MaxSizeMB
          ,CONVERT(numeric(10, 1), AVG(BF.file_size / 1048576.0)) AS AvgSizeMB

		  into #DBSizeDetails
    FROM msdb.dbo.backupset as BS
         INNER JOIN
         msdb.dbo.backupfile AS BF
             ON BS.backup_set_id = BF.backup_set_id
    WHERE NOT BS.database_name IN
              ('master', 'msdb', 'model', 'tempdb')
          AND BF.file_type = 'D'
          AND BS.backup_start_date BETWEEN DATEADD(mm, - (@months), @endDate) AND @endDate
    GROUP BY BS.database_name
            ,YEAR(BS.backup_start_date)
            ,MONTH(BS.backup_start_date)

	SELECT   'Database Name' = DB_NAME(database_id)
,'FileName' = NAME +':'+ (
CASE max_size
WHEN - 1
THEN N'Unlimited'
ELSE CONVERT(NVARCHAR(15), CONVERT(BIGINT, max_size) * 8) + N' KB'
END
)
,FILE_ID
,'size' = CONVERT(NVARCHAR(15), CONVERT(BIGINT, size) * 8) + N' KB'
,'maxsize' = (
CASE max_size
WHEN - 1
THEN N'Unlimited'
ELSE CONVERT(NVARCHAR(15), CONVERT(BIGINT, max_size) * 8) + N' KB'
END
)
,'growth' = (
CASE is_percent_growth
WHEN 1
THEN CONVERT(NVARCHAR(15), growth) + N'%'
ELSE CONVERT(NVARCHAR(15), CONVERT(BIGINT, growth) * 8) + N' KB'
END
)
,'type_desc' = type_desc
into #DbFileSize FROM sys.master_files
 where NOT DB_NAME(database_id) IN
              ('master', 'msdb', 'model', 'tempdb')
ORDER BY database_id


select
	DatabaseName,
	Monthsofdifference,
	InitialSizeMB,
	MaxsizeinMB,
	AvgMonthwisegrowthinMB
from
(SELECT
distinct DatabaseName ,
STUFF((Select '-'+cast(YearMonth as varchar(6))
from #DBSizeDetails T1
where t1.ID in (1,8) and  T1.DatabaseName=T2.DatabaseName
FOR XML PATH('')),1,1,'') as [Monthsofdifference],
Min(minsizemb) as InitialSizeMB,
max(MaxSizeMB) as MaxsizeinMB,
cast( (max(MaxSizeMB)-Min(minsizemb))/8.0 as numeric(15,4)) as [AvgMonthwisegrowthinMB]
from #DBSizeDetails T2 where t2.ID in (1,8)
group by DatabaseName
) a

drop table  #DbFileSize
drop table  #DBSizeDetails
[/expand]
Tags: sql ops studio, sql server, tools Last modified: September 22, 2021