
In this article, we are going to clarify the fundamentals of Business Intelligence (BI) concepts with their benefits from the data utilization point of view, and explore the SQL Server-focused Business Intelligence solutions by practical examples and illustrations.
Before we discuss the particular issues related to SQL Server, let’s define the basic ideas of business intelligence.
Table of Contents
- What is Business Intelligence?
- What is SQL Server Business Intelligence?
- Is Competitive Intelligence the Same as Business Intelligence?
- What are the Benefits of Business Intelligence?
- What is a Transactional System (OLTP)?
- What is the OLAP System?
- How is Business Intelligence Applied?
- What is a Data Warehouse Business Intelligence Solution?
- What is a Data Warehouse Database?
- What is ETL/ELT?
- Principle of ACT
- Aggregations (A of Principle of ACT):
- Correlations (C of Principle of ACT):
- Trends (T of Principle of ACT)
- SQL Server Business Intelligence Traditional Tools and Technologies
- Traditional Tools vs Modern BI Tools
- Developing BI Solutions using Traditional Microsoft BI Stack
- Alternative SQL Server Database Development Tools
- Analysis Services Multidimensional Project
- Analysis Services Tabular Project
- SQL Server Reporting Services (SSRS)
- The Evolving Landscape of Microsoft Business Intelligence: Traditional Tools vs. Azure-Based Solutions
- SQL Server Business Intelligence Modern Tools and Technologies
- Azure Synapse Analytics – a Cloud-powered Data Warehouse and Much More
- What do We Need Azure Synapse Analytics for?
- How Do you Measure the Power of your Azure Data Warehouse?
- Compute and Storage Independence
- Synapse SQL (Azure Data Warehouse) Architecture
- Preliminary Requirements for Azure Synapse Analytics
- Conclusion
What is Business Intelligence?
According to Wikipedia, business intelligence comprises strategies and technologies for data analysis of business information in enterprises. The ability to properly react based on that information retrieved is central to business intelligence.
According to Robert Caine, business intelligence is all about transforming knowledge into informed actions. It is almost impossible to gain insights into the data saved in data stores that were primarily designed to process transactions.
We can simply say that BI can help us to improve the productivity and profitability of the business. It gives us trustworthy and actionable insights into the data that is not normally visible during day-to-day operations.
What is SQL Server Business Intelligence?
SQL Server BI stack refers to using Microsoft’s products developed to provide BI solutions. The most recent example of SQL Server Business Intelligence Edition is the cloud-powered business intelligence solution called Azure Synapse Analytics by Microsoft.
Is Competitive Intelligence the Same as Business Intelligence?
Competitive intelligence (CI) is not the same as business intelligence (BI) because BI focuses on an organisational internal system totally, while CI is more about the whole environment outside the internal system.
In simple words, BI is empowering internal systems by collecting all data from different departments into one location and analyzing it for better decision-making. CI gathers and analyses data from the environment outside the internal system, particularly about competitors. CI aims to understand and overcome the shortcomings of an existing system (functioning) in the organization.
What are the Benefits of Business Intelligence?
- Combining data from different sources and departments into one location for better analysis and reporting.
- Storing historical data in the BI system for better analysis as compared to transactional systems which only comprise of current data.
- Getting instant analysis results from specialized structures in place (normally it would take ages to process the data by traditional systems of transactional databases).
- Exposing the BI system to trusted internal and external users for real-time analysis.
- The BI system becomes the central point of contact for any type of analysis, reporting, and (data) modeling.
- Adding more capabilities to the BI system without worrying about the impact left.
- Although the BI system relies on the transactional system data to collect and store it, once it gets the data, it becomes totally independent. It won’t require the transactional system running to process the data.
- The BI system can help to understand problems in existing transactional systems, especially during the quality check phase.
- Leveraging built-in time intelligence functions to know more about sales, growth, and profits in comparison to the traditional transactional system, which is not recommended for reporting either.
- Using machine learning algorithms to see prospects beyond your data.
- A good BI system helps to understand ever-changing business needs by alerting potential dangers and informing of potential gains in time.
What is a Transactional System (OLTP)?
We’ve mentioned the traditional transaction system earlier. But what is it?
The transactional system is a typical system running in the organization to handle daily operations. It is not capable of handling analysis and reporting tasks.
It is also called OLTP or Online Transactional Processing System. It records business interactions resulting from day-to-day business and manages transactional data.
OLTP databases are traditionally-looking databases optimized for the following operations:
- Adding new data;
- Modifying existing data;
- Deleting existing data;
- Searching existing data;
- Viewing existing data.
The above operations are commonly known as CRUD (Create, Read, Update, Delete) operations.
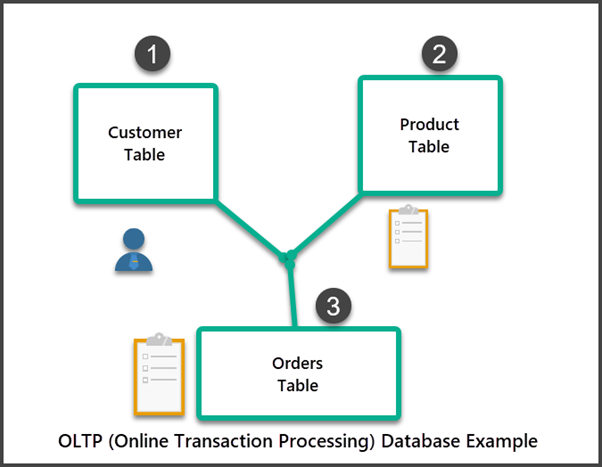
For example, we have a database about customers, products, and orders. It is an OLTP database. It gets updated daily in several ways for many reasons, including the following:
- A new customer is added to the database.
- A new product is added to the database.
- A customer buys a product.
- A product is updated to reflect its correct stock value.
- Etc.
What is the OLAP System?
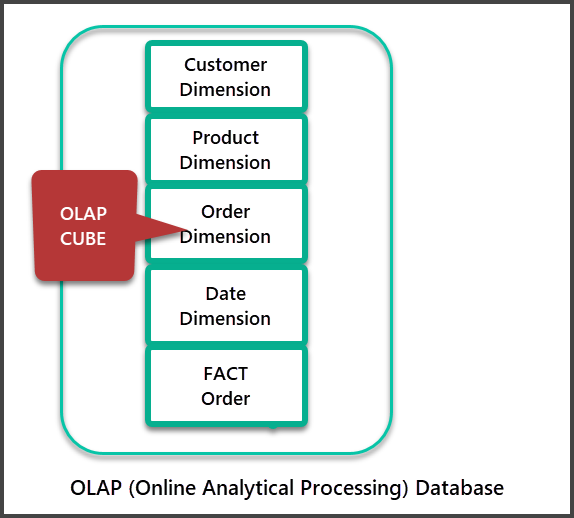
OLAP is an Online Analytical Processing system that represents a specific flavor of BI with data cubes used to process analysis and reporting requests at extremely fast speed.
OLAP databases can be called cubes; they initially receive data from the data warehouse databases through special processes.
Unlike OLTP, OLAP systems are optimized for analysis and reporting rather than for data manipulation activities.
Our traditional Customer, Order, and Product database turns into this specialized database by modifying tables and adding new tables to match the analysis and reporting purposes.
How is Business Intelligence Applied?
Business Intelligence requires using particular SQL Server BI tools, technologies, and processes to achieve business objectives. It includes gaining insight into the data for making better decisions and improving business.
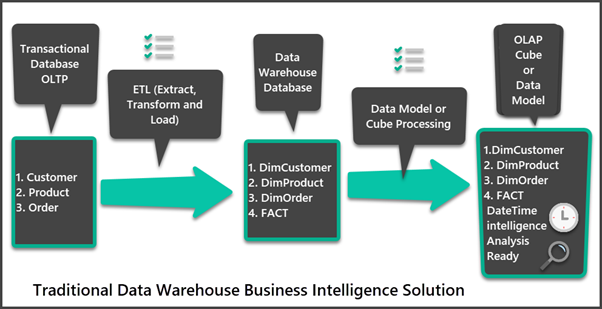
There are many ways to apply BI. One of them is to build the data warehouse business intelligence solution.
What is a Data Warehouse Business Intelligence Solution?
The data warehouse is an infrastructure that is designed to apply business intelligence for analysis, reporting, and research. It is a good example of engaging BI to improve business processes.
A typical data warehouse business intelligence solution consists of the following components:
- Data Warehouse database (SQL Server database or Azure SQL database).
- Data Extraction, Transformation, and Loading processes (ETL/ELT).
- Data Cubes (Multidimensional) / Data Models (Tabular Models).
- Analysis and reporting technologies (Connecting to the Data Models in Excel, Power BI reports, SQL Server Reporting Services (SSRS) business intelligence tools.
What is a Data Warehouse Database?
A data warehouse database is a specific database that is distinguished by the following aspects:
- Consists of staging and BI tables.
- Unifies (merges) data from different sources (transactional databases, Excel, Flat Files, etc.)
- Contains special tables other than source tables which help in finalizing the data.
- Consists of dimensions and facts tables.
What is ETL/ELT?
ETL stands for Extract, Transform, and Load. ELT stands for Extract, Load, and Transform. ETL/ELT is a process used for the following operations:
- Extract (get) the data from different sources, e.g., transactional systems.
- Transform the data by combining it in one location and modifying it further without changing contents to make it better adjusted for analytical purposes.
- Load the data into the data warehouse final tables designed in a specially structured manner to enhance the BI capabilities.
Principle of ACT
Finally, we can understand BI in terms of the principle of ACT (Aggregation, Correlation, Trends). This principle was first mentioned in my LinkedIn article long ago, and it still holds its standing.
Aggregations (A of Principle of ACT):
It means aggregated or summed up data, as we are mostly interested in aggregated figures when it comes to analysis and reporting. Examples of aggregated data are:
- Average Sales
- Sum of Sales
- Average Refunds
- Sum of Refunds
- Average Net Sales
Therefore, our final BI-powered solution is optimized to provide aggregated data rather than individual rows. That is how relevant technologies and practices support this feature.
Correlations (C of Principle of ACT):
Correlations define how you correlate two items of interest to your business. For instance, correlations tell us that customers are not buying helmets when they are buying bicycles even though the helmet is an essential safety gear for cycling.
In other words, we can see the next most missed potential-buying opportunity when our customers buy bicycles.
Trends (T of Principle of ACT)
Trends tell us in which direction our business is heading, what areas should be urgently addressed, and what areas are excellent.
You can look at the trends of sales and understand the customers’ most important buying needs based on the trends you see with the help BI-powered solution.
Congratulations! You have successfully learned the basics of business intelligence. Also, you got familiar with core concepts and practices used in building business intelligence solutions.
SQL Server Business Intelligence Traditional Tools and Technologies
To apply business intelligence in your organization, you can apply several ways. One of them is implementing traditional tools and technologies.
Talking about the SQL Server business intelligence tools, we cannot omit the famous Microsoft BI stack with its integrated development environment for BI developers. It has been one of the most productive tools by Microsoft aimed to utilize all benefits of having a BI-powered system in an organization.
Microsoft BI Stack
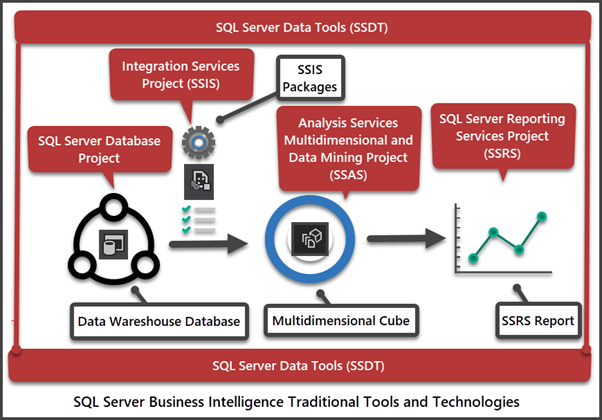
Microsoft traditional BI stack, commonly known as MS BI stack, consists of the following tools and technologies:
- SQL Server Database Development Tools and Technologies including SQL Server Database Projects
- SSIS (SQL Server Integration Services)
- SSAS (SQL Server Analysis Services)
- SSRS (SQL Server Reporting Services)
These tools can help you to build the necessary solutions, such as data warehouses, instantly from scratch.
The BI Integrated Development Environment
You can manage the above tools successfully via the integrated development environment known as SSDT (SQL Server Data Tools). It allows you to design, test, develop, deploy, and manage all MS BI Stack.
Traditional Tools vs Modern BI Tools
The Traditional MS BI stack and modern BI solution offered by Microsoft are compatible, but we need to be a bit careful with that.
There is a major difference between modern and traditional BI tools. Traditional tools are successfully managed via the integrated development environment. Modern tools are typically scattered across different environments, although it is possible to manage them to some extent via the central control panel.
Another crucial point is that modern SQL Server BI tools focus on cloud architecture support, while traditional tools concentrate on supporting on-premises architectures. However, both traditional and modern tools can support cloud architecture with some exceptions. In some measure, the sort of mix and match is available.
One of the most recent examples of modern SQL Server BI technologies is Azure Synapse Analytics. It is totally on the cloud (Azure), allowing to save the upfront cost of managing in-house servers. It supports the pay-as-you-go model and offers tremendous scalability when required.
Developing BI Solutions using Traditional Microsoft BI Stack
The traditional Microsoft BI stack (set of tools and technologies) has been mesmerizing developers and organizations for more than a decade. Now, they sometimes call it a classic BI Stack. The thing is, the growth of the Microsoft BI framework is fast and rapid, but the classical BI Stack is still very much in use. Some of these traditional tools and technologies are inevitable even if you are building your BI solution with modern tools.
The BI journey begins from installing Visual Studio on the development machine. The built-in SSDT (SQL Server Data Tools) for Visual Studio provides you with the framework for the first step. It is to build the data warehouse database.
SQL Database Project
A database project strictly follows the declarative development style to design, modify, test, deploy, and manage the data warehouse databases.
You can create a table in your database project and deploy it to the target data warehouse database. If you need to change the table in the database project, modify it with the table designer and deploy the changes. You don’t need to write a change script, as the SQL Server database project compilation process will handle it.
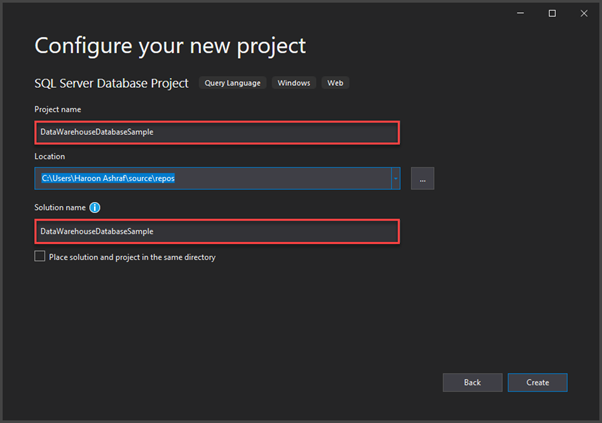
See below how the SQL Database Project is created in Visual Studio:
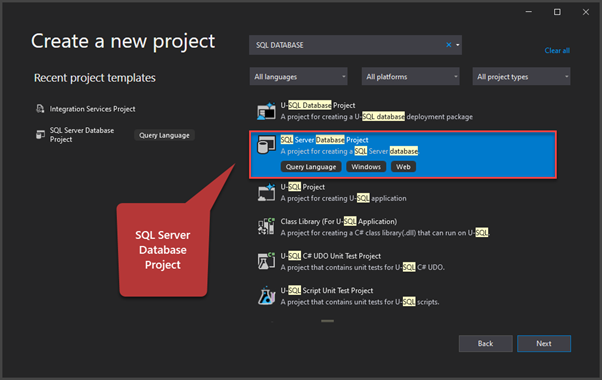
You can create the data warehouse database project in Visual Studio too:
Alternative SQL Server Database Development Tools
SQL Server database development tools help the developers build specific SQL Server databases behind the BI-powered solution (data warehouse). This specific database in a typical BI-powered solution is called the data warehouse database.
An SQL/BI or DWBI developer can either use SSDT (SQL Server Data Tools) or SQL Server Management Studio to build the data warehouse database. Often it is the first step in the data warehouse development after the end of the design phase.
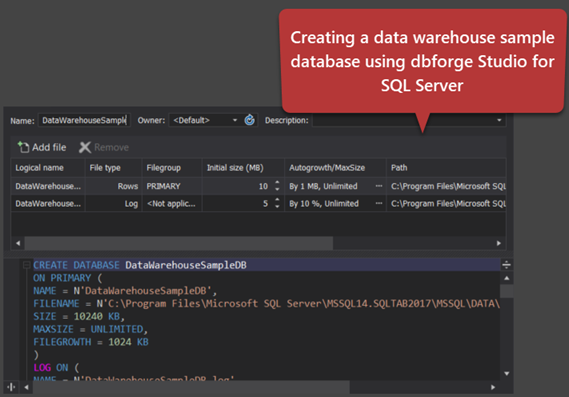
It is also possible to build the data warehouse database with third-party tools. Besides, such tools often provide more functionality to simplify the development task. One of the most functional solutions is dbForge Studio for SQL Server.
SSIS (SQL Server Integration Services)
SQL Server Integration Services is commonly known as SSIS build and control the data movement from several sources (OLTP databases) into the data warehouse database.
In simple words, the Integration Services Project which consists of many SSIS Packages is used to perform ETL (Extract, Transform, Load) or ELT (Extract, Load, Transform) operations to merge and validate data before loading it into the data warehouse database.
However, unlike with SQL Server database projects readily available in Visual Studio, you need to add SQL Server Integration Services from Visual Studio marketplace as a (VSIX) extension:
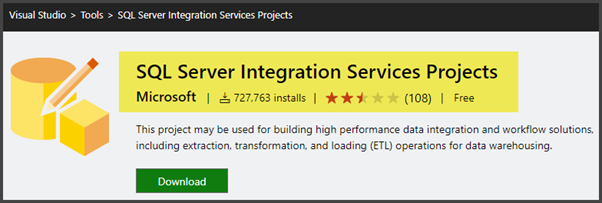
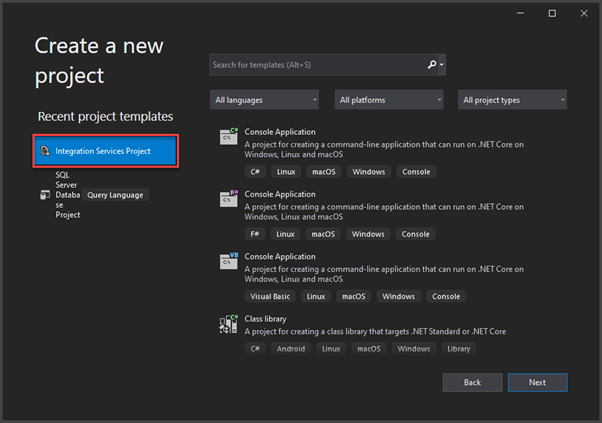
You can create an Integration Services Project after installing the required extension:
Go through the following article on How to Set up and Test-Run the Environment to Multicast Data with SSIS for more information about SQL Server Integration Services (SSIS):
SSAS (SQL Server Analysis Services)
SQL Server Analysis Services or SSAS is another integral part of the traditional BI Stack.
You have the data warehouse database optimized for its specific needs. However, that database requires further enhancements to become an Analysis Services database meant for querying, analysis, and reporting.
To build the analysis services database, you need to create a separate project in Visual Studio. However, before that, you need to add the Microsoft Analysis Services Projects extension from Visual Studio Marketplace.
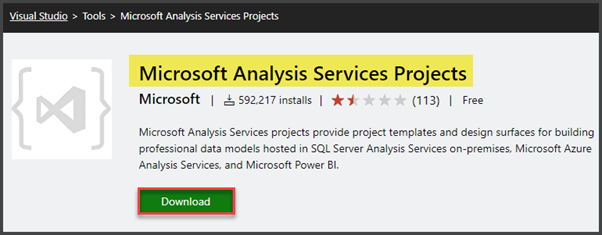
Once installed, you as an SQL/BI developer have the following options (and some others) to choose from:
- Analysis Services Multidimensional Project
- Analysis Services Tabular Project
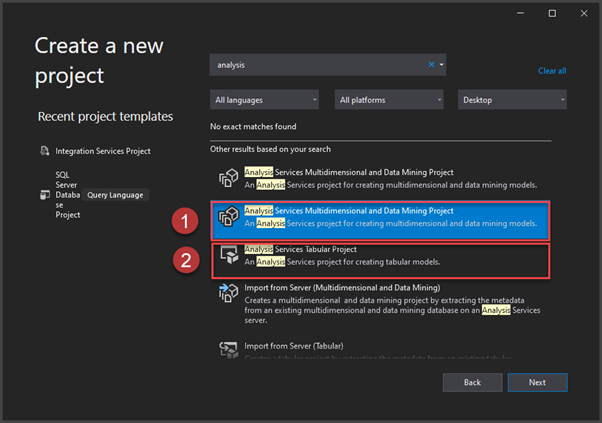
Analysis Services Multidimensional Project
Analysis Services Multidimensional and Data Mining Project is the type of project which lets you build a multidimensional analysis services database with data mining if desired.
This project results in building OLAP/ROLAP/MOLAP Cubes which you can query in MDX language along with few others.
The end product of this project is the optimized data Cube which can instantly process the analysis, reporting, and research requirements to give you insights into your data.
Analysis Services Tabular Project
Analysis Services Tabular project is a newer version with more improvements and compatible with cloud technologies (Azure). Azure allows this project to take advantage of many other new BI-supported products, most essentially – Power BI reports.
The end product of this project is the Data Model which you can connect behind some modern reporting technology (e.g., Power BI reports) to provide a seamless integration experience.
You can query the tabular data model in the DAX (Data Analysis Expressions) language.
Refer to the Introduction to Microsoft Power BI article for more information about Power BI.
Processing the data model or analysis services database means bringing the latest data from the data warehouse database into the analysis services database or data model.
You can automate the processing of analysis services, as described in Automating the Tabular Model Processing of Analysis Services (SSAS) Databases in SQL Server
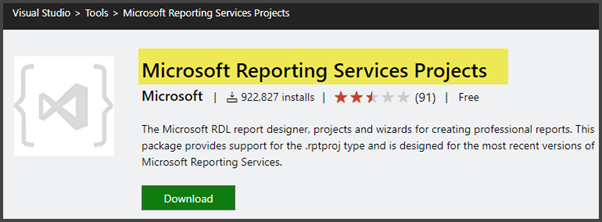
SQL Server Reporting Services (SSRS)
SQL Server Reporting Services or SSRS serves as the central interaction point between the data warehouse and business users in a traditional data warehouse architecture.
A SQL/BI developer builds SSRS reports from the Analysis Services database data. The Multidimensional mode is used traditionally, but the tabular project type is also welcome depending on the purpose of use.
In simple words, SSRS reports are based on the analysis services database. They are designed and deployed to the server. Business customers would further subscribe and get those reports delivered automatically by scheduling these reports through the server. Just like some other BI tools, SQL Server Reporting Services is also added as an extension to Visual Studio SQL Server Data Tools:
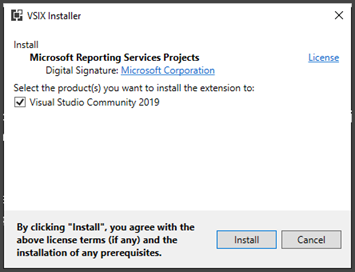
After you install this extension, you can create the SSRS report in Visual Studio by choosing the relevant project type.
Also, refer to the following articles to get some hands-on experience of using SSRS:
- SSRS Reports Development in Simple Terms
- Creating Customer-Focused SSRS Reports with Parameters
- How to Write Stored Procedures for Professional SSRS Reports
You can visualize these traditional tools and technologies working together to build a robust BI-powered solution. See the screenshot below:
The Evolving Landscape of Microsoft Business Intelligence: Traditional Tools vs. Azure-Based Solutions
Remember that traditional tools and technologies were once the first-hand choices to build a corporate-level cost-effective and reliable BI-powered solution. But things are changing fast in the Microsoft BI world. As a result of these rapidly growing changes, the cloud-powered BI solutions offered by Microsoft as Azure Synapse Analytics are taking over slowly and steadily.
That does not mean that traditional tools and technologies will be abandoned. However, one thing is for sure – Microsoft is not going to support them as the Azure (cloud)-based BI products, where it adds new features and issues patches regularly.
Still, there are many use cases for traditional tools and technologies. There, they have an edge over rivals and outshine newer technologies. They have the advantage of the proven solid native foundation.
SQL Server Business Intelligence Modern Tools and Technologies
By understanding the traditional tools, you get a background for comparing them with modern tools. This way, you’ll find the most suitable approach for your business intelligence projects. Also, you can mix and match traditional and modern tools, however, it will require understanding and experience.
Azure Synapse Analytics – a Cloud-powered Data Warehouse and Much More
One of the most renowned technologies for developing modern Microsoft-based data warehouse BI solutions is Azure Synapse Analytics – one of the services provided by the Azure cloud platform.
The modern version of Data Warehouse (Azure Synapse Analytics) is slightly complicated in the beginning. It does not only bring too many new terms, but also it offers much more than just a cloud-powered data warehouse.
However, it is not mandatory to know every single feature of Azure Synapse Analytics. You need a sufficient understanding of how to meet your business-specific requirements using this massive technology.
According to the Microsoft documentation, Azure Synapse Analytics is a cloud-powered service developed by Microsoft for analytics.
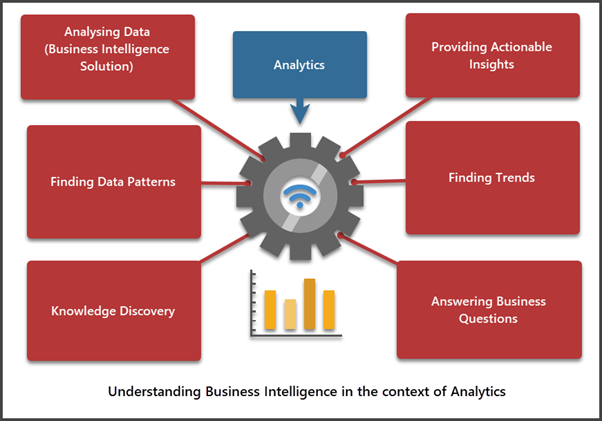
Analytics is a field of Computer Science that deals with discovering new data to understand better understanding, improve, and, in some cases, automate decision-making. We can also say that Analytics is a process of discovering the knowledge to answer business questions and support business decisions for better productivity.
Since Analytics involves (among many others) a process of collating (gathering) data into a single location for analysis and reporting, data warehouse business intelligence solutions are an integral part of this job.
What do We Need Azure Synapse Analytics for?
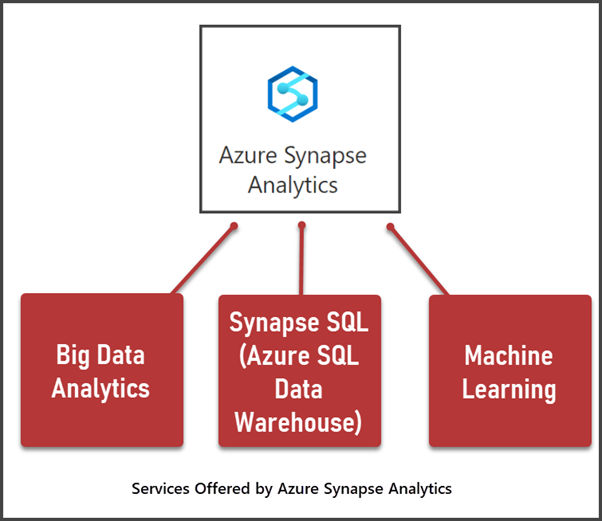
Azure Synapse Analytics serves for building, testing, deploying, and managing analytics solutions, including data warehouse business intelligence solutions. Now, it is itself an enterprise-level Analytics mega-solution that typically offers three big things:
- Big Data Analytics
- Machine Learning
- DWBI solution (Azure SQL DATA WAREHOUSE)
The Azure Data Warehouse or DWBI part of Azure Synapse Analytics is known as SQL Pool. It is offered to customers in the following two flavors:
Dedicated SQL Pool – an SQL-based data warehouse service where you have some pre-determined estimate of the expected power your cloud data warehouse needs to run
Serverless SQL Pool – is an option of automatic adjustment of required resources (particularly computational power) that is increased and decreased depending on the consumption.
In other words, a Dedicated SQL Pool gives you more deciding power but can be more costly if you can’t shrink or grow your data warehouse in time to manage it successfully. The Serverless SQL Pool gives you an automatic resource resizing your data warehouse solution, so it may be less costly, but it offers fewer options for data warehouse logic handling.
How Do you Measure the Power of your Azure Data Warehouse?
Generally speaking, and skipping the technical details, you only need the following two factors when estimating your Azure-based data warehouse (Dedicated or Serverless SQL Pool) use:
- Compute – the processing power required by the data warehouse queries to perform analysis and reporting.
- Storage – the space required by the data warehouse objects, such as tables, views, procedures, etc.
Compute and Storage Independence
One of the benefits of using Azure-powered Data Warehouse is the freedom to independently manage the compute and storage values. It means you can have a very cost-effective solution where you only require the storage and compute power you are happy with rather than trying to perform a pretty sophisticated balancing act (just because if you increase one, the other gets increased too).
Synapse SQL (Azure Data Warehouse) Architecture
Synapse SQL is another name of an Azure-based data warehouse business intelligence solution.
The Synapse SQL Architecture is multi-node – many nodes work side-by-side to process queries and return results. However, the processing is managed differently depending on whether you are using a Dedicate SQL Pool or a Serverless SQL Pool.
Let us go through the following major key players to understand the Synapse SQL (Azure Data Warehouse) architecture:
- Control Node
- Compute Nodes
- Azure Storage
- Data Movement Services (DMS)
Note that we are talking about the architecture mainly and only from the processing or computing point of view.
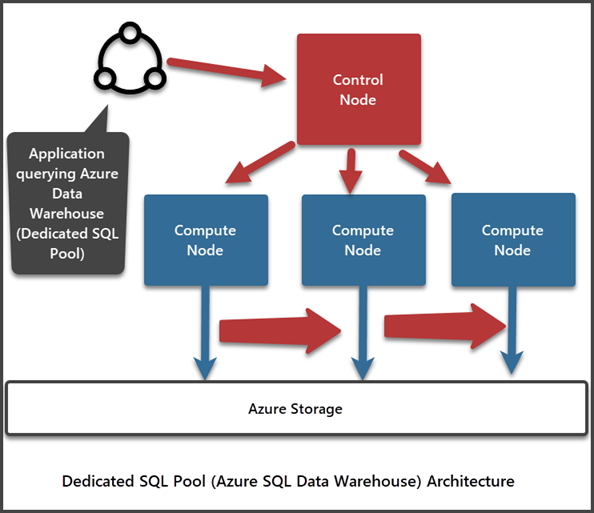
- Control Node is the first point of contact of your cloud-powered data warehouse with the outer world, such as an application querying the data warehouse interacts with this node. The Control Node accepts the data request, optimizes it, and sends it to the Compute Nodes for further processing.
- Compute Nodes receive the data from the Control Node and run the queries in parallel to get faster results.
- Azure Storage is where the Compute Nodes on the receiving end store the data to be processed.
- Data Movement Services (DMS) help the Compute Nodes run queries in parallel and move data across different nodes for parallel processing.
As we mentioned earlier, the process management depends on using the SQL Pool, whether it is a Dedicated SQL Pool or a Serverless SQL Pool.
- With the Dedicated SQL Pool in use, a requested T-SQL (query) is ultimately turned into multiple queries to run in parallel by Compute Nodes.
- In the Serverless mode, a T-SQL is broken down into small T-SQL queries to be run by different Compute Nodes followed by getting joined in the end to get optimum results.
Preliminary Requirements for Azure Synapse Analytics
If you decide to appeal to the Azure Synapse Analytics in your team, you should get familiar with some concepts to make the most of the Analytics powers:
- Understand Azure in general
- Understand the basics of data warehouse
- Register an Azure account
- Choose and start using the Azure Synapse Analytics service available in Azure Portal
A good thing is, Microsoft offers Azure Synapse Analytics a free trial which you can take benefit from to learn and explore further.
Conclusion
In conclusion, this blog post has provided a comprehensive overview of SQL Server Business Intelligence (BI), covering both traditional tools and modern technologies. We delved into the basic understanding of BI, its benefits, and the principles of ACT (Aggregations, Correlations, and Trends) that underpin effective BI.
We explored the Microsoft BI Stack, traditional tools, and development environments for BI solutions. Additionally, we discussed the evolving landscape of Microsoft BI, highlighting the shift towards Azure-based solutions, such as Azure Synapse Analytics.
Azure Synapse Analytics, as a cloud-powered data warehouse, was examined in detail, including its architecture, capabilities, and the reasons for its adoption. We also addressed the critical aspect of measuring the power of your Azure Data Warehouse and the independence of compute and storage.
Whether you’re interested in traditional SQL Server BI or modern Azure-based solutions, this blog post has offered valuable insights to help you make informed decisions in the dynamic field of Business Intelligence.
Tags: business intelligence, sql server Last modified: October 09, 2023