
What is the right way of using Date Templates in Power BI reports and dashboards? This article will clarify the question and help to understand the usage of Date tables as templates.
But before we dig deeper, let’s refresh the information we are already familiar with.
The Date Template basics
A Date table is one of the most commonly used tables in Power BI reports. Without a Date table, the data model working behind the Power BI report lacks the time intelligence features and functions.
A Power BI Template
A Power BI template is a structure or model that typically contains commonly used tables, relationships, and hierarchies belonging to an organization or an individual. This model is reused in any Power BI report. More information is provided in the previous article:
Centralized Data Modelling using Power BI Templates
What is a Date Template in Power BI?
A Date template is a precise structure of the Date table that is a background for building reports in the organization. In other words, it is like a built-in Date table that any reports developer or a skilled business user can apply to build Power BI reports.
What is the difference between the Date Table and Date Template?
A Date table is typically a table created on the fly through the DAX date format script in the Model view of a Power BI report. A Date template is a ready Power BI Template that, once created, can be imported into any report. It won’t be necessary to create the Date table in the report, as the template will generate it.
Please refer to the following articles for more data about Date tables in Power BI:
Can we create multiple Date Templates?
It is possible, although it is only recommended if there is a legitimate reason to do so.
What are the benefits of using a Date Power BI Template?
The benefits are many, including the following:
- Power BI report developers or internal business users capable of creating Power BI reports do not need to create specific Date tables in each new report they work on;
- A Date table template can serve as a single source and be easily managed throughout the organization;
- The possibilities of errors are minimized for creating a Power BI Date table since it is created by the template.
Creating a Generic Date Power BI Template: prerequisites
This article assumes the readers understand the databases and data warehouse business intelligence solutions. Also, it suggests that the readers are familiar with Power BI reporting concepts and have the required tools installed.
If the Microsoft Power BI Desktop is absent in your system, download it from the Microsoft Download Center and install it on your PC/laptop.
Generic Business Requirements to determine Date Range
At this point, it is crucial to identify the generic business requirements to the date table. First of all, we must ensure which date range is of interest to the organization. Then it will remain consistent for most of the reporting.
Let us assume that our business is interested to see the data across the years from 01 January 2016 till the end of the current year. In this case, we can set up the following Power BI date format:
- Start Date: 01 Jan 2016
- End Date: 31 Dec 2021
However, this strategy will not work next year. Thus, we need to use the dynamic DAX script to get us to the end of the current year, whether it is 2021 or 2022.
This leads us to the Date functions Now() and Year() that help Power BI change date format to configure the end of the current year settings.
How to Create a Date Table in a blank Power BI Report
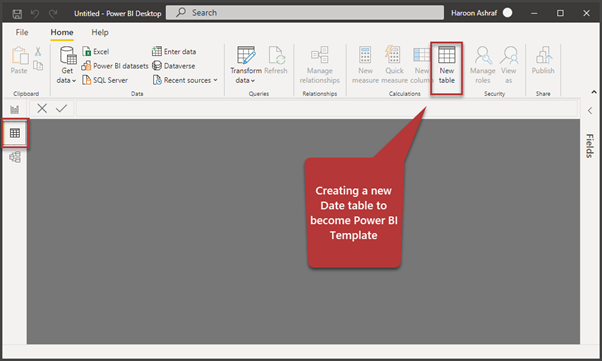
The first step is creating a Date table in any Power BI report to designate it as a template. There is no direct way to create a Power BI Template without creating a report first.
Open your Power BI Desktop. It will produce the welcome window at once – close it.
Switch to the Data view by clicking the icon on the left (see the screenshot) and then click New table:
Now we need to create a Date table that will present the data from 01 January 2016 till the end of the current year. Use the following DAX script:
Date = CALENDAR("01 Jan 2016",DATE(YEAR(NOW()),12,31))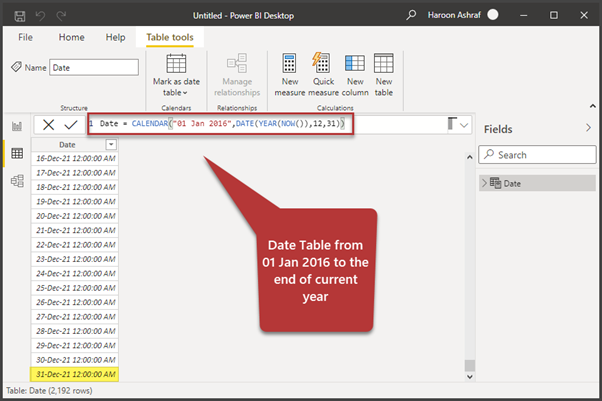
The Year(Now()) function returns 2021 as Now() and returns the current date. Year() returns the year of the current date. When passed to the Date function in Power BI with 12 as a month and 31 as a day, we get the desired date range for the required Date table.
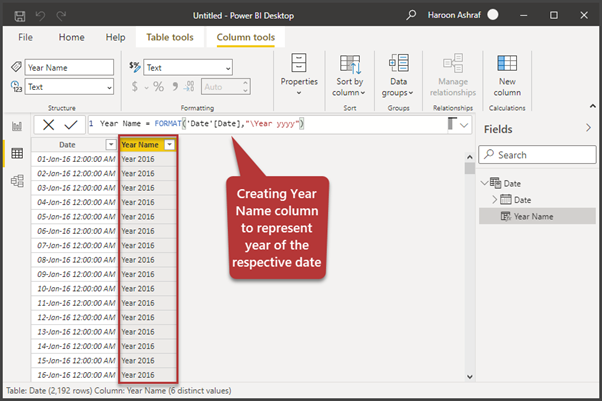
Creating the Year Column
Click New Column on the Table Tools tab to create the Year Name column with the following formula:
Year Name = FORMAT('Date'[Date],"\Year yyyy")The output is as follows:
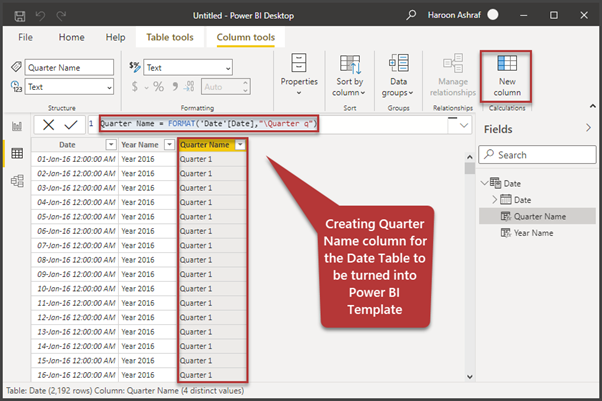
Creating the Quarter Name Column
Click on New Column once again to create the Quarter Name column with the following script:
Quarter Name = FORMAT('Date'[Date],"\Quarter q")This can be seen below:
Creating the Month Number and Month Name Columns
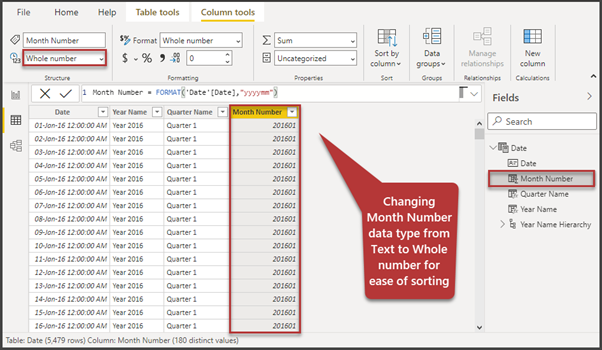
Similarly, let us create a supporting column called Month Number as follows:
Month Number = FORMAT('Date'[Date],"yyyymm")Now please change its data type to the Whole number as this helps to sort the Month Name column correctly:
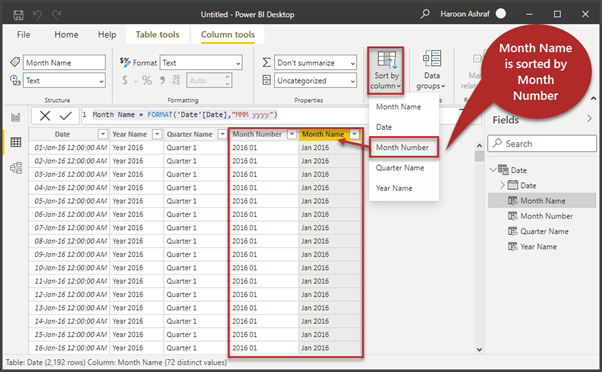
Create a new column Month Name with the following DAX script:
Month Name = FORMAT('Date'[Date],"MMM yyyy")When the Month Name column is in focus, we need to sort it by the Month Number column for correct sorting.
Click Sort by column in the Columns tools tab and select Month Number. This is illustrated as follows:
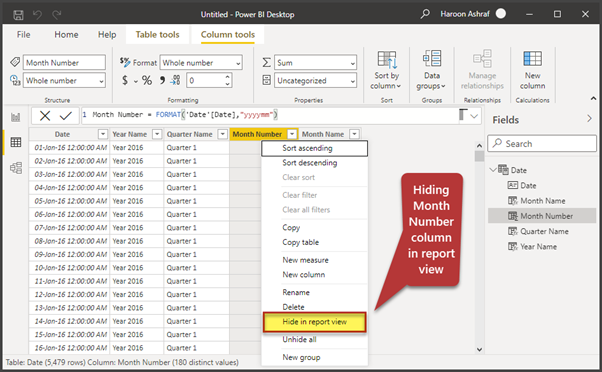
Hiding the Month Number column
Since the only purpose to create the Month Number column is to sort it, we can hide it from the report view, as it is for internal use only.
Right-click on the Month Number column > Hide in report view:
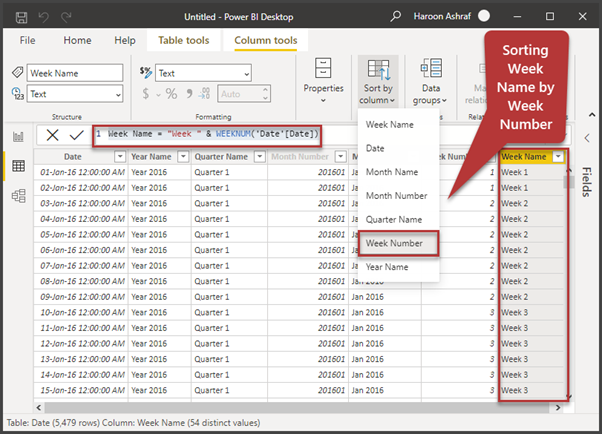
Create the Week Number and Week Name Columns
We need to create the Week Number and Week Name columns and then sort Week Name by Week Number using the DAX script:
Week Number = WEEKNUM('Date'[Date])
Week Name = "Week " & WEEKNUM('Date'[Date])
Just like the way we sorted Month Name by Month Number, please Week Name by Week Number:
Also, hide the Week Number column in the report view.
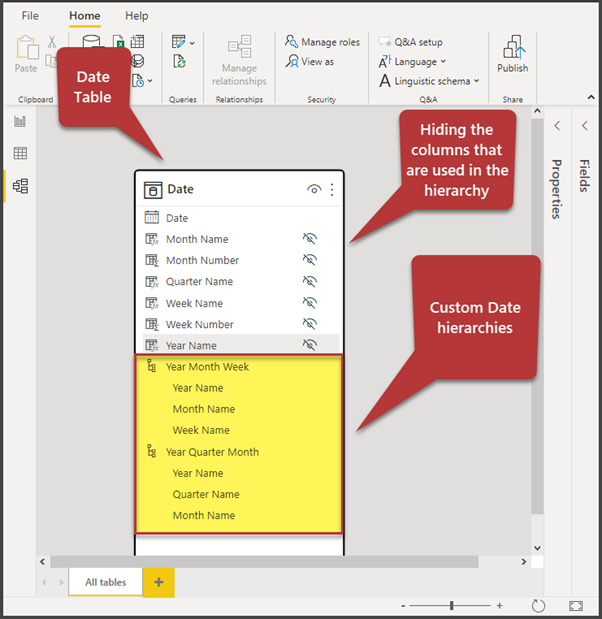
Create the Year Quarter Month and Year Month Week custom hierarchies
Refer to the previous article Create and Use Custom Date Hierarchies in Power BI to refresh your knowledge.
We have to create the following custom date hierarchies:
- Year Quarter Month
- Year Month Week
It is fine to hide the following columns as per standard practice once you have them in the hierarchies:
- Year Name
- Quarter Name
- Month Name
- Week Name
The report Data Model should look like below:
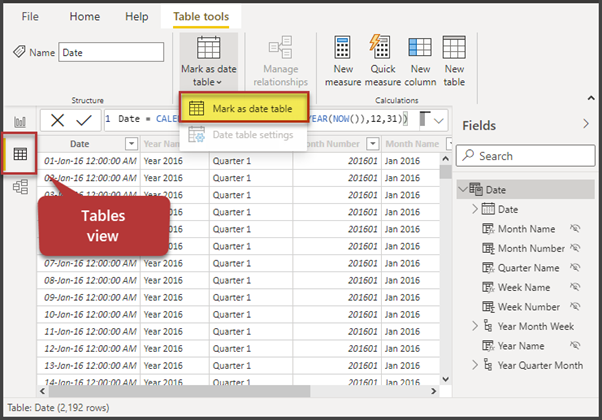
Mark the table as Date Table
One crucial step is to mark the table as a Date table. Without this, you may not be able to utilize the benefits of using the Date table for time intelligence features.
Go to the Data view and click Mark as date table on the Table Tools tab as shown below:
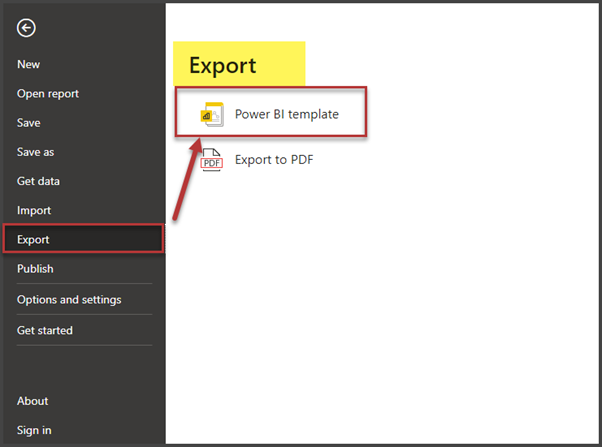
Export as Power BI Template
Finally, open the File menu, click Export, and select Power BI template:
You can add any description to it. We’ve added Generic Date Template:
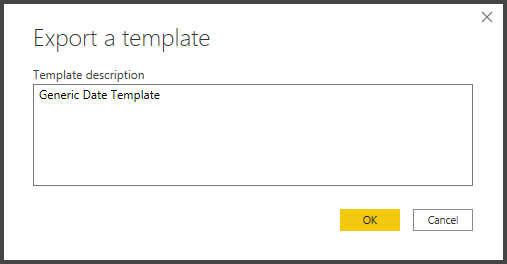
Save it as a Generic Date Template to some shared location accessible by other team members:

Congratulations! You have successfully created a general Date Template to use yourself and share with your team and organization for building reports.
Professional Life Tip
You can also create a Date table from any start date, such as 01 Jan 2016 to exactly the current date by using the following DAX script:
Date = CALENDAR("01 Jan 2016",DATE(YEAR(NOW()),Month(Now()),DAY(NOW())))Also, you can create a Date table based on the data range determined by the columns, such as OrderDate and ShippingDate of the table imported into the Power BI report:
Date = CALENDAR(FIRSTDATE('Order'[OrderDate]),LASTDATE('Order'[ShippingDate])Things to do
Now that you can build a Date template in Power BI, you can try the following exercises to improve your skills:
- Try to create another Power BI Template called Multiple Dates Template based on the article How and When to use Multiple Date Tables in Power BI
- Try to add the Date table to the existing template mentioned in Centralised Data Modeling using Power BI Templates (mentioned at the beginning of this article)
- Try merging the multiple date Power BI template with the template referenced in the article Centralised Data Modelling using Power BI Templates by calling WFH-with-Multiple-Dates-Centralised-PowerBI-Template