
To utilize the time intelligence built-in features and functions in Power BI reports, you can use multiple Date tables. This article is going to explore this case in-depth. The readers will get a conceptual understanding of professional life scenarios and the importance of using Date tables in Power BI solutions.
Multiple Date tables are necessary for many situations. They are required to build reporting solutions for applying the out-of-the-box time intelligence functions and features appropriately. In particular, they help to drill down data from years to quarters and from quarters to months.
Date Table in Power BI
Note that we are not referring to ordinary date tables in this article. Rather we are talking about specially created Date tables in typical business intelligence (reporting) solution that enhances your date-based reporting by adding built-in time intelligence.
This special Date table (we can technically call it a Date dimension) is generated via DAX as a new table in the Power BI report. It has to be linked with the central table via date columns. For example, in a sales database, the order date can be linked with the date column of the Date table.
Multiple Date Tables
One Date table would suffice in most cases. However, sometimes we require multiple Date tables. The standard case is having more than one date field in a data warehouse database.
Let’s get our sales table as an example. It has the order date and the shipping date, and we need to link both these dates with two different Date tables. We can use a single Date table, but it is a slightly complicated way of solving this problem.
On the other hand, we need to add multiple Date tables if we require the date field of a particular data model table for time intelligence and time slicing purposes. We can discuss it with the business analysts who receive the requirements and pass them on to the developers after further refinements.
Please refer to the following articles for information about Date tables and the steps needed to create them using the DAX scripts:
You should read and understand those steps unless you are already familiar with the necessary things and have appropriate experience.
How to Create a Date Table in Power BI (Example)
Now, let us explore the way of using multiple Date tables in regards to assumed business requirements.
Suppose a provider of training and examination services will use a database to store the related information. Business users are interested in analyzing the examination results by the following two types of dates:
- Registration date
- Examination date
Further, you come up with the solution. You are going to use multiple date dimensions (date tables) in the report data model working behind the Power BI report.
How to Create Fact Table in Power BI
Let us assume that there is a purpose-built data warehouse database that we’ll load into the Power BI data model for analysis and reporting. We can use a blank query by entering some data directly into that table (and assume it is coming from the data warehouse database).
For this particular scenario, a single FACT table containing the examination dates and registration dates along with other exam-related calculations is enough.
Open the Power BI Desktop and close at once the opening window offering you to get data as below:
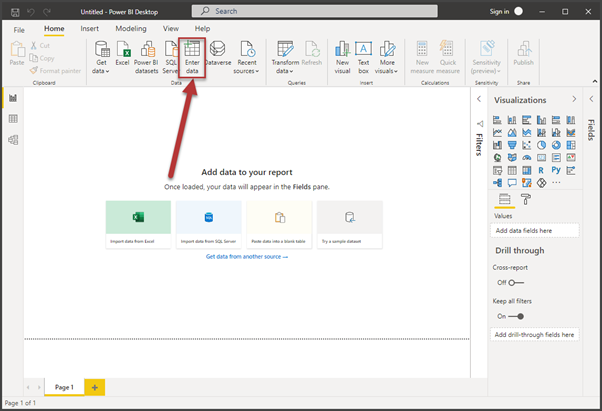
Click Enter Data on the Power BI Desktop toolbar:
Set the following fields for the table:
- Reg Date
- Exam Date
- Total Appeared
- Total Pass
- Total Fail
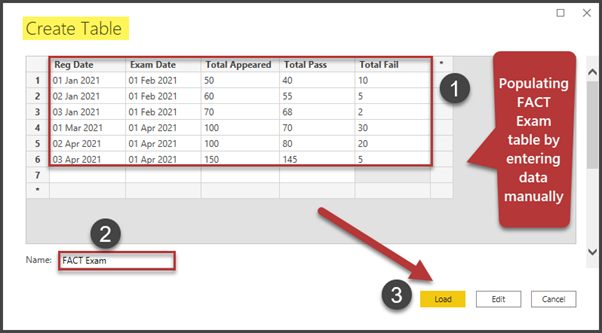
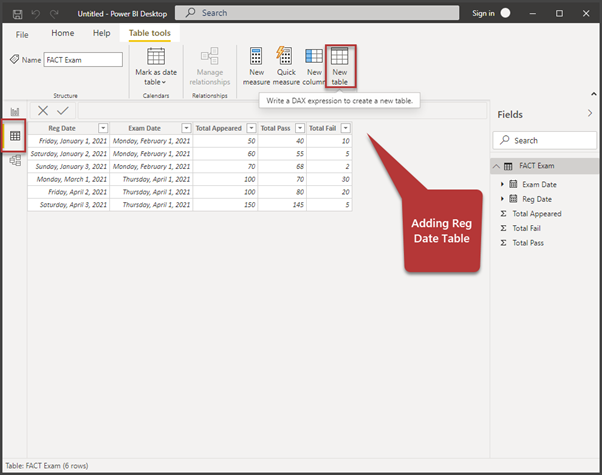
Create and Populate the FACT Exam table using the following data:
| 01 Jan 2021 | 01 Feb 2021 | 50 | 40 | 10 |
| 02 Jan 2021 | 01 Feb 2021 | 60 | 55 | 5 |
| 03 Jan 2021 | 01 Feb 2021 | 70 | 68 | 2 |
| 01 Mar 2021 | 01 Apr 2021 | 100 | 70 | 30 |
| 02 Apr 2021 | 01 Apr 2021 | 100 | 80 | 20 |
| 03 Apr 2021 | 01 Apr 2021 | 150 | 145 | 5 |
Rename the table to FACT Exam and click Load:
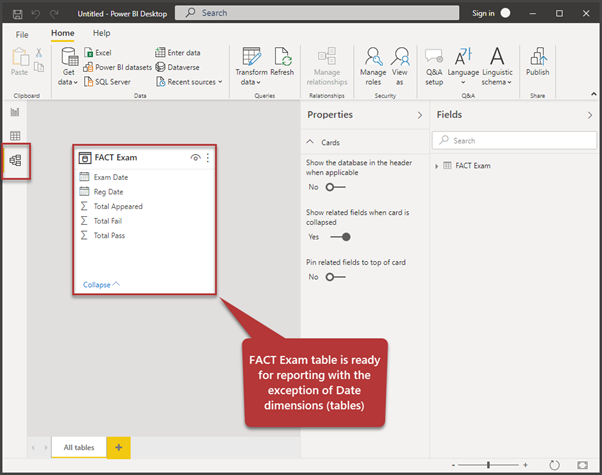
Switch to the Model view. The FACT table is now ready for analysis and reporting. However, we need to add time intelligence by adding multiple date tables:
How to Create Date Dimension Table in Power BI
We need to add the registration date table (dimension) in the same way we added the traditional Date table in Power BI. Note: We have to rename the Year field to Reg Year Name.
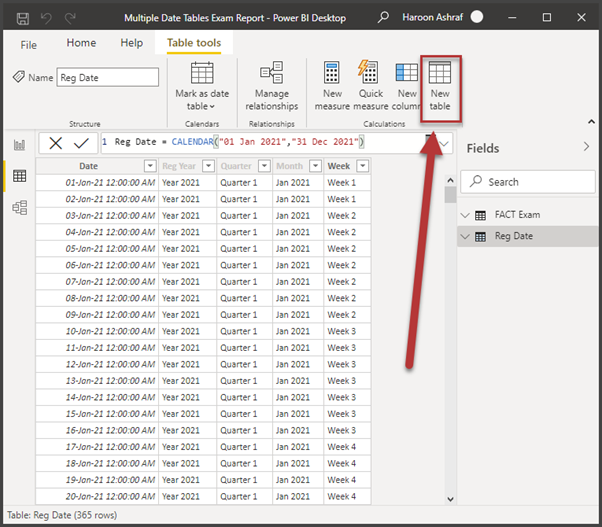
Switch to the Data view and click New Table:
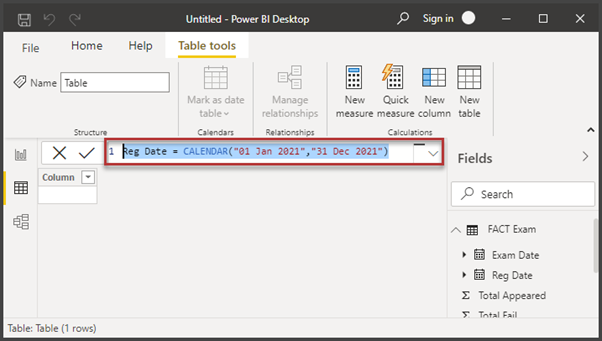
Create a new date table called Reg Date for the year 2021 with the following DAX formula:
Reg Date = CALENDAR("01 Jan 2021","31 Dec 2021")This is shown as below:
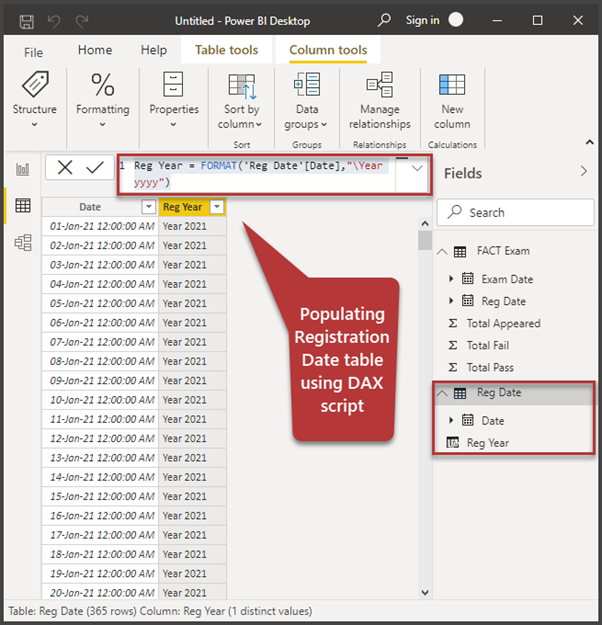
Click New Column and add the Year column as Reg Year using the following DAX code:
Reg Year = FORMAT('Reg Date'[Date],"\Year yyyy")This is illustrated as follows:
Add the rest of the columns as described in the reference.
The Date table should have at least the following fields for appropriate time-slicing experience:
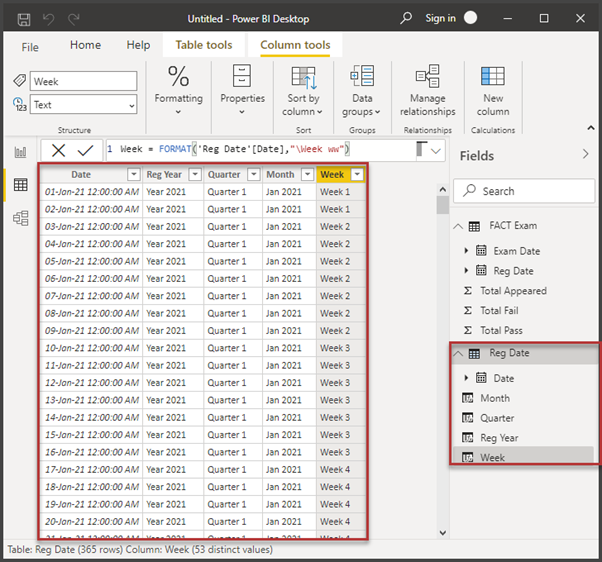
Please note that I have purposely skipped the Day, Month Number, and Week Number fields in the Reg Date table. Here we are focusing only on the article scope. However, in practice, it is recommended to have these fields. They ensure a better visual experience. To add those fields, refer to the reference article Learn to Create and Use Custom Date Hierarchies in Power BI.
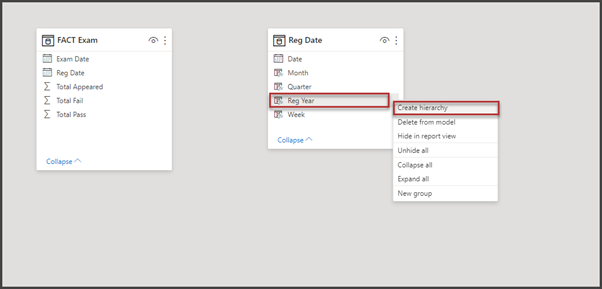
How to Create Date Hierarchy (Year-Quarter-Month)
Next, switch to the Model view and right-click on Reg Year > Create a hierarchy. We are adding a new hierarchy called Year Quarter Month:
We already examined the steps to add such hierarchies in the past articles.
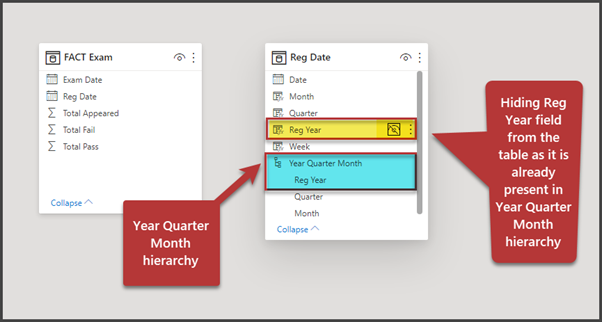
Hiding the Date Fields Present in the Year-Quarter-Month Hierarchy
Once the Year Quarter Month hierarchy has been created successfully, it is advisable to hide these fields in the table, as they are also handled through the hierarchy.
Hover the cursor over Reg Year and click the eye icon to hide it from the customer view:
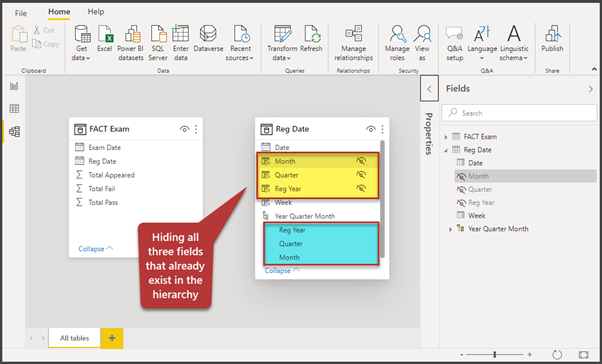
Similarly, hide the following columns in the table:
- Quarter
- Month
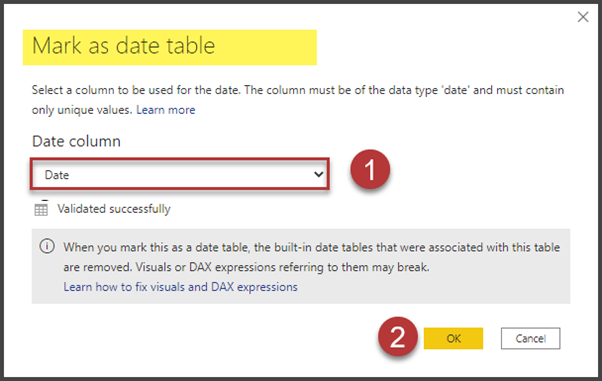
How to Mark Reg Date as Date Table
The most important part is to make the Date table familiar to Power BI. Then the in-built business intelligence functions can work appropriately.
Right-click on Reg Date > Mark as date table:
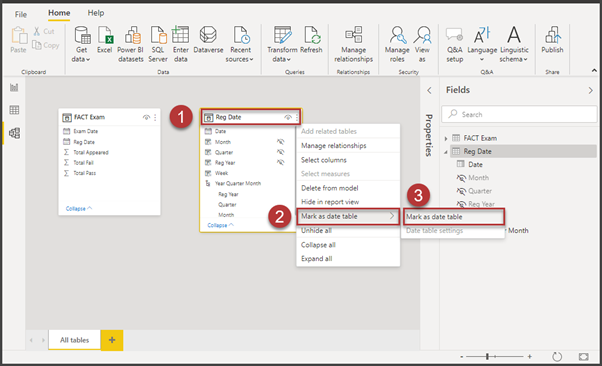
Select the Date column to be used for dates in your Date table:
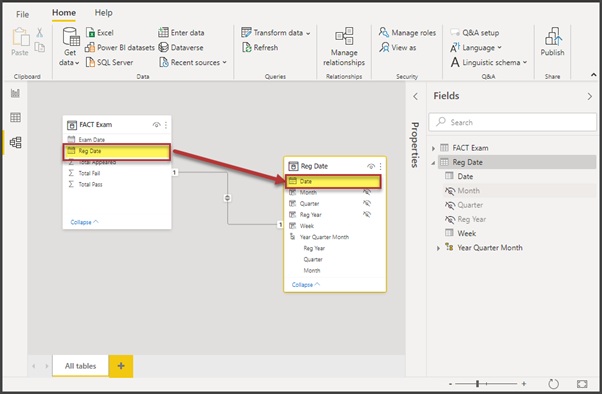
Connecting Multiple Date Columns in Same Table
In this step, we must join the Reg Date field of the FACT Exam table with the Date field of the Reg Date table. It is necessary for creating tabular relationship:
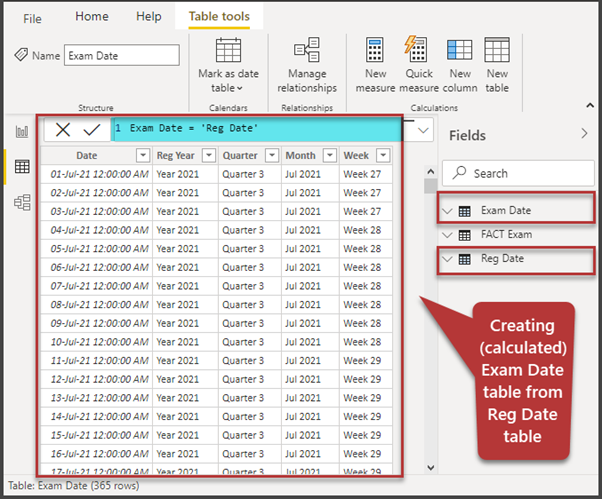
Create the Exam Date Table (Exam Date) from the Registration Date Table (Reg Date)
Now we are going to create a copy of the Reg Date table to create the Exam Date table.
Go to Data view and click New table under Table tools:
Use the following DAX script to create a calculated table (Exam Date):
Exam Date = 'Reg Date'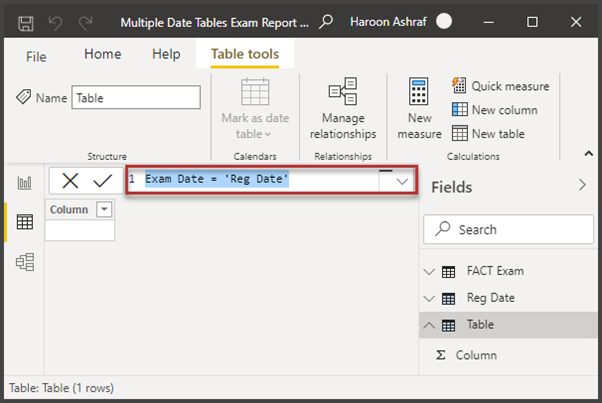
The Exam Date table is going to be populated instantly:
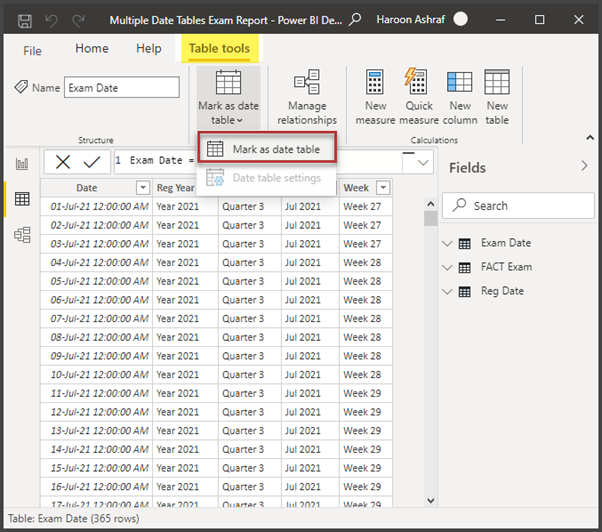
Remember that creating a Date table from a Date table does not automatically mark the newly copied table as the Date table. We have to do this manually.
Click Mark as date table > Mark as date table:
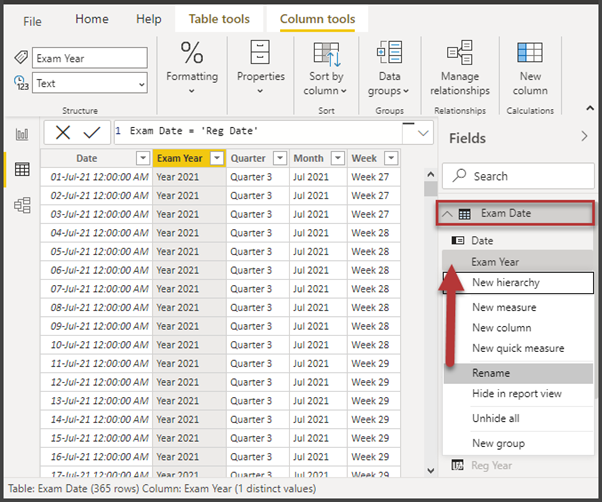
This table will have the Reg Year column – we have to rename it to Exam Year to avoid confusion. Right-click on the Reg Year column in the Fields pane and rename it to Exam Year:
Create the Year Quarter Month hierarchy for the Exam Date table in the same way you did it for the Reg Date table. Don’t forget to hide the Date columns already present in the hierarchy.
The output should be similar to the following screenshot:
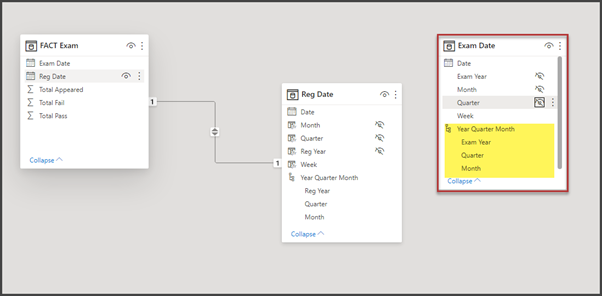
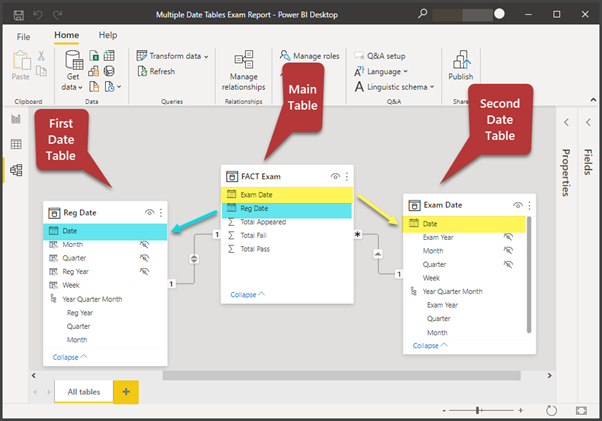
Once the Exam Date table is ready for use, we need to join it with the main table to create a tabular relationship. This allows us to perform the date-time slicing when viewing the data.
So, join the Exam Date column of the FACT Exam table with the Date column of the Exam Date table.
Creating Power BI Report that Shows Multiple Date Fields
Save the Power BI report as Multiple Data Tables Exam Report and be ready to use this data model in your Power BI report when needed.
The final output is as follows:
Congratulations! You have successfully learned how and when to use multiple date tables in Power BI. Stay in touch – we’ll learn how to analyze data with multiple Date tables in Power BI in the upcoming article.
Things to Do
Now you can try the following things to improve your skills further:
- Copy the report as Exam Report Test and create multiple date tables Published Date and Review Date for the sample database referenced in Implementing Full-Text Search in SQL Server 2016 for beginners – {coding}Sight
- Copy the report as Exam Report Test 2 and create a similar scenario of creating multiple Date tables for the sample database, the Student table mentioned in Creating and Deploying Multiple Versions of Database through Schema Snapshots – {coding}Sight