Oracle Analytics Cloud (OAC) is a single cloud-based platform for data preparation, in-depth analytics, and comprehensive detailed reporting with customizable visualization in one solution. Oracle Business Intelligence Analytics helps to improve planning and make better-grounded decisions to achieve objectives faster and with less effort. Users can easily load the data from both internal and external sources into the system and report the results.
Financial and HR departments are the most evident beneficiaries of Oracle Analytics. Key moments in employees’ work, turnovers, financial management, forecast vs. actual results, and many related issues are in the focus. The current article deals with building datasets for financial and human resources needs. You will get a step-by-step guide on setting up the Analytics and data visualization for the results.
Data Sources
Here you can find the CSV and XLSX files with sample datasets to use during our exercises. You can download them and then upload them into your Oracle OAC.
- Calendar Time dataset
- Human Resource datasets: HR Employee Attrition and HR Turnover Data
- Financial dataset
Oracle Financial Analytics Data Model
Our first step is to build the data model.
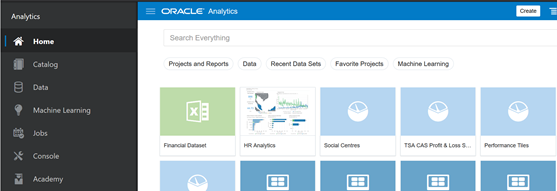
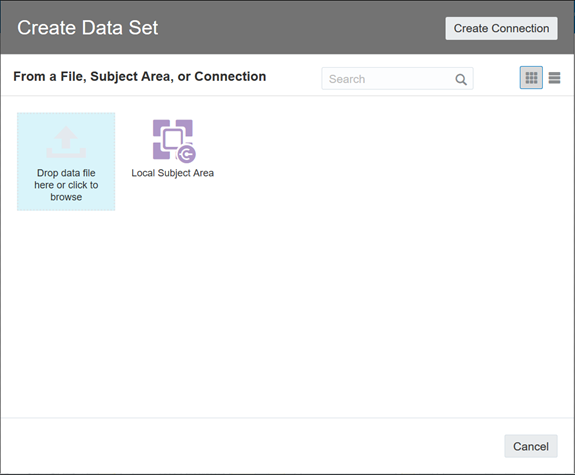
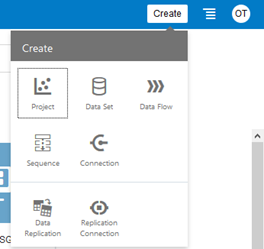
Log in to Oracle Analytics and click the Create button in the top-right corner. Select Data Set
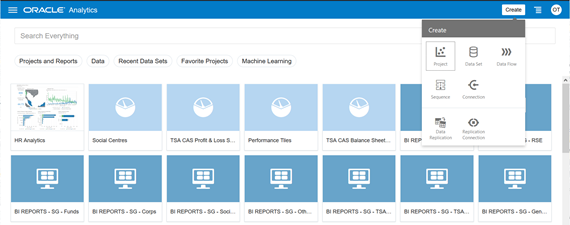
In the new Create Data Set popup window, choose Drop data file here or click to browse

Browse to the locally saved dataset. In this example, we are going to work with the Financial dataset.
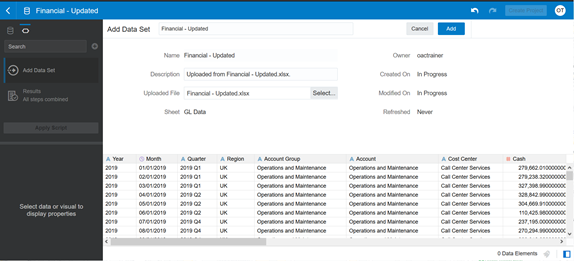
Enter the name of the dataset: Financial Dataset. Then click the Add button.
Click the Metadata icon to review the dataset metadata.
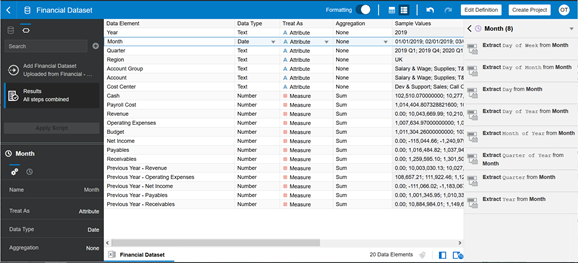
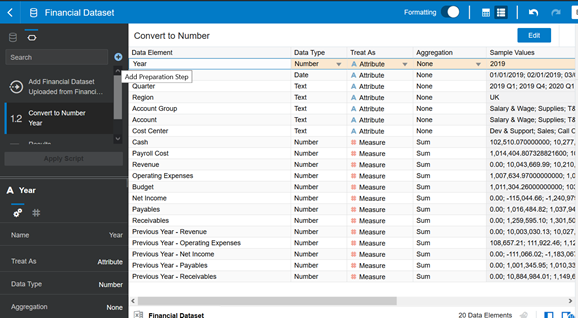
Update the Data Type, Properties, and Aggregation functions accordingly.
| Column Name | Data Type | Treat As | Aggregation |
| Year | Number | Attribute | None |
| Month | Date | Attribute | None |
| Quarter | Text | Attribute | None |
| Region | Text | Attribute | None |
| Account Group | Text | Attribute | None |
| Account | Text | Attribute | None |
| Cost Center | Text | Attribute | None |
| Cash | Number | Measure | Sum |
| Revenue | Number | Measure | Sum |
| Operating Expenses | Number | Measure | Sum |
| Budget | Number | Measure | Sum |
| Net Income | Number | Measure | Sum |
| Payables | Number | Measure | Sum |
| Receivables | Number | Measure | Sum |
| Previous Year – Revenue | Number | Measure | Sum |
| Previous Year – Operating Expenses | Number | Measure | Sum |
| Previous Year – Net Income | Number | Measure | Sum |
| Previous Year – Payables | Number | Measure | Sum |
| Previous Year – Receivables | Number | Measure | Sum |
Click Apply Script. You need to run this after making any changes to the dataset. Otherwise, the changes won’t be saved.
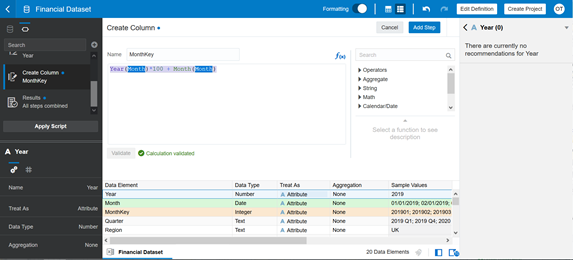
Create a new column named MonthKey. It is extracted from the Month column by using Expression. The column is of the Integer data type and YYYYMM format.
Click Plus to Add Preparation Step.
- Enter the name of the new column as MonthKey
- Build expression: Year(Month)*100 + Month(Month)
- Click Validate to make sure there is no invalid syntax
- Click Add Step
- Click Apply Script
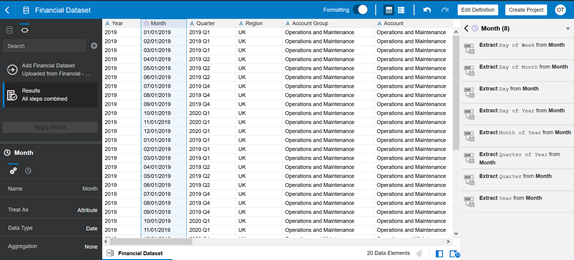
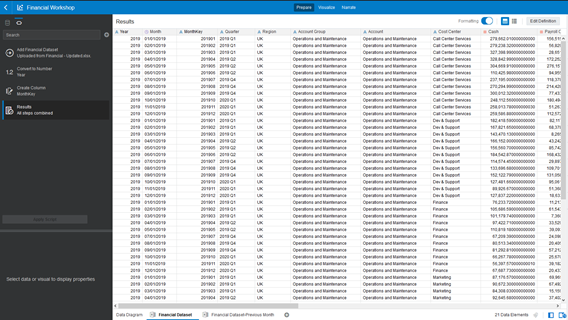
Click on the Data icon to view data:
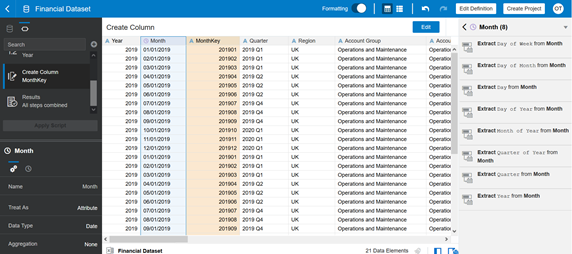
After uploading a dataset, the AI/ML engine of OAC will run and provide recommendations for data extracting from an existing column, such as date, geography, email, phone, currency, etc. Based on the Financial dataset, OAC will know that the Month column includes Date. So, it is recommended to extract the time data from the Month column.
- Day Of Week
- Day Of Month
- Day Of Year
- Month Of Year
- Quarter of Year
- Quarter
Click on a hamburger icon in the top-left corner (Navigator) > Data
Choose Financial Dataset > Duplicate
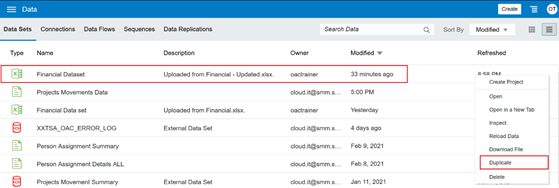
A new entry is created. However, it does not create a new data source. The new entry in OAC points to the same data source.
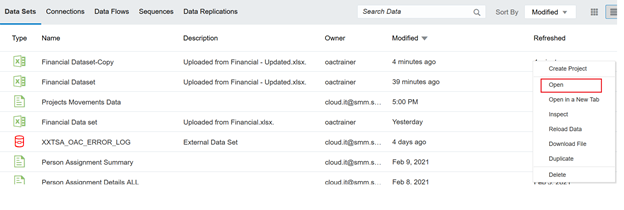
Click to open a new dataset:
Change the name of a new dataset to Financial Dataset-Previous Month. We’ll use it to build some Time analysis, such as Month Over Month.
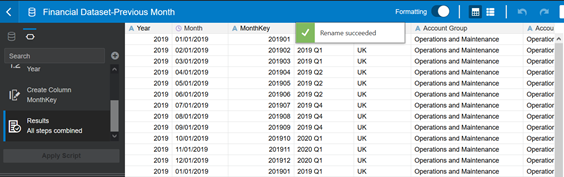
Click on the MonthKey column > Edit… Update the expression accordingly:
CASE WHEN MONTH(Month)=12 THEN (YEAR(Month)+1)*100 + 1
ELSE YEAR(Month)*100 + MONTH(Month) +1 END
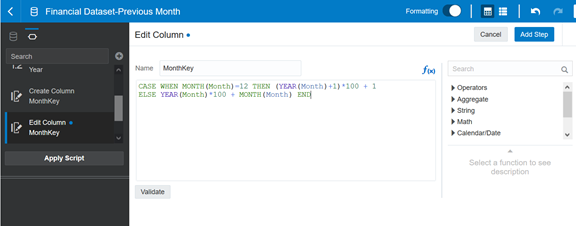
Click Add Step, then Apply Script.
HR Dataset Preparation
Click Create in the top-right corner > Data Set

In the Create Data Set popup window, choose Drop data file here or click to browse:
Browse to the HR-Employee-Attrition.csv dataset:
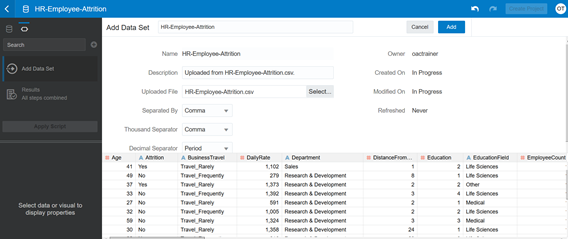
Rename that dataset to HR Employee Attrition and click Add. Then click on the Metadata icon:
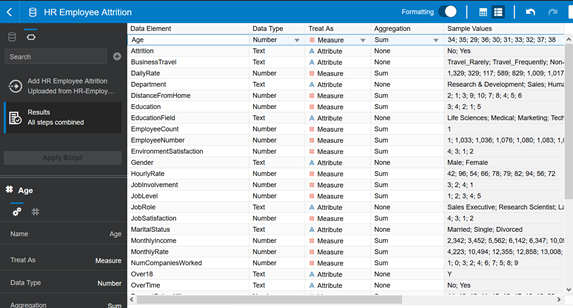
Rename and update the Data Type, Properties, and Aggregation functions accordingly:
| Column Name | New Column Name | Data Type | Treat As | Aggregation |
| Age | Number | Attribute | None | |
| Attrition | Text | Attribute | None | |
| BusinessTravel | Business Travel | Text | Attribute | None |
| DailyRate | Daily Rate | Number | Attribute | None |
| Department | Department | Text | Attribute | None |
| DistanceFromHome | Distance From Home | Number | Measure | Sum |
| Education | Education | Number | Attribute | None |
| EducationField | Education Field | Text | Attribute | |
| EmployeeCount | Employee Count | Number | Measure | Sum |
| EmployeeNumber | Employee Number | Number | Attribute | |
| EnvironmentSatisfaction | Environment Satisfaction | Number | Attribute | |
| Gender | Gender | Text | Attribute | |
| HourlyRate | Hourly Rate | Number | Attribute | |
| JobInvolvement | Job Involvement | Number | Attribute | |
| JobLevel | Job Level | Number | Attribute | |
| JobRole | Job Role | Text | Attribute | |
| JobSatisfaction | Job Satisfaction | Number | Attribute | |
| MaritalStatus | Marital Status | Text | Attribute | |
| MonthlyIncome | Monthly Income | Number | Measure | Sum |
| MonthlyRate | Monthly Rate | Number | Attribute | |
| NumCompaniesWorked | Num Companies Worked | Number | Attribute | |
| Over18 | Over 18 | Text | Attribute | |
| OverTime | Over Time | Text | Attribute | |
| PercentSalaryHike | Percent Salary Hike | Number | Attribute | |
| PerformanceRating | Performance Rating | Number | Attribute | |
| RelationshipSatisfaction | Relationship Satisfaction | Number | Attribute | |
| StandardHours | Standard Hours | Number | Attribute | |
| StockOptionLevel | Stock Option Level | Number | Attribute | |
| TotalWorkingYears | Total Working Years | Number | Measure | Sum |
| TrainingTimesLastYear | Training Times Last Year | Number | Measure | Sum |
| WorkLifeBalance | Work-Life Balance | Number | Attribute | |
| YearsAtCompany | Years At Company | Number | Attribute | |
| YearsInCurrentRole | Years In Current Role | Number | Attribute | |
| YearsSinceLastPromotion | Years Since Last Promotion | Number | Attribute | |
| YearsWithCurrManager | Years With Curr Manager | Number | Attribute |
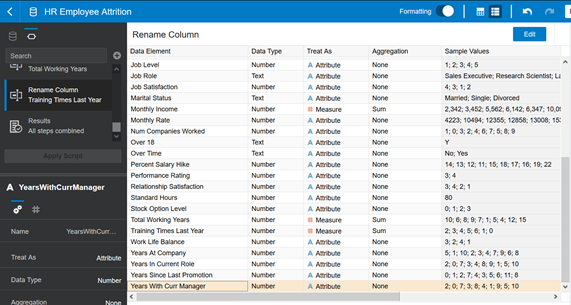
Click Apply Script.
Add Preparation Step > Add a new column
- Upload HR_Turnover_Data-Updated.xlsx for the Turnover analysis
- Choose the New Joiners sheet
- Enter the name HR Employee New Joiners, click Add
- Add Preparation Step > Add new column DateKey by using the following expression:
(YEAR(Date of Join)*100+MONTH(Date of Join))*100+DAYOFMONTH(Date of Join)- Again, upload HR_Turnover_Data-Updated.xlsx for the Turnover analysis
- Choose the Leavers sheet
- Enter the name HR Employee Leavers, click Add
- Add Preparation Step > Add new column DateKey by using the below expression:
(YEAR(Date of Leaving)*100+MONTH(Date of Leaving))*100+DAYOFMONTH(Date of Leaving)Data Modelling: Financial Data Model
In the top-right corner, click Create > Project
Choose the Financial datasets: Financial Dataset and Financial Dataset – Previous Month
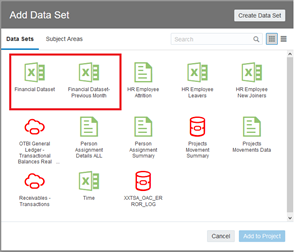
Enter the project name: Financial Workshop
Click on the Prepare tab
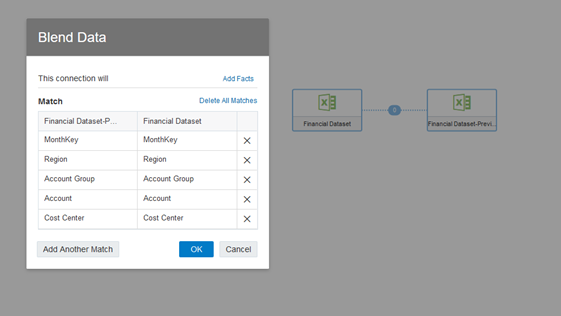
Click on the Data Diagram to build the relationship between two datasets. By default, there is no link, so we are creating the link based on MonthKey, Region, Account Group, Account, and Cost Center columns.
- Click on the dotted line, and the Blend Data popup appears
- Click Add Another Match to add connection, then OK.
- Click Add Data Set, then choose the Calendar Time dataset. If this dataset is not present, add a new dataset by uploading the Calendar Time.csv file
- Click on the dotted line between Financial Dataset and Calendar Time, creating the link
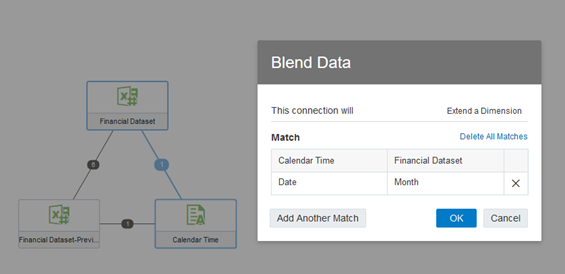
Click Save.
Data Stories: Financial Workshop
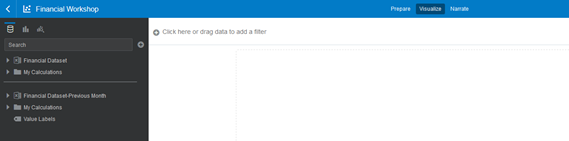
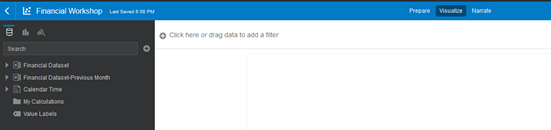
Open the Financial Workshop project and click on the Visualize tab.
Right-click on My Calculations > Add Calculation and provide the following info:
% Operating Expense to Revenue = Operating / Revenue
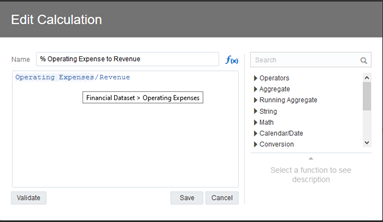
You should choose columns from the Financial Dataset.
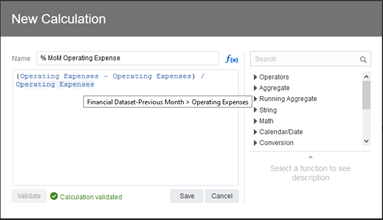
Add new calculation: % MoM Operating Expense
Expression: (Operating Expense of Month (N) – Operating Expense of Month(N-1)) / Operating Expense of Month(N-1)
Add new calculation: % MoM Receivables
Expression: (Receivables of Month (N) – Receivables of Month(N-1)) / Receivables of Month(N-1)
Add new calculation: % MoM Payables
Expression: (Payables of Month (N) – Payables of Month(N-1)) / Payables of Month(N-1)
Add new calculation: % MoM Gross Revenue
Expression: (Revenue of Month (N) – Revenue of Month(N-1)) / Revenue of Month(N-1)
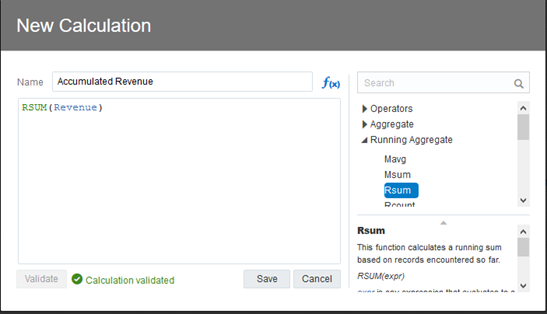
Add new calculation: Accumulated Gross Revenue
Expression: Running SUM of all revenue base on Time
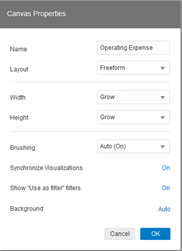
Operating Expense Canvas
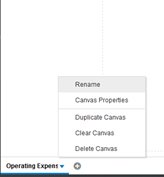
Rename Canvas 1 to Operating Expense. Click on the triangle icon of canvas > Canvas Properties
Select Freeform in the Layout dropdown list and click OK.
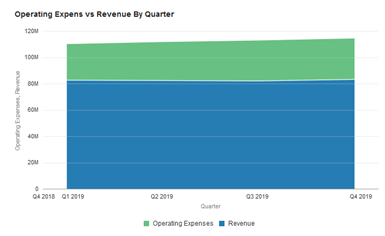
Operating Expense vs Revenue by Quarter
- Drag and drop Operating Expense, Revenue, and Quarter from the dataset into the Visualization area
- Choose the chart type: Stacked Area chart
- Values (Y-Axis) should include Operating Expense and Revenue measures
- Category (X-Axis) should include Quarter
- Change the title of the chart to Operating Expense vs Revenue By Quarter
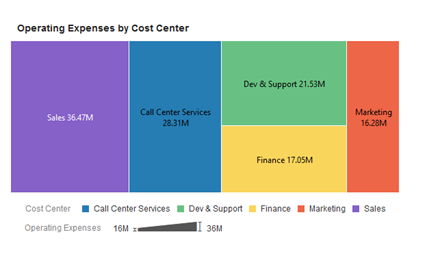
Operating Expense by Cost Center
- Drag and drop Operating Expense and Cost Center from the dataset into the Visualization area
- Choose the chart type: Treemap chart
- Values (box size) – Operating Expense
- Color – Cost Center
- Change the title of the chart to Operating Expenses By Cost Center
- Legend: Bottom
- Data Labels should display Label and Value
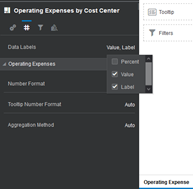
- Number Format: Number
- Abbreviate = On
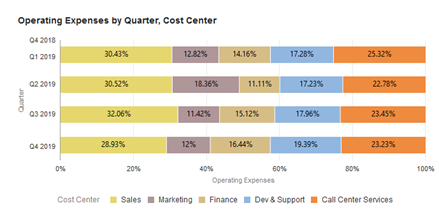
Operating Expense by Cost Center vs Quarter
- Drag and drop Operating Expense, Cost Center Quarter from the dataset into the Visualization area
- Choose the chart type: Horizontal 100% Stacked Bar chart
- Values (Y-Axis) – Operating Expense
- Category (X-Axis) – Quarter
- Color – Cost Center
- Change the title of the chart to Operating Expenses By Cost Center vs Quarter
- Legend: Top
Operating Expense Change by Month
- Drag and drop Operating Expense and Month from dataset into the Visualization area
- Choose the chart type: Waterfall chart
- Values (Y-Axis) – Operating Expense
- Category (X-Axis) – Quarter
- Color – Cost Center
- Change title of the chart to Operating Expenses By Cost Center vs Quarter
- Legend: Top
Conclusion
This way, the article demonstrated how to configure the Oracle Data Visualization Desktop to build the datasets for financial and HR needs. Also, we touched on the visualization basics to obtain the oracle business intelligence analytics results in a visual form. The further dashboard tutorials will cover other specific tasks we can perform with the Oracle Sales Cloud Analytics.
Tags: financial dashboards, oracle analytics, oracle visualiztion Last modified: September 16, 2021