Advanced Analytics is a mandatory trend for Business Intelligence platforms and Self-service Analytics tools. It offers a set of statistic functions and algorithms, such as trending, forecast, etc. They help business users, analysts, and others specialists to deep dive into data insights for making better business decisions.
The current article is the first part of the series dedicated to the usage of Advanced Analytics with Oracle Analytics and data hosted in Oracle Autonomous Data Warehouse (ADW). It is not going to cover all the details about statistic functions, algorithms, or probability functions. We are going to discover prebuilt Advanced Analytics features developed in Oracle Analytics.
Table of contents
- Prerequisites
- Install Machine Learning and Advanced Analytics
- Create Visualization Project
- Build Advanced Analysis
- Conclusion
Prerequisites
Before we start, make sure to download and install the latest version of Oracle Analytics Desktop (version 5.9.0). Follow the system hints and also install the additional packages (we discussed it in previous articles) to get the working environment up and running.
To configure the necessary settings and perform the tasks, also download the sample CSV file with data and load the data into the ADW database instance.
Create ADW connection and a dataset named SALES_ORDERS (refer to the article Sales Analysis with Oracle Desktop Visualization and Autonomous Database for the detailed guideline).
We need to perform the following tasks:
- Create a Reference Line in the visualization
- Generate Forecast and Trend-line
Let’s start.
Install Machine Learning and Advanced Analytics
If you are running Window OS, make sure you have permission to install it. Close the Oracle Analytics Desktop if you are running it, and go to the Windows Start menu.
Browse to Oracle > click Install DVML
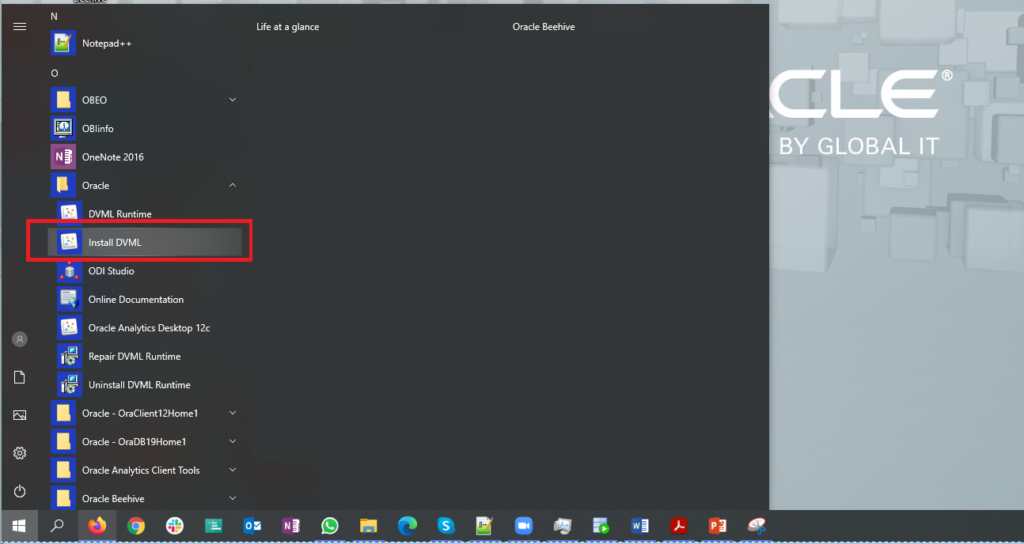
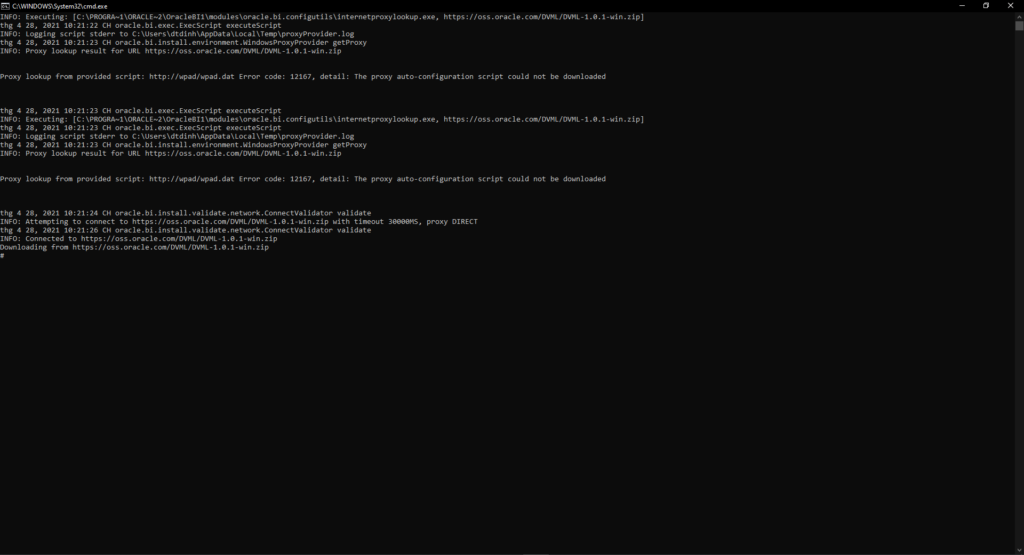
Follow the instruction to install the Machine Learning package. When it is complete, click Finish and click any key to close the terminal window.
Create Visualization Project
Click on Create > Project. The Add Data Set screen will appear. Click Cancel to close it. We’ll add the datasets to our project later.
Enter the project name: Advanced Sales Analysis. Then click Add to add datasets.
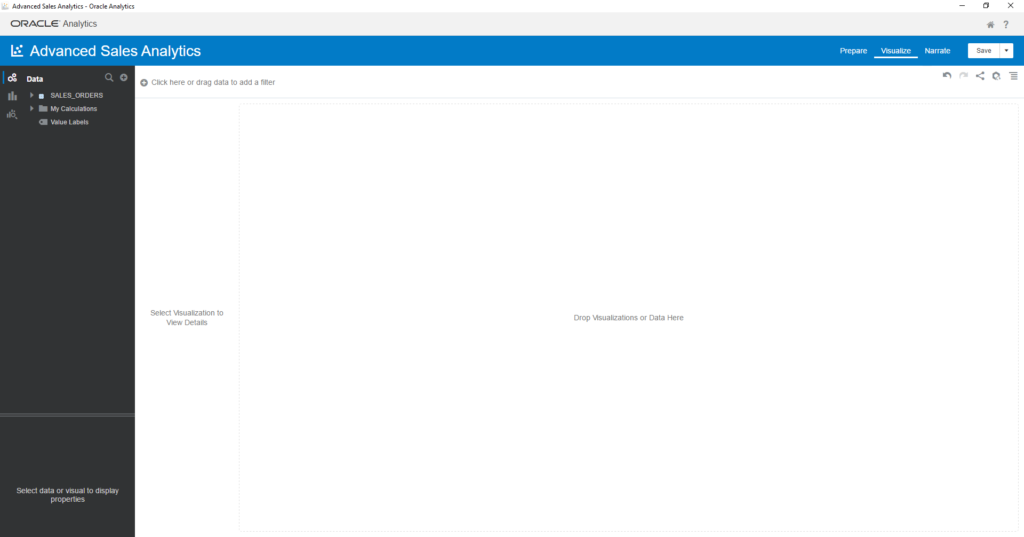
Choose the created SALES_ORDERS dataset > Click Add to Project.
Build Advanced Analysis
Let’s assume that you are working for a retail company as a business analyst. You have to analyze the revenue trends, customers’ behavior, etc. You need to have a business plan to improve profitability based on your analysis. For that, you need to use Advanced Analytics features in Oracle Analytics Desktop.
Oracle Advanced Analytics: Reference Line
We can use Reference Line to discover products that bring outstanding revenues and lost products. To build it, do the following:
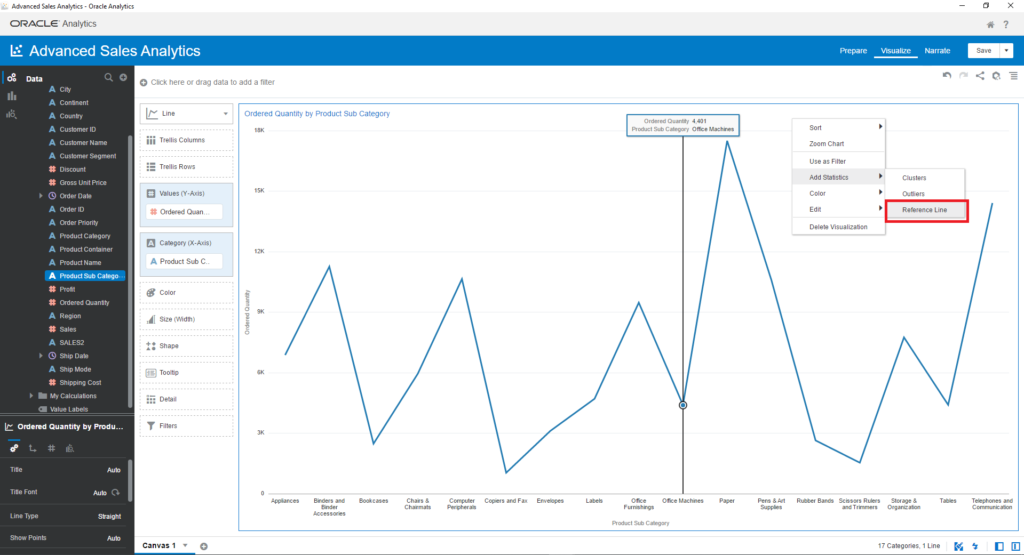
- Drag and drop Product Sub Category and Quantity Ordered into Visualization panel
- Choose the Line chart type
- Right-click on chart > Add Statistics > Reference Line. By default, it uses the Average function to build, and the method is Line
- Drag and drop Product Sub Category and Profit to create a new visual
- Choose the Line chart type
- Add Reference Line to this visual
- Change the Reference Line method to Band and function to Custom (Average to Maximum)
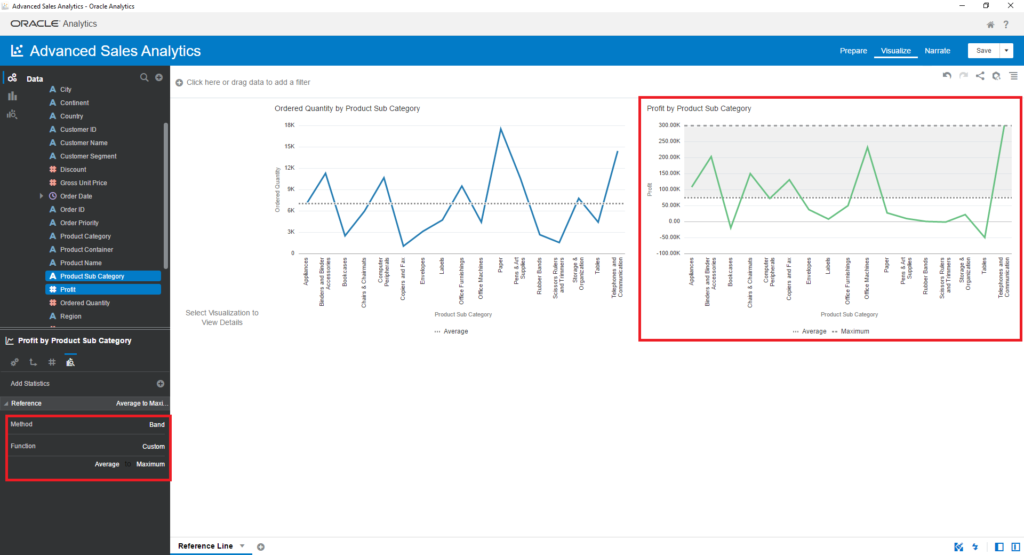
In the visual, you can see which products are between average and best, and which products are under average
- Drag and drop Profit and Ordered Quantity into the Visualization panel
- Choose the Scatter chart type
- Drag and drop Product Sub Category into Category (Points) and Color properties
- Right-click on the chart > Add statistics > Reference Line
- Add Reference Line once more
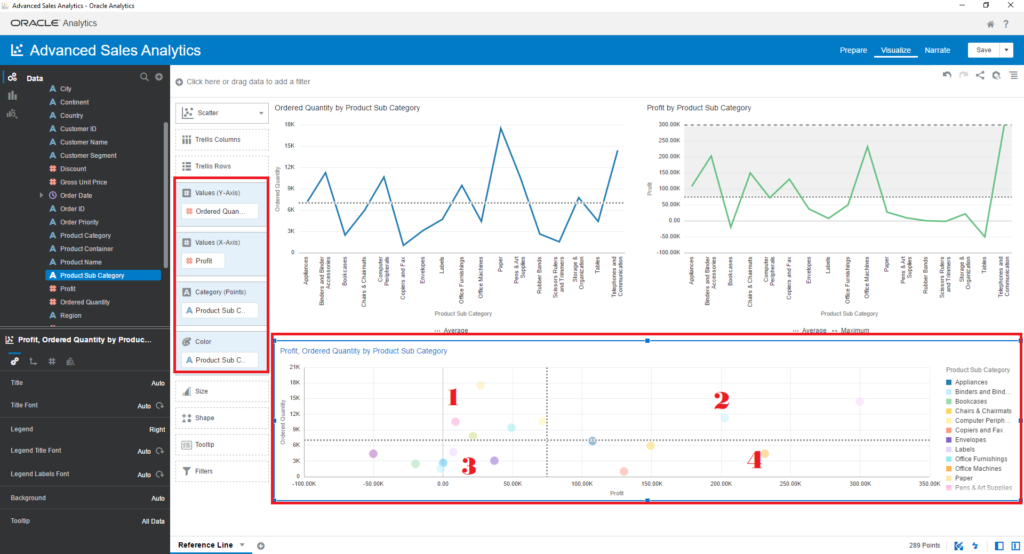
As you can see, for the products in 1, you need to take special actions for more profit, and for the products in 4, you need to run some promo campaigns to increase the ordered quantity and profit.
Oracle Advanced Analytics: Trend Line
Trend Line helps to find out general patterns/direction of data when you analyze it in time series. This use case requires you to understand the trends of Sales
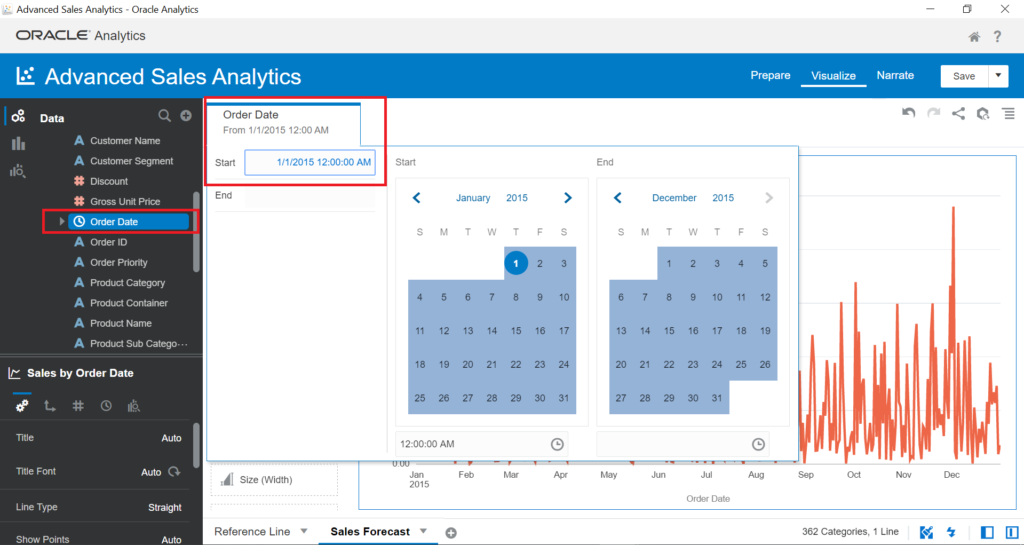
- Add new Canvas and rename it to Sales Forecast
- Drag and drop Order Date and Sales into the Visualization area
- Choose the Line chart type. Our dataset contains Sales data for 5 Years. We’ll focus on 2015
- Drag and drop Order Date to the Canvas filter on the top of the page
- Select the Start Date = 1/1/2015
Right-click on the visual > Add statistics > Trend Line
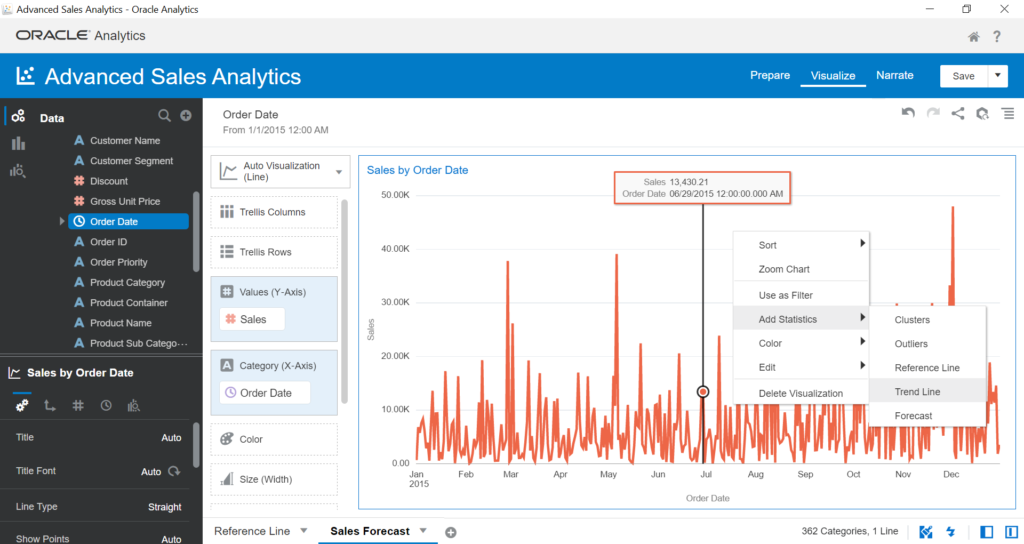
By default, the Trend Line uses the Linear algorithm to build the trend based on the time series and Confident Intervals of 95%. In the visual, it is the upward trend:
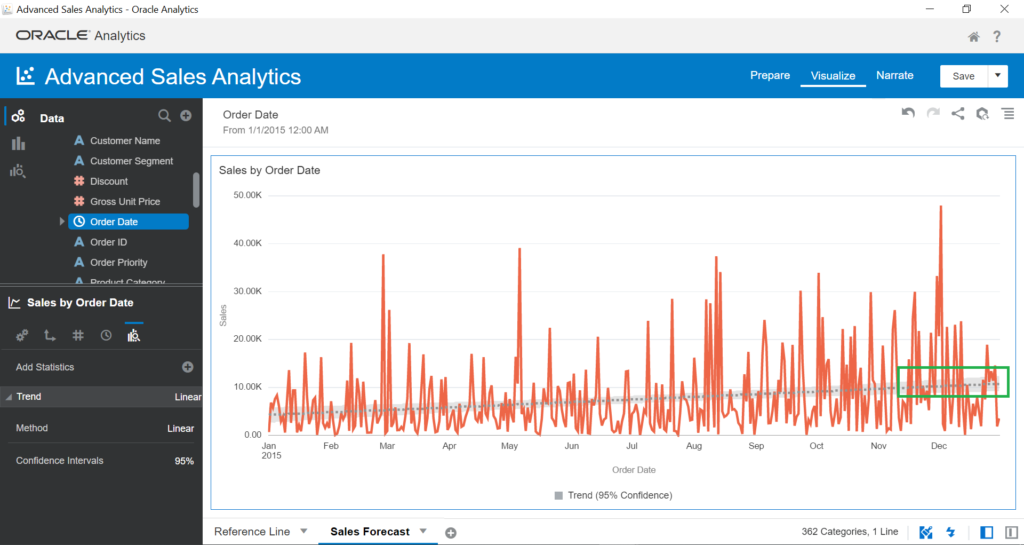
In the bottom-left panel, you can change the Method of the Trend Line to Exponential or Polynomial, and change the Confident Intervals to 90% or 99%
Let’s consider the Method and Confident Interval values.
- Method:
- Linear. A linear trend line best fits the linear data set. Your data is linear if the pattern points resemble a line. The trend shows whether your metric is increasing or decreasing at a steady rate.
- Polynomial. A polynomial trend line involves an equation with several factors. The main X value has various exponent degrees (level 2=x square, 3=x cubic power, etc.). The result is a curved line fits better when data fluctuates up and down. This is useful, for example, for understanding gains and losses over a large data set. The order of the polynomial can be determined by the number of fluctuations in the data or by how many bends (hills and valleys) appear in the curve.
- Exponential. An exponential trend line is a curved line that is most useful when data values rise or fall at increasingly higher rates. You cannot create an exponential trend line if your data contains zero or negative values.
- Confidence Interval
- A confidence interval is a range of values derived from sample statistics, which is likely to contain the value of an unknown population parameter. Because of the random nature, it is unlikely that two samples from a given population yield identical confidence intervals.
Now, we need to discover the relationship between Sales and Profit:
- Drag and drop Sales and Profit into Visualization and choose the Scatter chart type
- Drag and drop Product Sub Category into Category (Points)
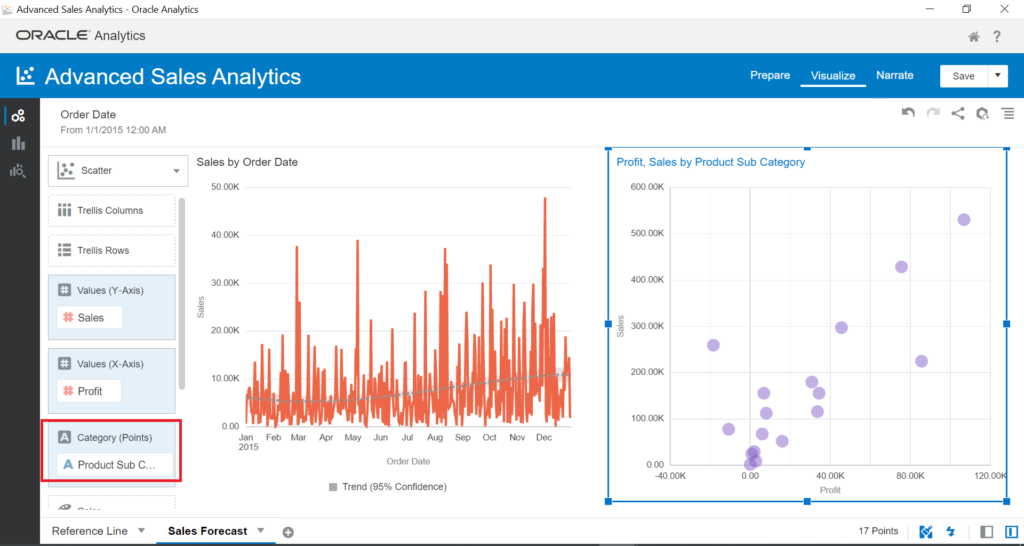
– Right-click on the visual > Add statistic > Trend Line
We need to swap Profit and Sales. Sales are X-Axis and Profit is Y-Axis
Next, move your mouse on the visual to see the Profit Trend formula. As you see, the Trend Line does not only show the data trend against time series – it also serves to find out mathematical relation between two variables.
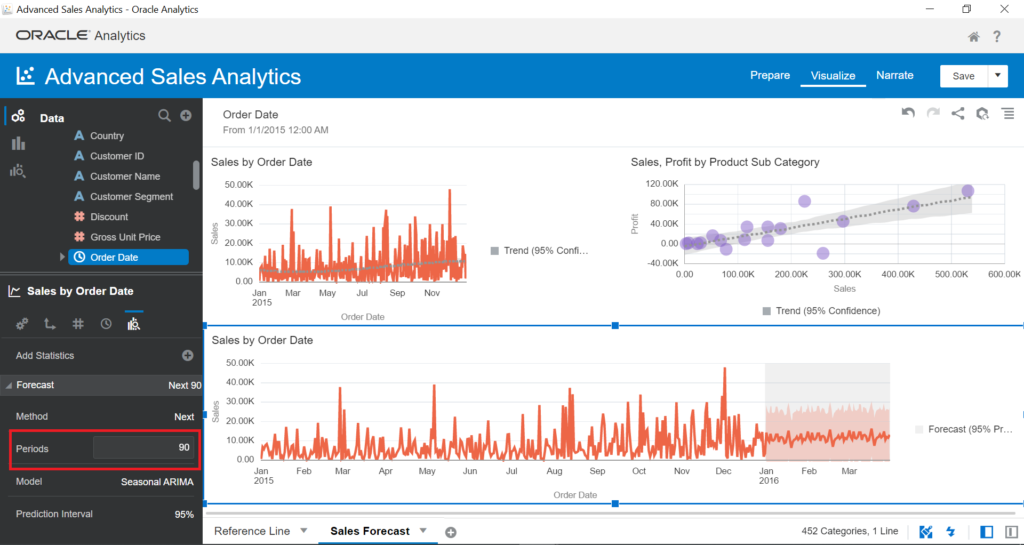
Oracle Advanced Analytics: Forecast
We use the Forecast Line to build forecasted Sales:
- Drag and drop Sales and Order Date into the Visualization panel
- Choose the Line chart type
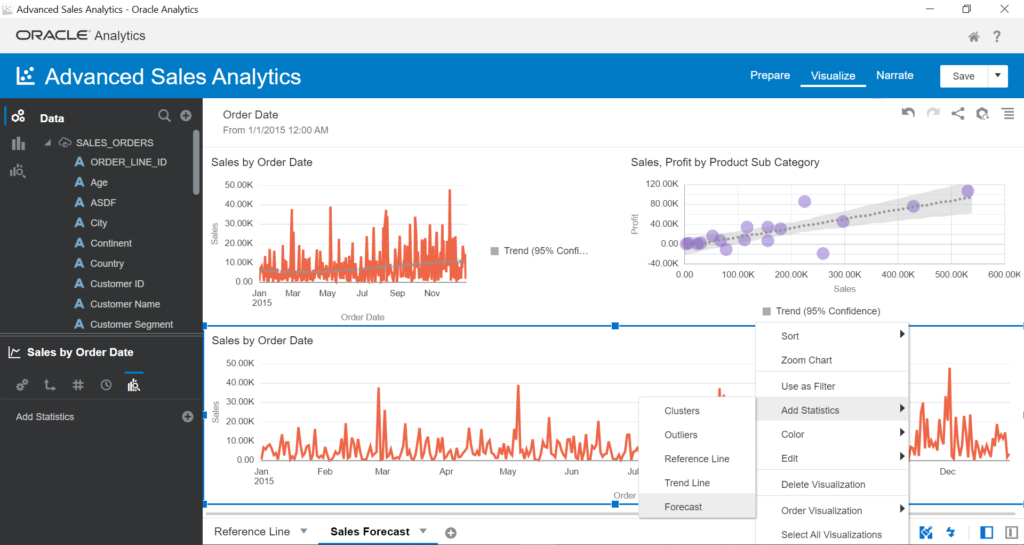
- Right-click on the visual > Add Statistics > Forecast

In the bottom-left panel, you can see the properties of your Forecast. The model is Seasonal ARIMA, and the period is 3. Therefore, Forecast provides the prediction of Sales for the next 3 days because the analysis uses the Order Date for time series. Let’s change the period to 90 and predict Sales for the next 90 days:
The model of Forecast is Seasonal ARIMA. Click on it, and it will show the forecast calculation options:
- Seasonal ARIMA
- ARIMA
- ETS (Estimation Time Series)
To validate the algorithm used in the Forecast Line, we create a new visual, filter the data of 2014, and add the Forecast Line. When we have the Forecast results, we can compare the forecasted Sales of the next 90 days to the Sales of the first three months of 2015.
Conclusion
The current tutorial explained how to get the Sales insights with the help of Advanced Analytics features in Oracle Analytics. There is a set of prebuilt prediction algorithms, statistical functions, and advanced functions making these tasks much faster and simpler for the analysts.
Using these features, we can quickly highlight the common patterns and trends of the data, and abnormal data with minimal effort. Stay with me, and we’ll proceed with the examination of useful options in the next articles!
Tags: advanced analytics, oracle analytics, oracle autonomous database Last modified: September 22, 2022