
This is the second part of the article dedicated to working with Data Flow in Oracle Analytics when the data is hosted in Oracle Autonomous Data Warehouse. The previous part focused on setting up the Data Flow and initial configurations. Now, we are going to deal with building the Sentiment Analysis, another common use case.
Use Case Overview
The Sentiment Analysis is mostly used for processing users’ feedbacks. We’ll explore a similar use case. Let’s assume that some company sells products through the commercial website. We need to analyze all buyers’ comments and feedbacks to find out which products are good or bad for them.
In practice, this will demand the following actions:
- Use the Data Flow to find emotions from the Text field (negative or positive feedback).
- Using the Data Flow Develop Sentiment analysis based on comments and feedback from customers.
The task performance will demand 5 steps:
Create Data Flow
At this step, we create the Data Flow project and combine two datasets uploaded in the previous stage described in Part 1 of the article. You might need to refer to it to refresh the knowledge.
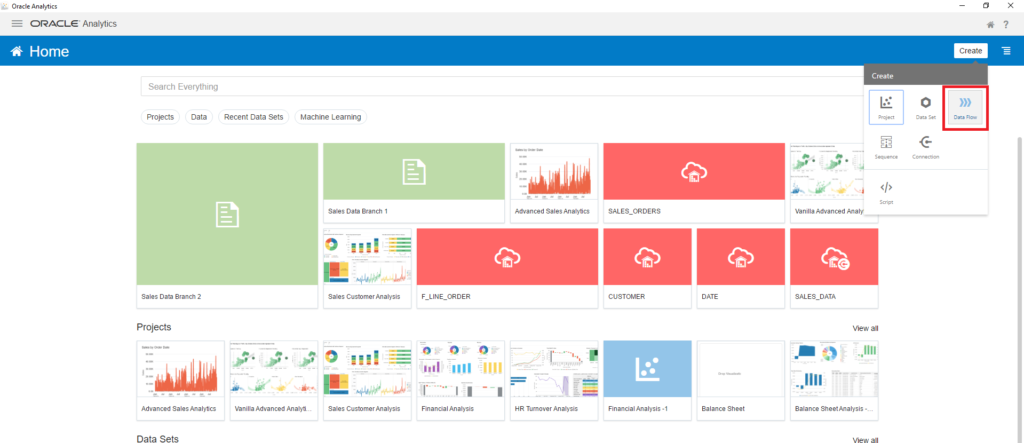
Navigate to the top-right corner, click Create > Data Flow
Upload raw data
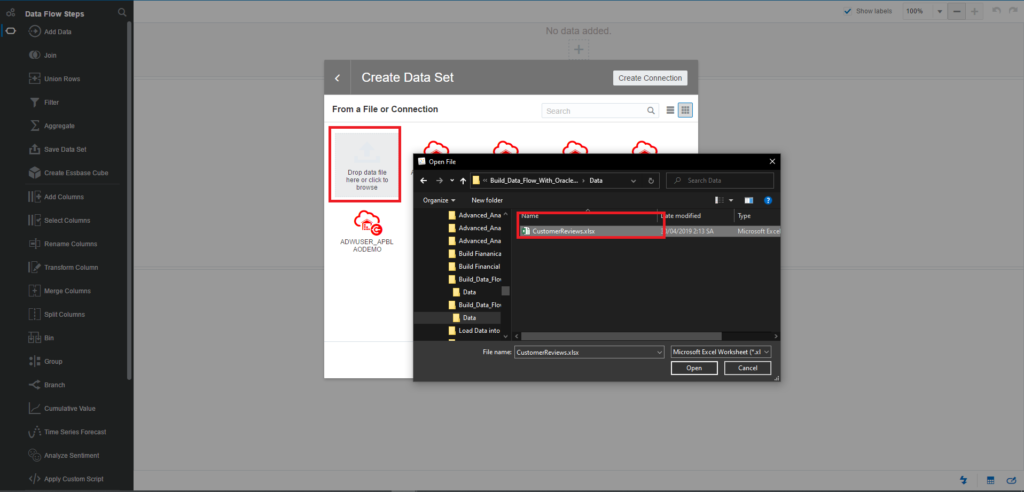
In the Add Data Set window that appears, click Create Data Set to upload the raw file. Click on the Drop data file here or browse to the necessary file.
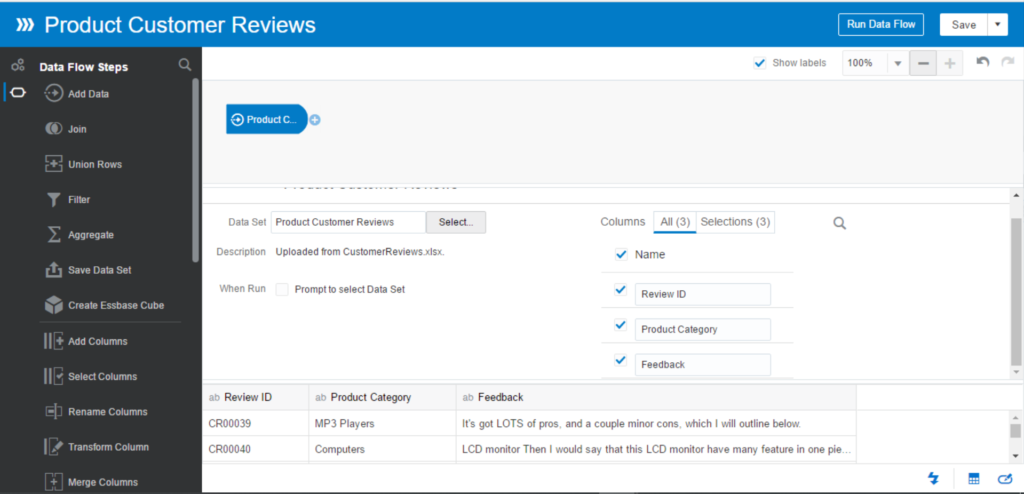
Enter Product Customer Reviews as the dataset name.
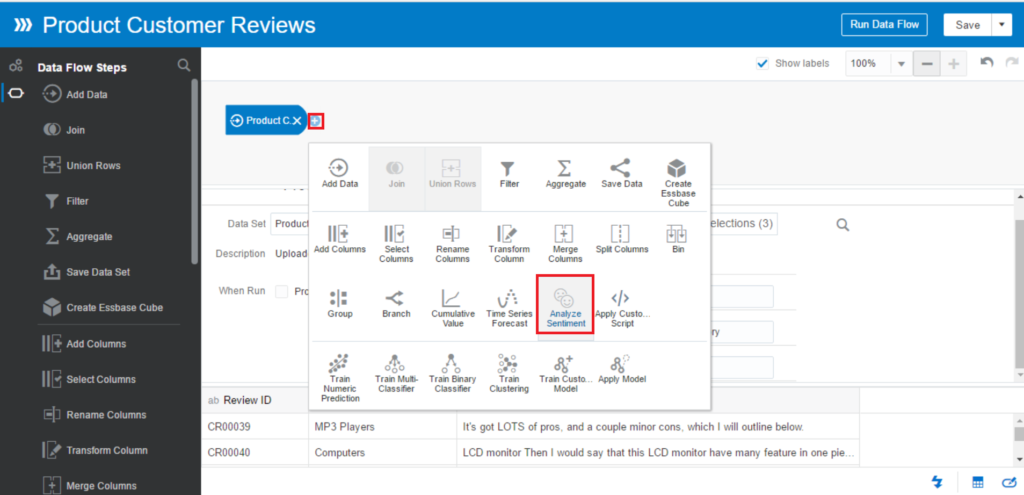
Click on the Plus icon in the dataset > Analyze Sentiment
The output of this step is a new column generated. By default, it is named emotion. You can rename it according to your needs.
In Parameters, select the text column in your dataset. In our case, it is the Feedback column.
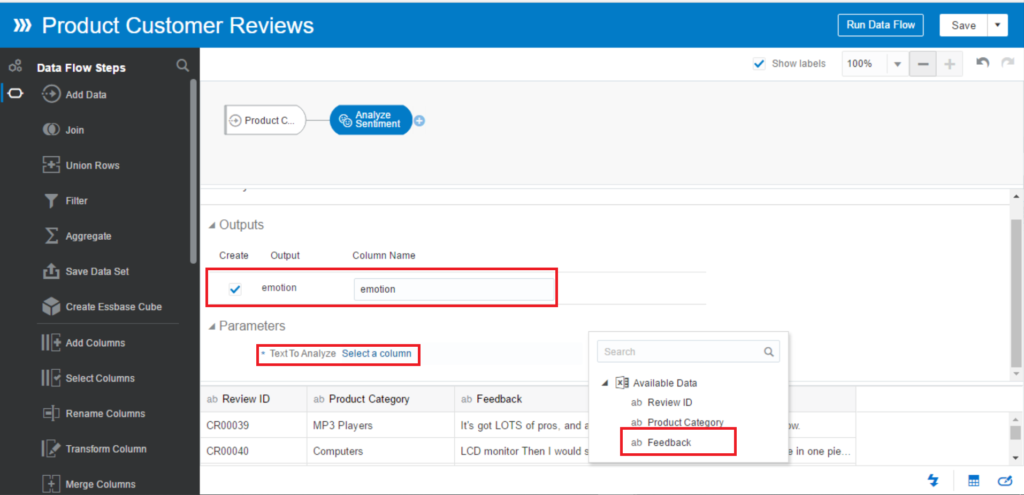
The outcomes of Sentiment Analysis can be categorized under Polarity and Subjectivity:
- Polarity: Neutral, Negative, or Positive
- Subjectivity: Objective or Subjective
The Analyze Sentiment step returns Polarity, so it can be Neutral, Negative, or Positive.
Apply Sentiment
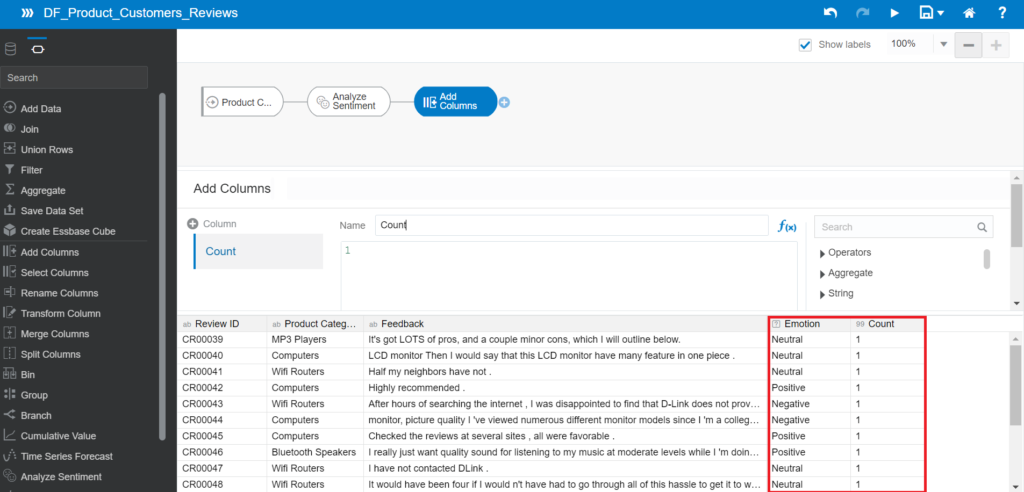
Click on the plus icon of Analyze Sentiment > Add Columns. In this step, we create the measure column to use in data visualizing later
- Enter expression: 1
- Click Apply
Now you can see new columns of Emotion and Count added to the dataset.
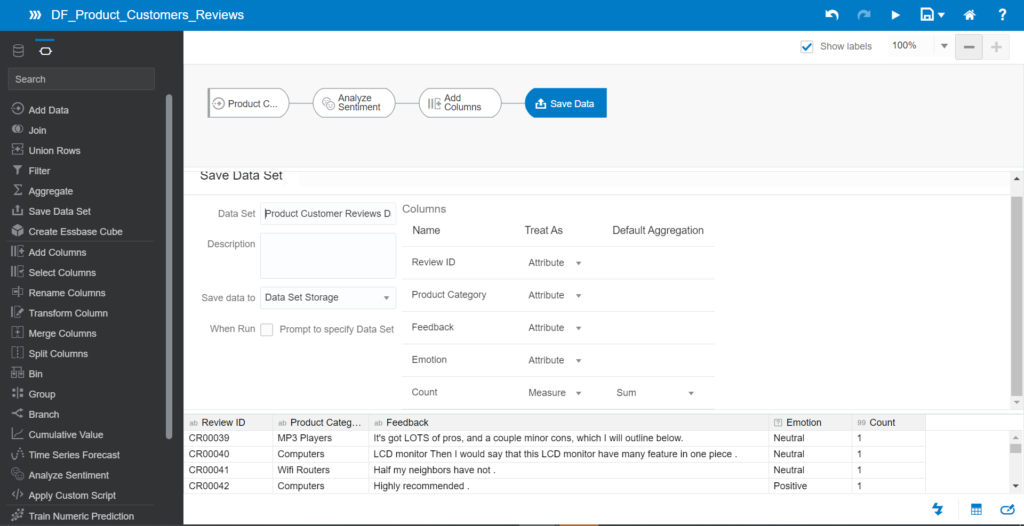
Save the new data to the dataset: click the plus icon of Add Columns > Save Data
- Enter the data set: Product Customer Reviews Dataset
- Save data to Data Set Storage
- Make sure to Count column as Measure
Save the Data Set
Save the Data Flow and run it to generate the data set. After that, go back to the Home page of the Oracle Analytics Desktop and navigate to the Data menu. You can see the new dataset there:
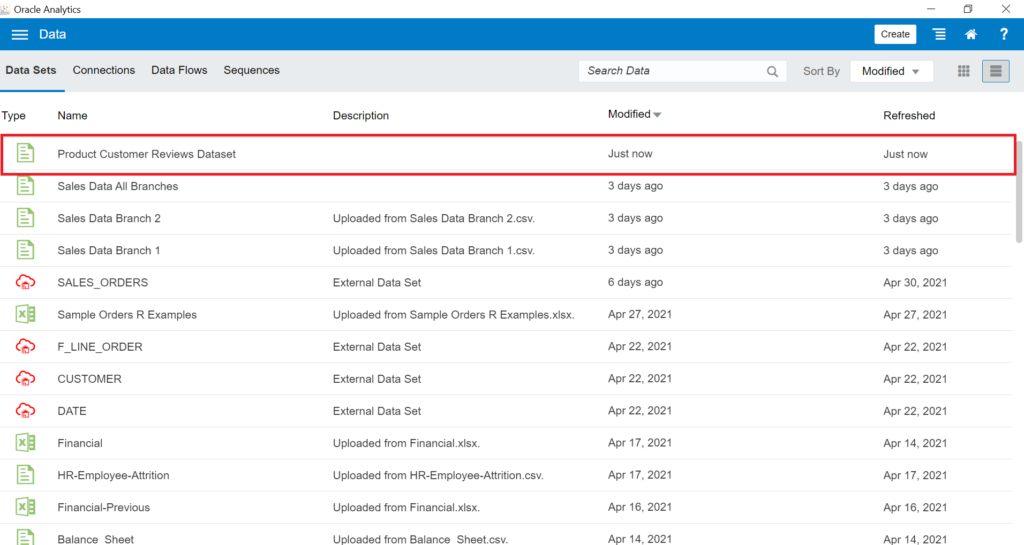
Now we can start visualizing this dataset.
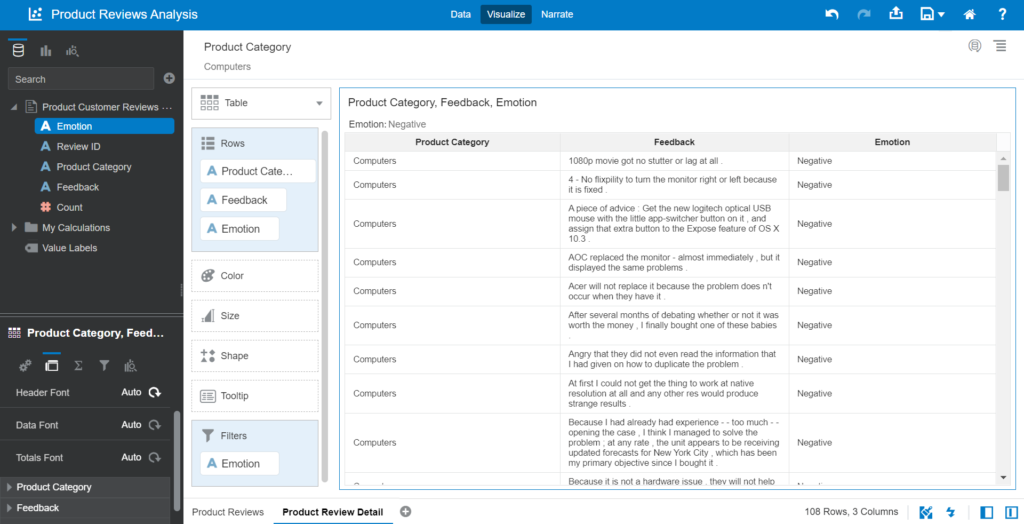
Create the Sentiment Analysis
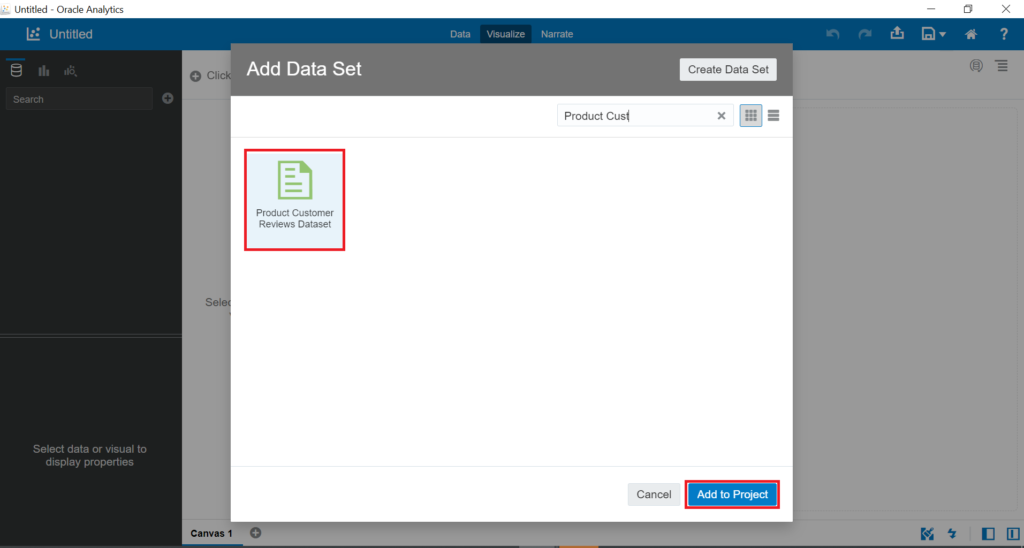
Create a new project named Product Reviews Analysis. Then Add Data Set: Product Customer Reviews Dataset
Create the Tile chart for the number of customer reviews:
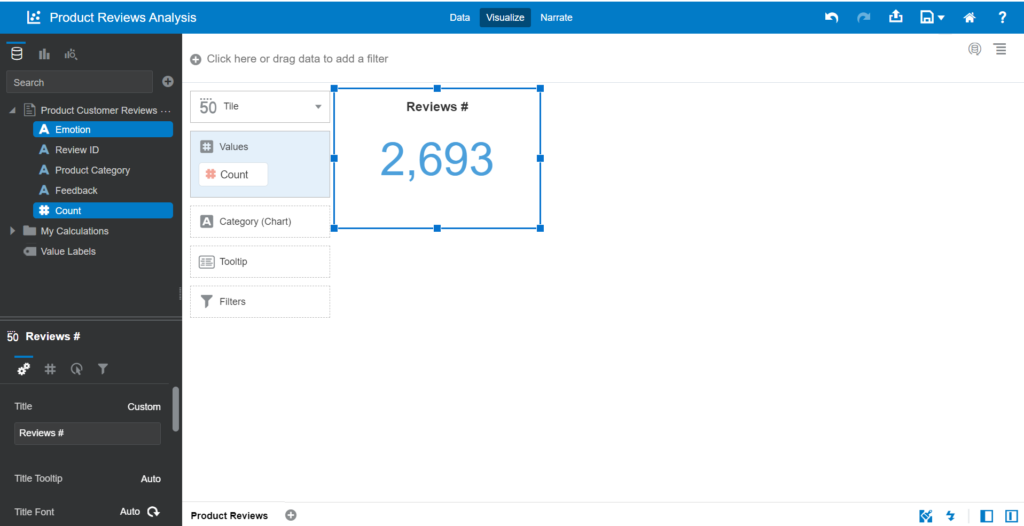
- Drag and drop Emotion and Count into the Visualization area
- Choose the Donut chart type
- Drag and drop the Emotion column into Color
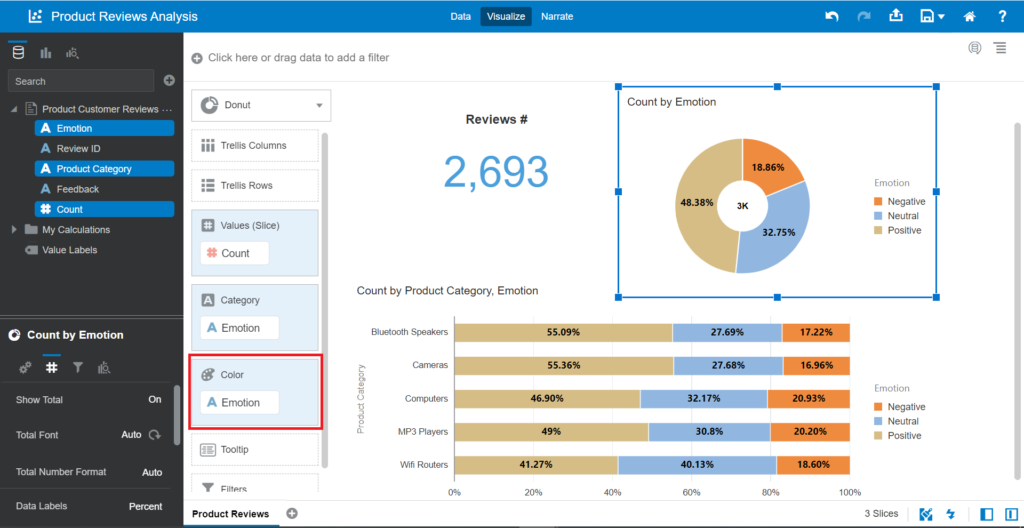
- Create a new chart – Horizontal 100% Stacked Bar
- Drag and drop Count into Values (Y-Axis) and Product Category into Category (X-Axis)
- Emotion in Color
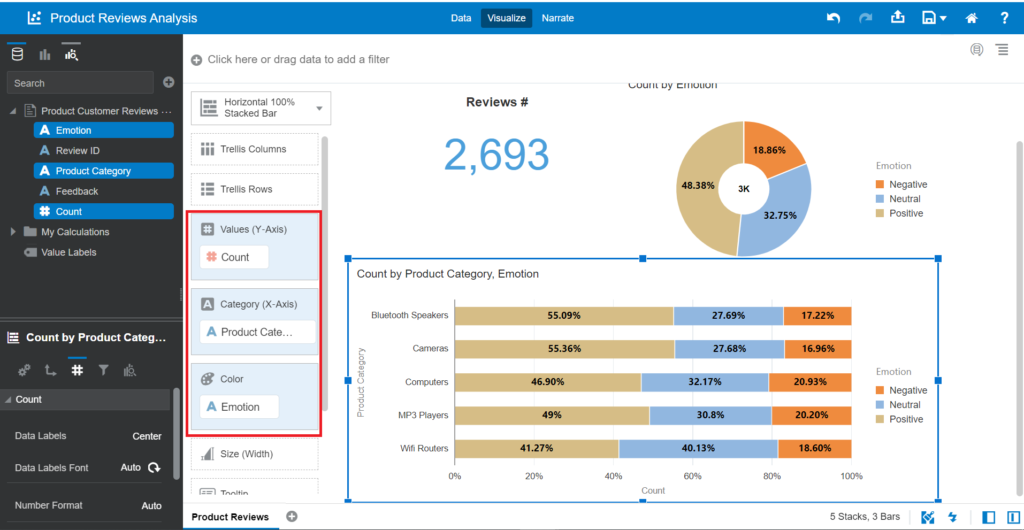
The visualization displays the % of Negative for Computers and MP3 Players as 20.93% and 20.20%. It is more than in other Product Categories. You need to analyze the data in-depth to discover the reason.
You can add more details to your visualizations to see how customers reviewed your products.
Conclusion
This tutorial demonstrated how to create the Sentiment Analysis based on the Customer Reviews dataset in a few simple steps in Oracle Analytics Desktop. This is the common use case for those analyzing the customers’ thoughts and feelings about products and services. For example, you can predict to employee attrition using Oracle Predictive Analytics.
Also, it is a popular method when you are working on the Social Media domain to discover trends in social networking. You can apply the same process to analyze data from social platforms such as Twitter, Facebook, etc.
You can build custom solutions if you have programming skills within Python or R libraries or any programming languages. However, Oracle Analytics allows you to build that analysis much faster and easier with its in-built features that won’t demand any programming skills from you.
Read also
Introduction to Advanced Analytics Features in Oracle BI Analytics
Learning Advanced Analytics Features with Oracle BI Analytics: Outliers and Clusters
Advanced Analytics with Oracle BI Data Analytics – Handling with Express Builder Functionality