
SQL Server Geography data type is unlike other types simply because you don’t use it often. It’s not like varchar, int, float, or DateTime present in every table, at least in one type.
Do we need the SQL Server Geography data type? To make sense of something new, we need to answer three fundamental questions:
• What problems does it solve? The answer lies in use cases.
• What are the things involved in studying it? You will learn a few basic definitions and acronyms. I collected only the important stuff, so it won’t bore you.
• Are there examples to further explain how it works and is it easy to implement? Our kind lives with code. We eat and sleep with it. So, we’re going to have sample codes in this post.
It is not a post to stuff you with tech jargon and syntax as is. You’re good to go once you have cracked the basics of SQL Server geography data type. Sounds good?
Let’s dive in.
Use Cases of Spatial Data
Let’s start with the most obvious and the top – the general term “spatial data.”
Spatial or geospatial data are the data on objects, events, or phenomena located on the Earth’s surface. In other words, it is information stuffed on a map. Think of Google Maps or Waze, for example.
But there’s more:
- Locate a company delivery truck through a website or mobile app.
- Find points of interest like nearby restaurants, banks, or hospitals.
- Analyze data on earthquake, the spread of COVID-19, flooding, or road traffic – geospatial analysis.
And so on.
Several database platforms are dealing with spatial data, but we will focus on just one.
What is SQL Server Geography Data Type?

Microsoft added geography and geometry data types in SQL Server 2008. Geography represents data in a round-earth coordinate system. It is also implemented as a .Net CLR data type, which has properties like latitude or longitude.
This post focuses on geography data type and its applications, particularly in:
- Points of interest, like locating nearby restaurants and a sample query.
- Geospatial analysis.
Since this is a data type, we create a table. Then, we define a column or columns as geography. And finally, we make a spatial index on those columns.
When you query a table with a geography column, the output will be in binary.
Let’s try executing an elementary example below:
SELECT
 [CityID]
,[CityName]
,[GeoLocation]
FROM [Cities]
Figure 1 below shows the result set:
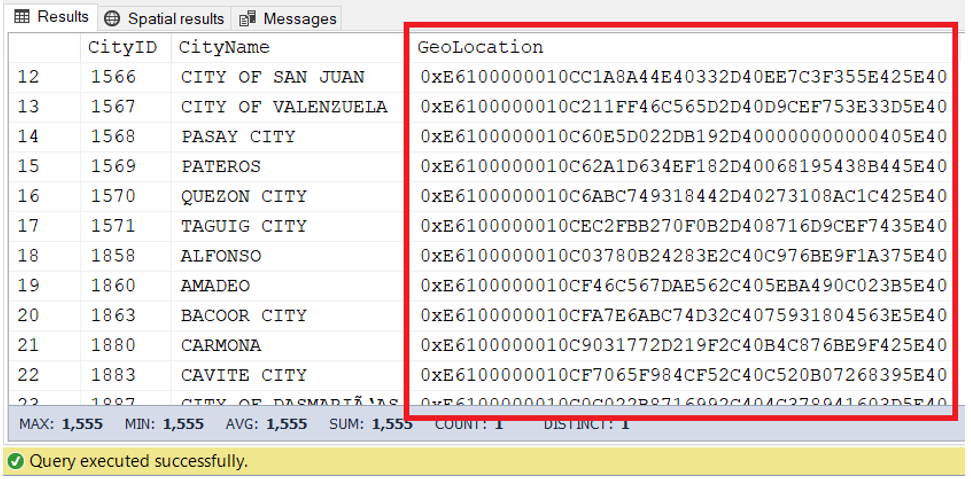
When a result set includes spatial data, a Spatial Results tab will also appear. Figure 2 illustrates the Spatial Results from the query above:
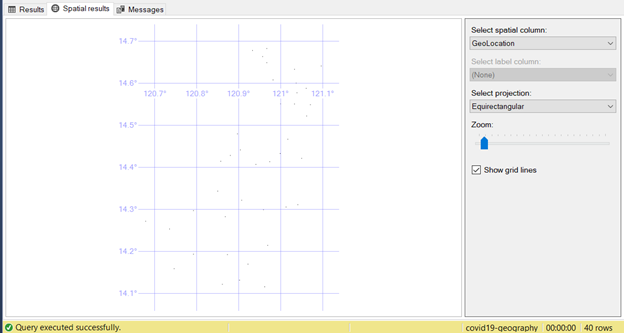
Now, what has just happened?
It seems that viewing the result set is far from easy and useful, let alone the dots along grid lines. I showed you what to expect at the very first SELECT statement on geography data types. The next section will unfold a much better perspective.
Creating SQL Server Geography Instances
You need an instance to operate on data with the SQL Server geography data type. There are four ways to make a geography instance:
- from another geography instance
- using a well-known text (WKT)
- using a well-known binary (WKB)
- from a Geography Markup Language (GML) text input
Let’s focus on using a well-known text.
Using Well-Known Text (WKT)
This representation grounds on the Open Geospatial Consortium (OGC). It allows geography data exchanging in textual form.
Take our previous example, but instead of a binary output, we will convert it to a string:
SELECT
 [CityID]
,[CityName]
,[GeoLocation].ToString() AS GeoLocationString
FROM [Cities]
Notice the ToString() method. It will convert the output to the string value. You can see the output in Figure 3 below:
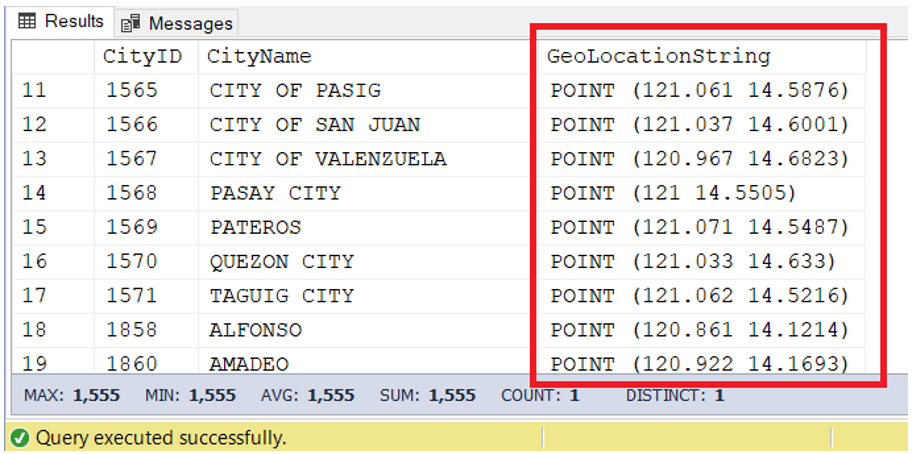
Better? Well, it’s still just numbers. But what if I tell you that these numbers are latitude and longitude of those cities? It makes more sense, right?
It is a well-known text (WKT), and it is essential when you put the data into the column. More on that later. Now, we need one more thing to examine.
Spatial Reference Identifier (SRID)
Aside from a well-known text, each geography instance has a Spatial Reference Identifier (SRID). It is necessary for measuring geography instances (places or points) in a round-earth mapping.
The most widespread unit of measurement is in meters or square meters, denoted by the SRID 4326. All other SRIDs can be found in sys.spatial_reference_systems.
Your geography columns can have different SRIDs. Note that when you perform operations on two geography instances, like measuring their distances. Both instances should have the same SRID, or it will return you NULL.
STGeomFromText
After learning about WKT and SRID, creating a geography instance requires a method called STGeomFromText. It has the following syntax:
geography::STGeomFromText(<WKT of geometric point(s)>, SRID)
Example:
INSERT INTO Cities
(CityName, GeoLocation)
VALUES
('CITY OF MANILA',geography::STGeomFromText('POINT(14.6077 120.98202)', 4326))
Let’s check out the parameter values:
‘POINT(14.6077 120.98202)’ – a well-known text of a point in the map with the latitude of 14.6077 and the longitude of 120.98202. This corresponds to Manila, the capital city of the Philippines.
4326 – the spatial reference identifier
Let’s jump right into examples and use this new gem we found.
SQL Server Geography Data Type Practical Examples
We’re going to have two common applications to get you up and running with geography data.
Calculating Distances (Nearest Neighbor)
A common application in geography spatial data is called the nearest neighbor query. In this query, you want to know how far or close something is to another object or place.
In my post about the SQL graph, I described how a customer could find the nearby restaurants from the current location. Let’s refer to that example again:
-- Query the location of the customer
DECLARE @deliveryLocation GEOGRAPHY

SELECT @deliveryLocation = Locations.GeoLocation
FROM Customers, willReceiveIn, Locations
WHERE MATCH(Customers-(willReceiveIn)->Locations)
AND Customers.CustomerID = 3

-- Query the restaurants within 1000 meters from the location of the customer
SELECT
 Restaurants.Name
,Restaurants.Description
,Restaurants.Opening
,Restaurants.Closing
,Locations.Description
,ROUND(Locations.GeoLocation.STDistance(@deliveryLocation),2) AS Distance
FROM Restaurants, isLocated, Locations
WHERE MATCH(Restaurants-(isLocated)->Locations)
AND locations.GeoLocation.STDistance(@deliveryLocation) <= 1000
ORDER BY Distance
The secret to this nearest neighbor query is STDistance(). It needs two geographical locations: the one for the customer, and another one for the restaurants within 1000 meters from the customer’s location.
The cool thing is, the same concept applies to other ideas involving two or more locations.
Geospatial Analysis Using Power BI
Another application of spatial data is using it for Geospatial analysis. In this section, we have an example using COVID-19 cases per location and presenting it using Power BI.
(On a side note, here’s more information on what is Power BI and how to install it)
Installing Power BI Desktop is free. One of the default visualizations is the Map visualization using Bing Maps. We don’t need coordinates for known locations like countries and US states. See this in the example below:
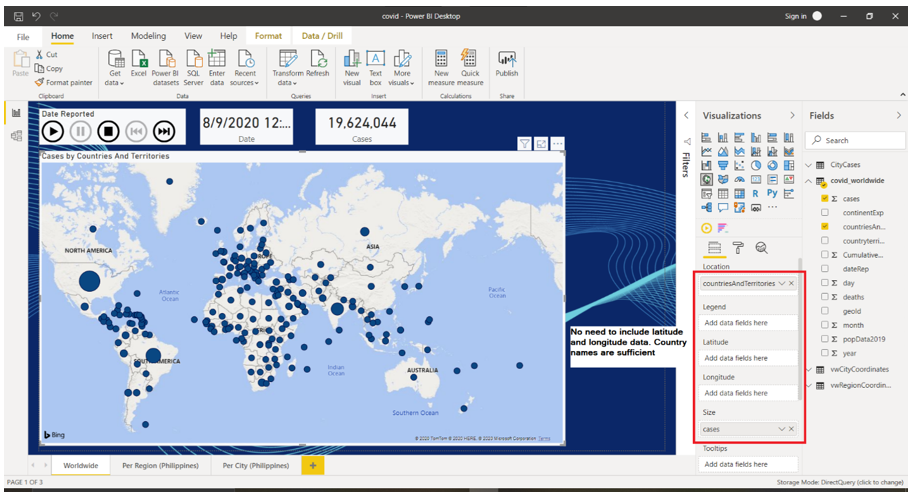
Note the red box in Figure 4. Latitude and longitude are left blank, but the bubbles are plotted on the map just fine.
However, in the next example, we will use regions and cities in the Philippines. Coordinates are a must to plot the bubbles correctly.
WHAT YOU NEED
Before we get into the meaty part of the report, here are the basic things we need:
- Power BI Desktop
- Map Visualization
- Tables and queries
- Sample data
PREPARING THE DATA
Preparing the Tables and Views
In the beginning, we need to set up the containers for our data. So, we require the following tables:
- Cities – a list of cities in the Philippines categorized by region.
- Regions – a list of areas in the Philippines
- CityCases – a list containing the number of cases for each city.
Below is the table structure:
CREATE TABLE [dbo].[Cities](
[CityID] [int] IDENTITY(1,1) NOT NULL,
[CityName] [varchar](50) NOT NULL,
[RegionID] [int] NOT NULL,
[GeoLocation] [geography] NULL,
 CONSTRAINT [PK_Cities] PRIMARY KEY CLUSTERED
(
[CityID] ASC
)WITH (PAD_INDEX = OFF, STATISTICS_NORECOMPUTE = OFF, IGNORE_DUP_KEY = OFF, ALLOW_ROW_LOCKS = ON, ALLOW_PAGE_LOCKS = ON, OPTIMIZE_FOR_SEQUENTIAL_KEY = OFF) ON [PRIMARY]
) ON [PRIMARY] TEXTIMAGE_ON [PRIMARY]
GO

CREATE TABLE [dbo].[Regions](
[RegionID] [int] IDENTITY(1,1) NOT NULL,
[Region] [varchar](50) NOT NULL,
[GeoLocation] [geography] NULL,
 CONSTRAINT [PK_Regions] PRIMARY KEY CLUSTERED
(
[RegionID] ASC
)WITH (PAD_INDEX = OFF, STATISTICS_NORECOMPUTE = OFF, IGNORE_DUP_KEY = OFF, ALLOW_ROW_LOCKS = ON, ALLOW_PAGE_LOCKS = ON, OPTIMIZE_FOR_SEQUENTIAL_KEY = OFF) ON [PRIMARY]
) ON [PRIMARY] TEXTIMAGE_ON [PRIMARY]
GO

CREATE TABLE [dbo].[CityCases](
[CityCaseID] [int] IDENTITY(1,1) NOT NULL,
[CityID] [int] NOT NULL,
[DateReported] [date] NOT NULL,
[TotalCases] [int] NOT NULL,
[TotalDeaths] [int] NOT NULL,
 CONSTRAINT [PK_CityCases] PRIMARY KEY CLUSTERED
(
[CityCaseID] ASC
)WITH (PAD_INDEX = OFF, STATISTICS_NORECOMPUTE = OFF, IGNORE_DUP_KEY = OFF, ALLOW_ROW_LOCKS = ON, ALLOW_PAGE_LOCKS = ON, OPTIMIZE_FOR_SEQUENTIAL_KEY = OFF) ON [PRIMARY]
) ON [PRIMARY]
GO
ALTER TABLE [dbo].[CityCases]  WITH CHECK ADD  CONSTRAINT [FK_CityCases_Cities] FOREIGN KEY([CityID])
REFERENCES [dbo].[Cities] ([CityID])
GO
ALTER TABLE [dbo].[CityCases] CHECK CONSTRAINT [FK_CityCases_Cities]
GO
Since geography data type is unknown to Power BI Map visualization, you need to create views. The purpose is to expose the latitude and longitude from those columns. We do this for the cities and regions – see below:
CREATE VIEW vwCityCoordinates
AS
SELECT
 CityID
,CityName
,GeoLocation.Lat AS Latitude
,Geolocation.Long AS Longitude
,RegionID
FROM Cities

CREATE VIEW vwRegionCoordinates
AS
SELECT
 RegionID
,Region
,GeoLocation.Lat AS Latitude
,GeoLocation.Long AS Longitude
FROM Regions
That’s it. Lat and Long are properties for latitude and longitude. It is now possible to use them in our Power BI report.
Building Up the Data
Up next, you need to build the data for our three tables.
Many thanks to the Philippines’ Department of Health for making the dataset available for the public. The file is in CSV format. The file naming convention is DOH COVID Data Drop_ yyyymmdd – 04 Case Information.CSV.
Here’s how to get the file to get a better hands-on with our example:
- Click the link to the data set.
- Select a month folder. August 2020 is in DOH COVID Data (08).
- Select a date. August 12, 2020, for example, is in DOH COVID Data Drop_20200812.
- Download DOH COVID Data Drop_ 20200812 – 04 Case Information.CSV. Repeat steps 2-4 to get the report for the other days.
Moreover, you need to import that data to SQL Server. Here’s how to do it:
- Open the CSV file in Excel.
- Add a column DateReported and populate all records with the corresponding date. In this case, 08/10/2020.
- Save it as an Excel file (.xlsx).
- Export the Excel file to SQL Server to a table called covid_ph.
Now that the data is ready in SQL Server, the next task is to run the following in SSMS query editor:
INSERT INTO CityCases
(CityID, DateReported, TotalCases, TotalDeaths)
SELECT DISTINCT
 c.CityID
,cp.DateReported
,(SELECT COUNT(*) FROM covid_ph cp1 WHERE cp1.CityMunRes = cp.CityMunRes AND
                               cp1.DateReported = cp.DateReported) AS TotalCases
,(SELECT COUNT(*) FROM covid_ph cp1 WHERE cp1.CityMunRes = cp.CityMunRes AND
                               cp1.DateReported = cp.DateReported AND
                               cp1.RemovalType='DIED') AS TotalDeaths
FROM covid_ph cp
INNER JOIN Cities c ON cp.CityMunRes = c.CityName
ORDER BY cp.DateReported
Meanwhile, there are no coordinates in the dataset we used. So, I have manually added the latitude and longitude of regions and cities from latlongdata.com.
Here’s the data for Regions:
INSERT INTO Regions
(Region, GeoLocation)
VALUES
('BARMM',geography::STGeomFromText('POINT(121.987 6.42964)', 4326)),
('CAR',geography::STGeomFromText('POINT(121.466 17.4737)', 4326)),
('CARAGA',geography::STGeomFromText('POINT(125.492 9.78604)', 4326)),
('NCR',geography::STGeomFromText('POINT(120.984 14.5995)', 4326)),
('Region I: Ilocos Region',geography::STGeomFromText('POINT(120.381 17.5553)', 4326)),
('Region II: Cagayan Valley',geography::STGeomFromText('POINT(121.811 16.9754)', 4326)),
('Region III: Central Luzon',geography::STGeomFromText('POINT(120.712 15.4828)', 4326)),
('Region IV-A: CALABARZON',geography::STGeomFromText('POINT(121.079 14.1008)', 4326)),
('Region IV-B: MIMAROPA',geography::STGeomFromText('POINT(118.736 9.84321)', 4326)),
('Region IX: Zamboanga Peninsula',geography::STGeomFromText('POINT(123.259 8.15408)', 4326)),
('Region V: Bicol Region',geography::STGeomFromText('POINT(123.414 13.421)', 4326)),
('Region VI: Western Visayas',geography::STGeomFromText('POINT(122.537 11.005)', 4326)),
('Region VII: Central Visayas',geography::STGeomFromText('POINT(124.064 9.81687)', 4326)),
('Region VIII: Eastern Visayas',geography::STGeomFromText('POINT(125.039 12.2446)', 4326)),
('Region X: Northern Mindanao',geography::STGeomFromText('POINT(124.686 8.02016)', 4326)),
('Region XI: Davao Region',geography::STGeomFromText('POINT(126.089 7.30416)', 4326)),
('Region XII: SOCCSKSARGEN',geography::STGeomFromText('POINT(124.686 6.27069)', 4326))
Here’s the data from a partial list of cities for Cities table:
INSERT INTO Cities
(CityName, RegionID, GeoLocation)
VALUES
('CALOOCAN CITY',4,geography::STGeomFromText('POINT(120.967 14.6488)', 4326)),
('CITY OF LAS PIÑAS',4,geography::STGeomFromText('POINT(120.999 14.4325)', 4326)),
('CITY OF MAKATI',4,geography::STGeomFromText('POINT(121.033 14.5502)', 4326)),
('CITY OF MALABON',4,geography::STGeomFromText('POINT(120.957 14.6633)', 4326)),
('CITY OF MANDALUYONG',4,geography::STGeomFromText('POINT(121.039 14.5771)', 4326)),
('CITY OF MANILA',4,geography::STGeomFromText('POINT(120.982 14.6077)', 4326)),
('CITY OF MARIKINA',4,geography::STGeomFromText('POINT(121.097 14.6409)', 4326)),
('CITY OF MUNTINLUPA',4,geography::STGeomFromText('POINT(121.05 14.4209)', 4326)),
('CITY OF NAVOTAS',4,geography::STGeomFromText('POINT(120.933 14.6775)', 4326)),
('CITY OF PARAÑAQUE',4,geography::STGeomFromText('POINT(121.017 14.4664)', 4326)),
('CITY OF PASIG',4,geography::STGeomFromText('POINT(121.061 14.5876)', 4326)),
('CITY OF SAN JUAN',4,geography::STGeomFromText('POINT(121.037 14.6001)', 4326)),
('CITY OF VALENZUELA',4,geography::STGeomFromText('POINT(120.967 14.6823)', 4326)),
('PASAY CITY',4,geography::STGeomFromText('POINT(121 14.5505)', 4326)),
('PATEROS',4,geography::STGeomFromText('POINT(121.071 14.5487)', 4326)),
('QUEZON CITY',4,geography::STGeomFromText('POINT(121.033 14.633)', 4326)),
('TAGUIG CITY',4,geography::STGeomFromText('POINT(121.062 14.5216)', 4326)),
('ALFONSO',8,geography::STGeomFromText('POINT(120.861 14.1214)', 4326)),
('AMADEO',8,geography::STGeomFromText('POINT(120.922 14.1693)', 4326)),
('BACOOR CITY',8,geography::STGeomFromText('POINT(120.974 14.413)', 4326)),
('CARMONA',8,geography::STGeomFromText('POINT(121.041 14.3108)', 4326)),
('CAVITE CITY',8,geography::STGeomFromText('POINT(120.897 14.4791)', 4326)),
('CITY OF DASMARIÑAS',8,geography::STGeomFromText('POINT(120.959 14.299)', 4326)),
('CITY OF GENERAL TRIAS',8,geography::STGeomFromText('POINT(120.907 14.3214)', 4326)),
('GEN. MARIANO ALVAREZ',8,geography::STGeomFromText('POINT(121.013 14.3051)', 4326)),
('GENERAL EMILIO AGUINALDO',8,geography::STGeomFromText('POINT(120.792 14.1931)', 4326)),
('IMUS CITY',8,geography::STGeomFromText('POINT(120.941 14.4064)', 4326)),
('INDANG',8,geography::STGeomFromText('POINT(120.873 14.192)', 4326)),
('KAWIT',8,geography::STGeomFromText('POINT(120.904 14.441)', 4326)),
('MAGALLANES',8,geography::STGeomFromText('POINT(120.746 14.1583)', 4326)),
('MARAGONDON',8,geography::STGeomFromText('POINT(120.735 14.253)', 4326)),
('MENDEZ (MENDEZ-NUÑEZ)',8,geography::STGeomFromText('POINT(120.902 14.1312)', 4326)),
('NAIC',8,geography::STGeomFromText('POINT(120.792 14.2965)', 4326)),
('NOVELETA',8,geography::STGeomFromText('POINT(120.88 14.4279)', 4326)),
('ROSARIO',8,geography::STGeomFromText('POINT(120.857 14.414)', 4326)),
('SILANG',8,geography::STGeomFromText('POINT(120.969 14.2142)', 4326)),
('TAGAYTAY CITY',8,geography::STGeomFromText('POINT(120.962 14.1153)', 4326)),
('TANZA',8,geography::STGeomFromText('POINT(120.85 14.3429)', 4326)),
('TERNATE',8,geography::STGeomFromText('POINT(120.678 14.2714)', 4326)),
('TRECE MARTIRES CITY (CAPITAL)',8,geography::STGeomFromText('POINT(120.868 14.2822)', 4326))
Now that the data is all set, we are ready to prepare the report.
PREPARING THE REPORT
Before we begin, we need two pages of reports. One page is for the data per region, and the other page is per city.
COVID-19 Report Per Region
Here are simple steps for creating the report per region:
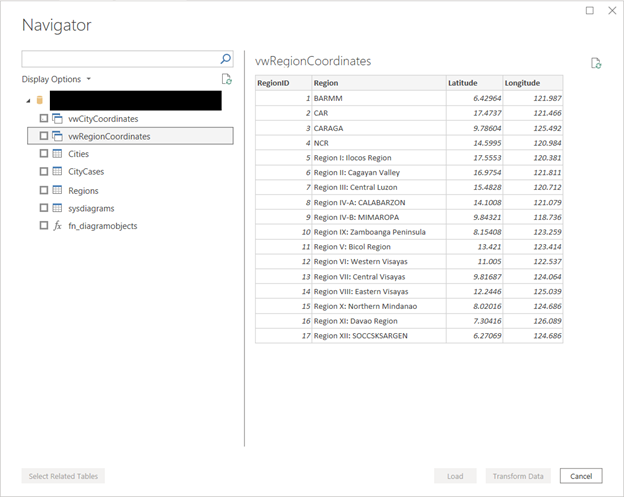
- Connect to SQL Server from Power BI. Indicate the server and the database.
- Choose the tables and views you need for the report.
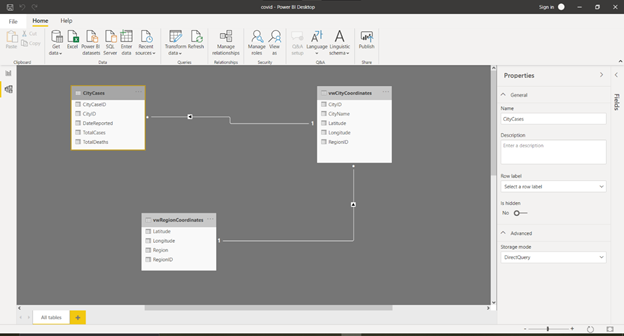
3. Define the relationships – see Figure 6 below. For more details in defining relationships in Power BI, visit this page.
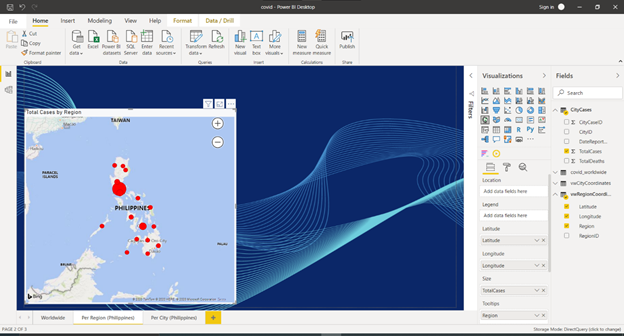
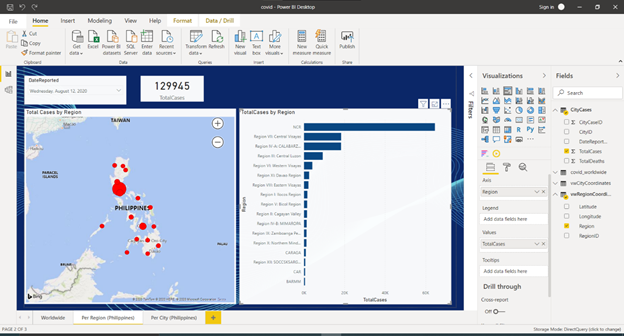
4. Click the Map visualization and fill up the properties. Bind the latitude and longitude properties from the vwRegionCoordinates. Then, the Tooltip from vwRegionCoordinates’s Region column. And finally, the Size from CityCases‘ TotalCases column. See Figure 7 below:
- Add a Slicer and bind it to DateReported from CityCases table.
- Insert a Card and bind it to TotalCases from CityCases table
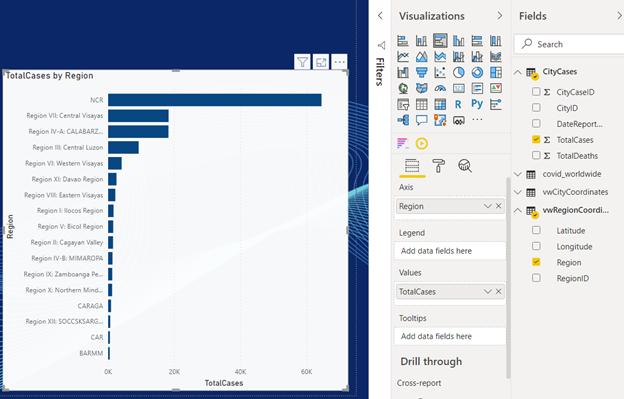
- Add a Clustered Bar Chart. Bind the Axis property to Region column from vwRegionCoordinates. Then, bind the Values to TotalCases column from CityCases. See Figure 8 below:
After the above steps, you will see the final look. It should be similar to Figure 9 below:
COVID-19 Report Per City
The first page is ready. Adding the next page for the report per city should not be hard.
Here are the steps:
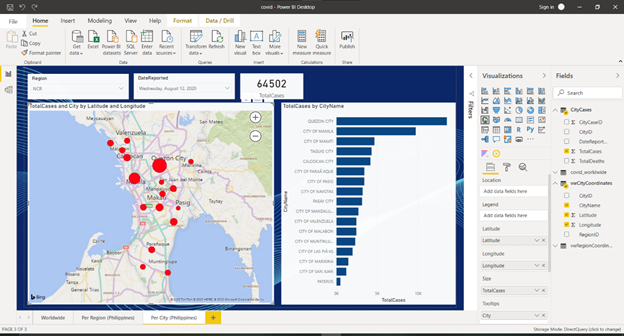
- Add a new page by clicking the + from the lower part of the window and rename it Per City (Philippines).
- Include a slicer and bind it to the region from vwRegionCoordinates.
- Insert another slicer and bind it to DateReported from CityCases.
- Add a Card and bind it to TotalCases from CityCases.
- Insert a Map visualization. You define the latitude and longitude properties from the vwCityCoordinates. The Tooltip is from vwCityCoordinates’s CityName column, and the size is from CityCases‘ TotalCases column.
- Add a Clustered Bar Chart and bind the Axis to CityName column from vwCityCoordinates and Values to TotalCases from CityCases.
The final look of the report per city should be similar to Figure 10 below:
Now, what’s the big deal in using maps for analysis compared to looking at bar or line charts?
First of all, it’s not just for aesthetics and impressing your audience with eye-catching reports. More importantly, it gives them a clearer understanding of the data relative to a location.
In our example, you can see where the pandemic problem is more widespread based on how big the bubbles are. Besides, we can see and compare in a glance the number of cases of different places relative to each other. This will also help government officials to make better decisions.
Our report sample is too simple, but it demonstrates how SQL Server geography data types can help you in geospatial analysis.
Conclusion
Have you made sense of what’s in it for you when using geography spatial data type?
- Spatial or geospatial data stands for the data on points located on the surface of the Earth.
- It can be used for the “nearest neighbor” query searching for the nearby cinemas, restaurants, clubs, etc.
- It is also handy for geospatial data analysis, like the report we created in Power BI.
- The fundamental elements in creating a geography instance are stuff like well-known text (WKT), spatial reference identifier (SRID), and the method STGeomFromText.
In this post, we touched just a portion of what spatial data in SQL Server can do for you. You may not use them all at once, but the most common use cases are here to get you started. Why not explore more from the references from Microsoft below?
If you like this post, please share it with your favorite social media platforms.
Tags: database administration, sql server Last modified: September 20, 2021


… [Trackback]
[…] Read More here: test-coding.devart.com/how-to-make-sense-of-sql-server-geography-data-type/ […]