Contents:
- Introduction
- Importing data from Excel, SQL Server, and the Web.
- Data Manipulation Basics in Power BI.
- Managing relationships within Power BI.
- Conclusions.
Introduction
This article will cover off importing data, manipulating data, and finally managing relationships within Power BI. Again, like the previous article, this one will focus on the basic principles of using Power BI, as opposed to an in-depth walkthrough.
Importing data from Excel, SQL Server, and the Web
Importing data from Excel into Power BI
When starting out, Excel should be the first data source you look to when it comes to importing data. The main reasons for this being: Ease of Use, Transparency, and General Availability.
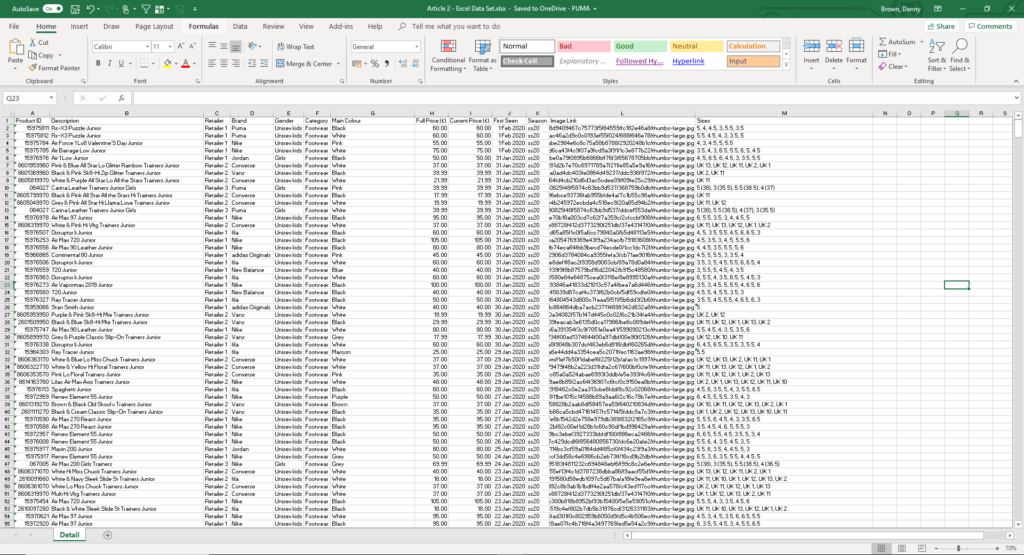
Step 1 – Excel Data Set
This is the data set we’re going to import into Power BI, it contains footwear pricing from a range of retailers. Ensure your data has some key measures which we can later analyze – the data below includes dates, pricing, and counts.
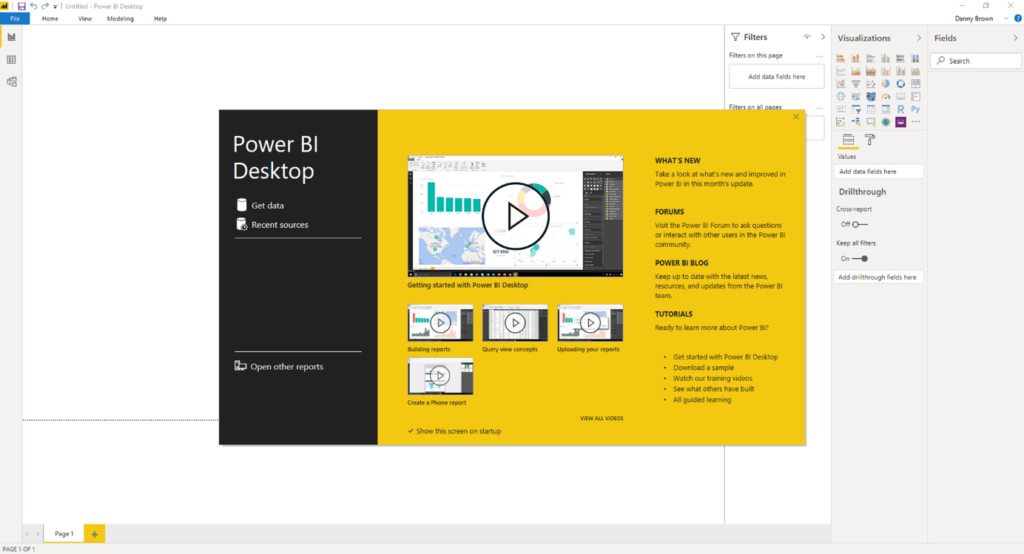
Step 2 – Open Power BI
Open Power BI from the windows menu, the below box will appear where you can then navigate either to your recent sources or open shared files. To simply import data, click the ‘Get Data’ option.

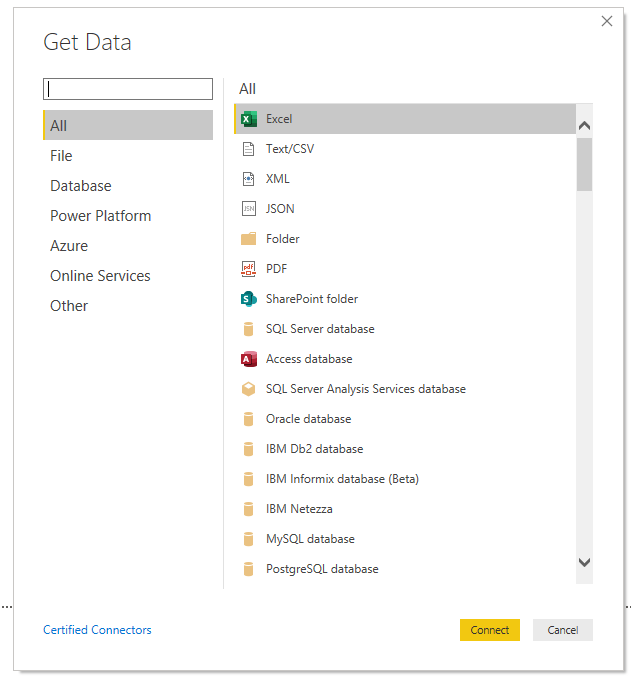
Step 3 – Select Excel
Once clicked through, a series of options will be displayed in how we can import data into Power BI. To begin, click the ‘Excel’ option highlighted below.
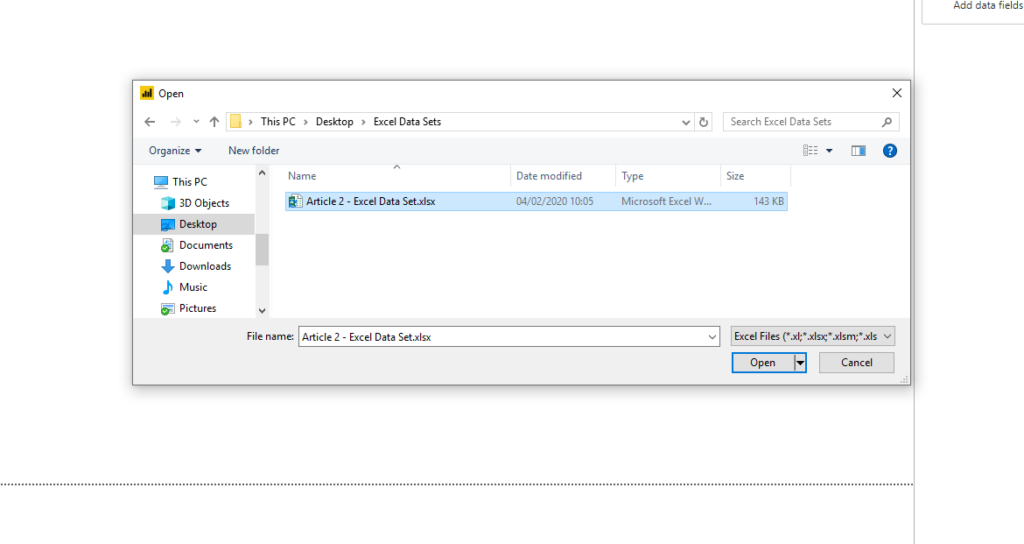
Step 4 – Locate Data Set
Locate the Excel file to upload and click ‘Open’.
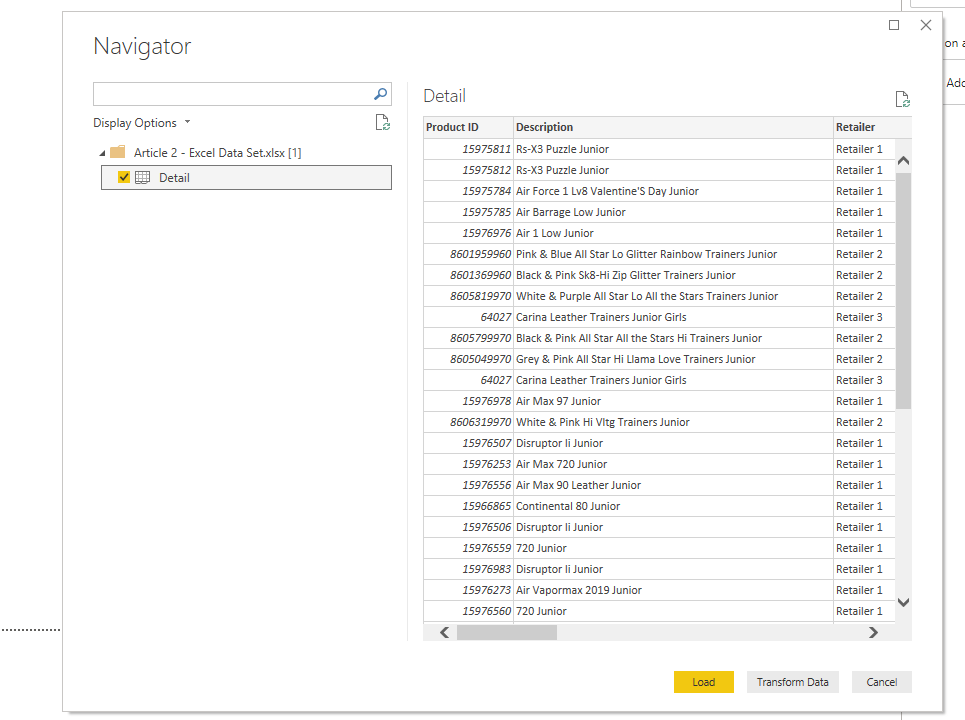
Step 5 – Navigator Screen
Once the Excel file has been imported, the Navigator will be displayed (please wait a few seconds depending on Excel file size). Then click into the checkbox located next to the name of the Excel sheet, this will then create a preview in the right-hand side screen.

Step 6 – Load Data
We then have the choice to either ‘Load’ the data or ‘Transform’ the data. Loading the data will import the data straight into the Power BI interface whilst transforming will allow you to begin editing and manipulating your data. For now, lets ‘Load’ the data, and we’ll head back to the ‘Transform’ stage later in the article.
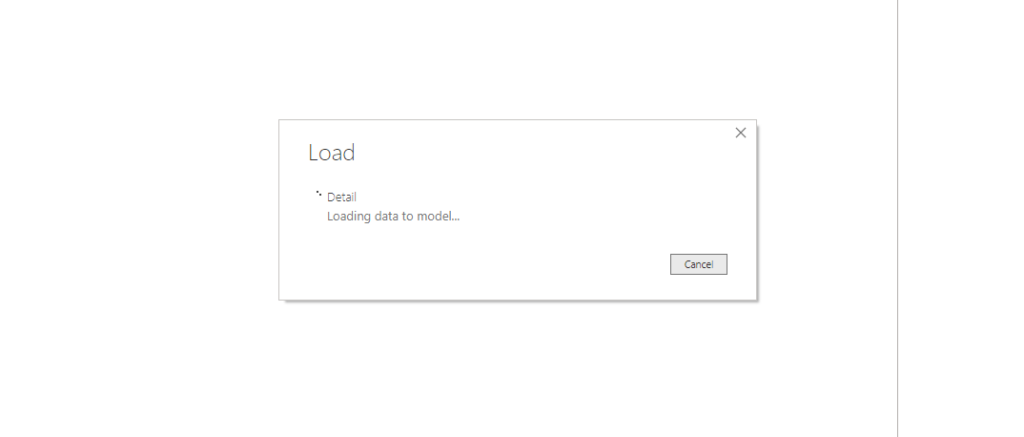
Step 7 – Data Loading
A loading screen will now pop up, again, the loading time will vary, depending on your data set size. Once complete, the loading box will automatically disappear.
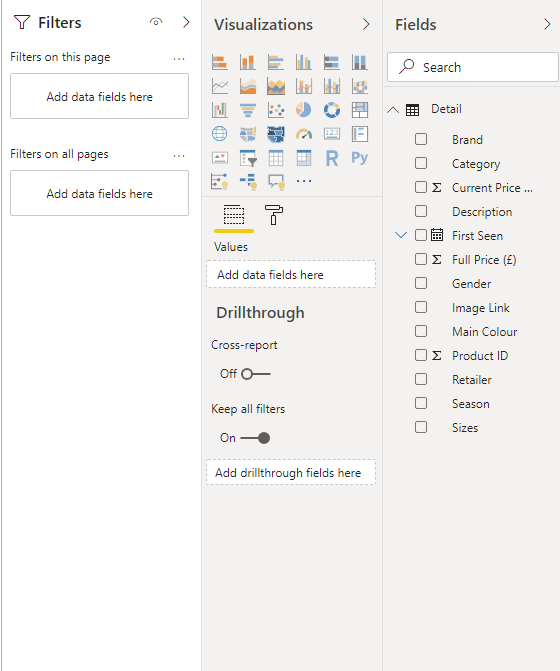
Step 8 – Data Loaded.
The Excel sheet has now been successfully loaded into Power BI. The detail sheet has been automatically categorized based on the first line of data in the Excel (Titles). As you can see, some of the information has already been formatted based on existing formats, Text, Number, and Dates.
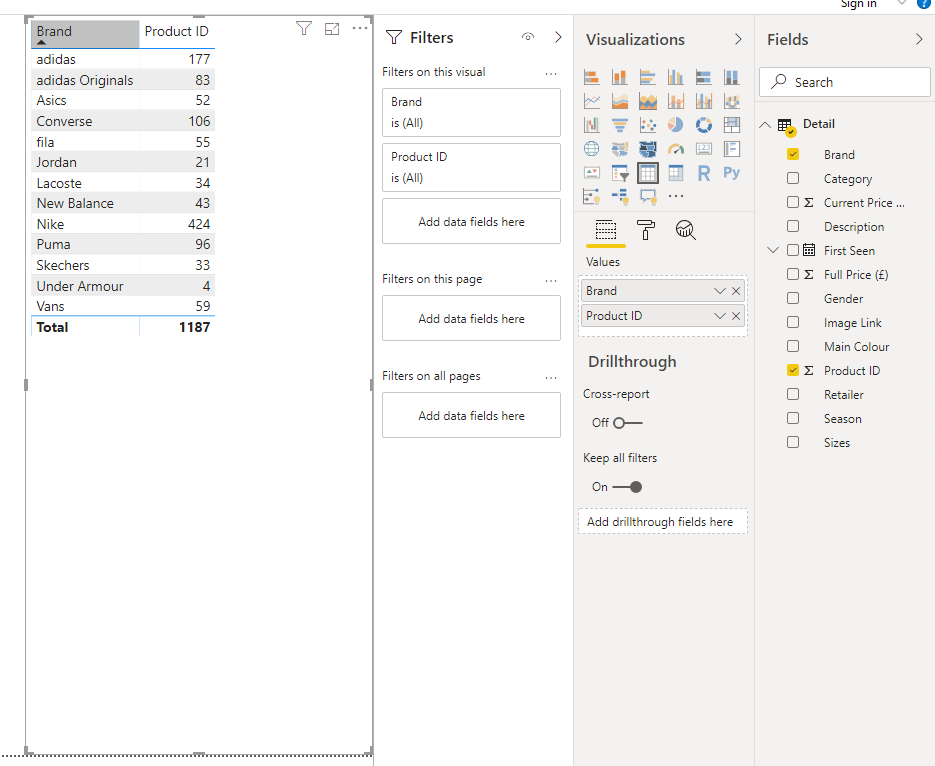
Step 9 – Quick Data Check
To quickly verify that your data was imported, we can create a quick ‘Table’ by clicking on the icon highlighted below. Followed by clicking into the checkboxes against your data, this will populate the values. For example, I’ve checked ‘Brand’ and ‘Product ID’ – this has then displayed the count of products each brand has within the data set.
Importing websites into Power BI
Websites can be directly loaded into Power BI through the Web import function. Before you begin to locate the website or website page you want to load data from, it’s important to note that this form of importing data depends on how well the Power BI app can extract data from the given website since some websites are harder than others to import.
Step 1 – Open Power BI
Again, open Power BI and head over to the ‘Get Data’ option.

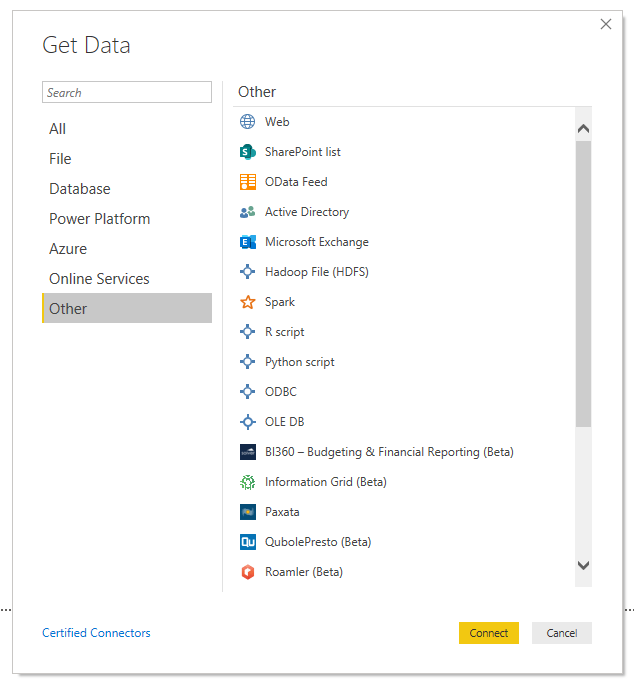
Step 2 – Select Web
Click into ‘Other’ data sources, you will then see ‘Web’ displayed at the top. Click into the ‘Web’ option.
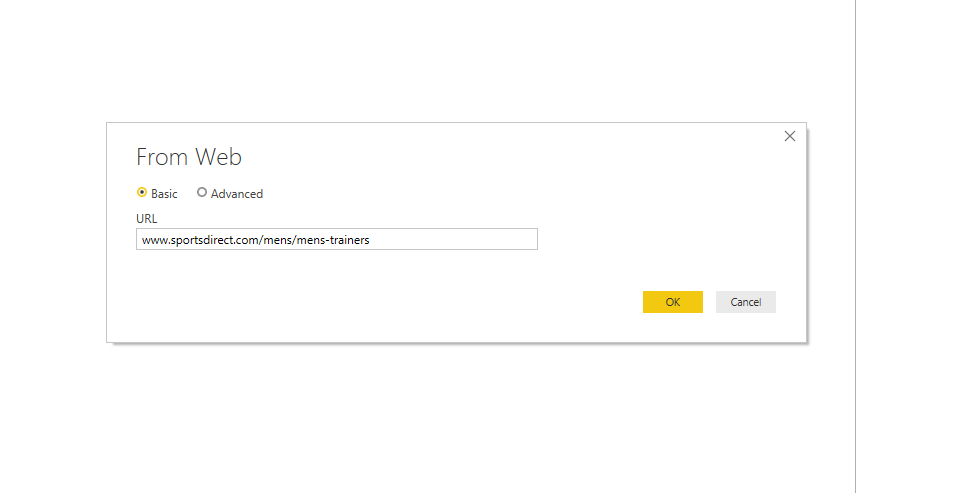
Step 3 – Enter Website URL
The example used is www.sportsdirect.com/mens/mens-trainers. Copy and paste this into the URL box and click ‘OK’:

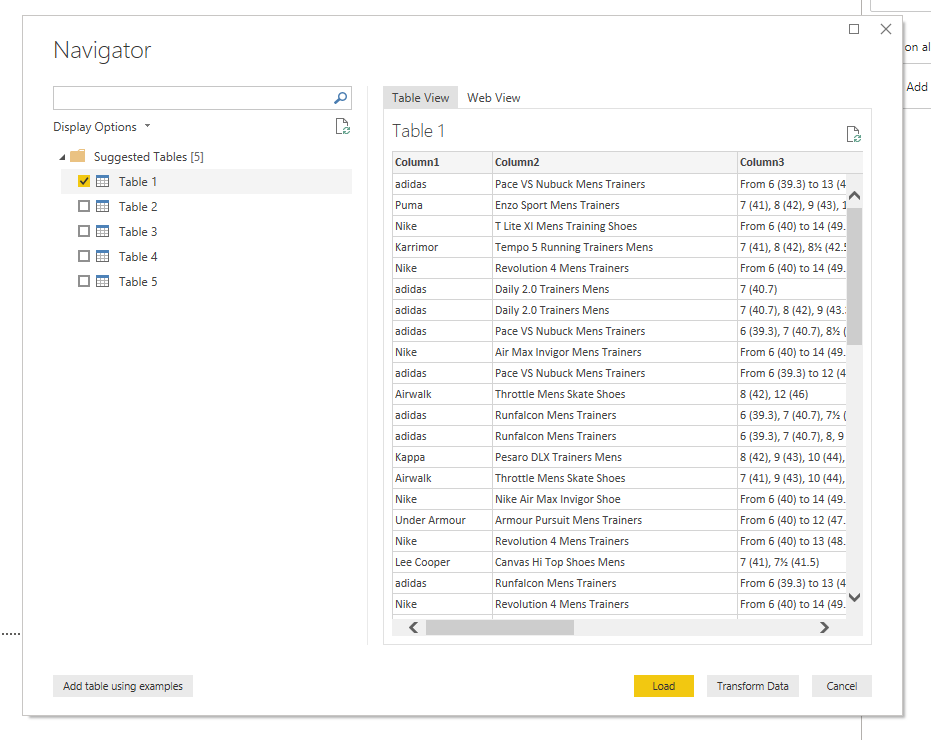
Step 5 – Web Navigator
The Navigator will now appear, Power BI will categorize the data extract into several tables as best possible depending on the website. The website we’ve imported has done successfully: in the ‘Table View’, we can now see all the data imported under the column headers. This data can now be loaded in the same manner as Excel at the basic level.
Importing data from SQL Server Database into Power BI
Due to the vast amount of data now being managed, more and more organizations are turning to Big Data processing and storage options. One of these being the SQL Database, which reduces the front-end processing time by managing the workload for you. The below will show you how to connect to your SQL Database. For more details, see this article on connecting Power BI and SQL Server.
Step 1 – Open Power BI
Again, open Power BI and head over to the ‘Get Data’ option.
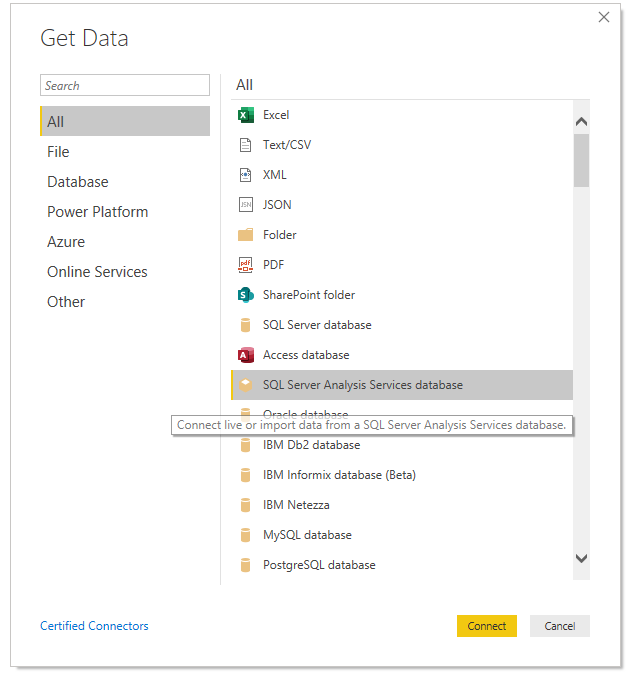
Step 2 – Select the relevant SQL Server
The SQL database we’re currently running is that of the analysis service (Microsoft), but don’t worry if your database differs from this as the technique for importing all databases is consistent.
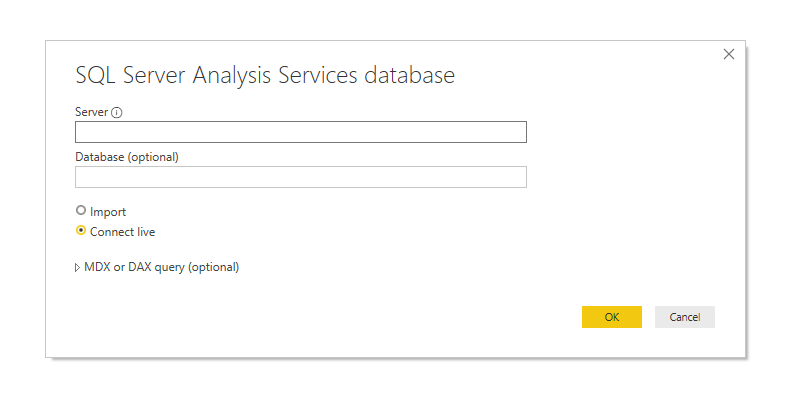
Step 3 – Connect to the database
Enter the Server you wish to connect to and the specific database if required, you then have the option to import or connect live. In order to directly link to the server, check ‘connect live’ and then click ‘OK’.
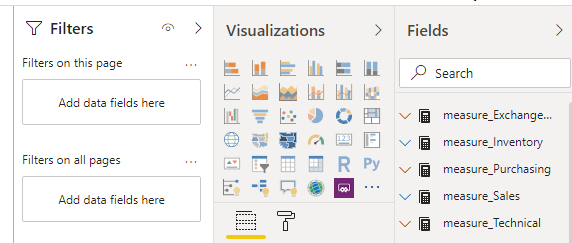
Step 4 – Database Loaded
You will now have successfully linked/imported the database into Power BI. Under the fields section, each of your options will be displayed as they appear in your SQL Database.
Data Manipulation Basics in Power BI
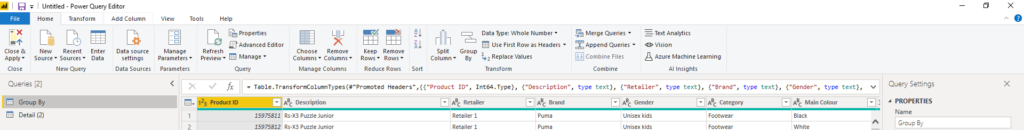
Manipulating data within Power BI gives the user the ability to cleanse, standardize, and expand their existing dataset. We’ll cover the basics of grouping, splitting, duplicating, and combing data. But just before we begin, we need to head back to Step 5 in the Excel Import Guide and hit transform. This will then take you into the Power Query Editor (also accessible under the Home Tab (Edit Query).
Group By option
Grouping data allows you to summarise rows in your existing data, somewhat like what a Pivot Table does in excel. In the home tab, click on the ‘Group By’ button.
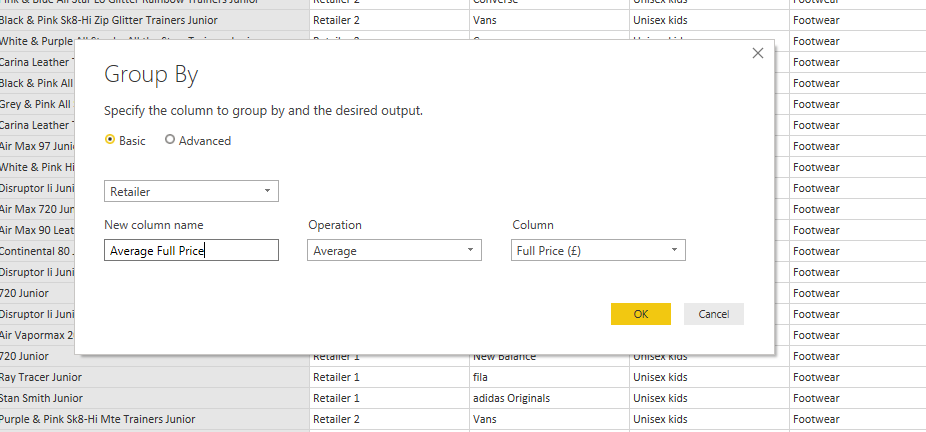
Step 1 – Click then ‘Group By’ option.
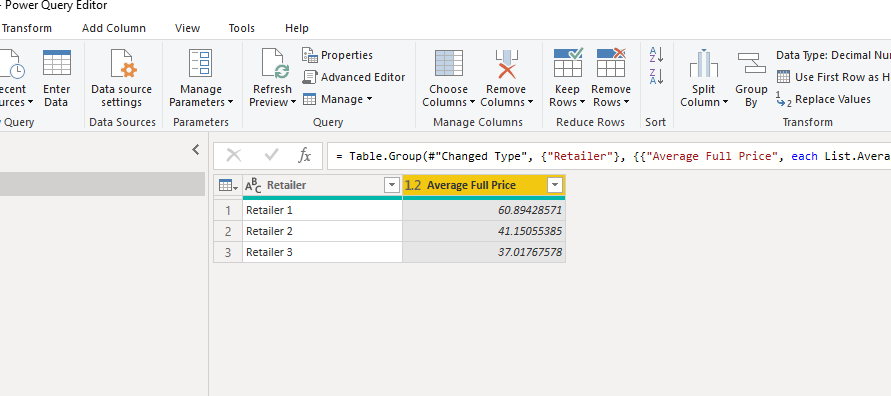
Step 2 – We want to see the average Full Price of each retailer, so let’s select ‘Retailer’ as the column to group by. Average Full Price will be the name of the new column, Average is the measure we require on the column, which is full price. Click ‘OK’.
Step 3 – Data Grouped
The data has now been grouped by retailer displaying the average full price. You can close it now and apply it in the home tab. This would overwrite your initial data set.
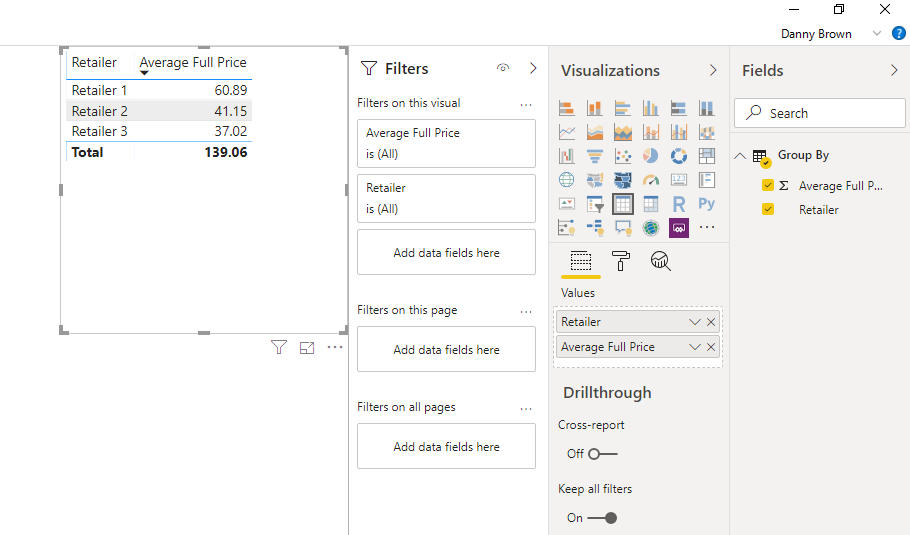
Step 4 – New Data Set
Applying what we learnt early, I’ve recreated the table using our new data.
Splitting columns
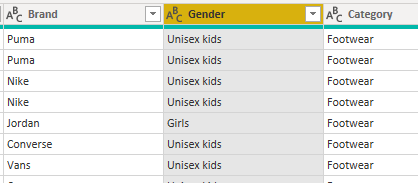
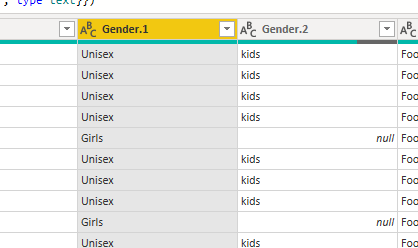
Splitting data is a more commonly used manipulation technique. In our current dataset, we have a column called ‘Gender’, but we only need to know whether it is Boys, Girls, or Unisex. Opposed to having Kids as the trailing word.
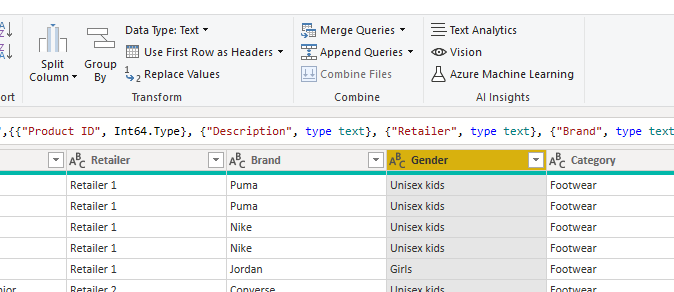
Step 1 – First select the column you want to split.
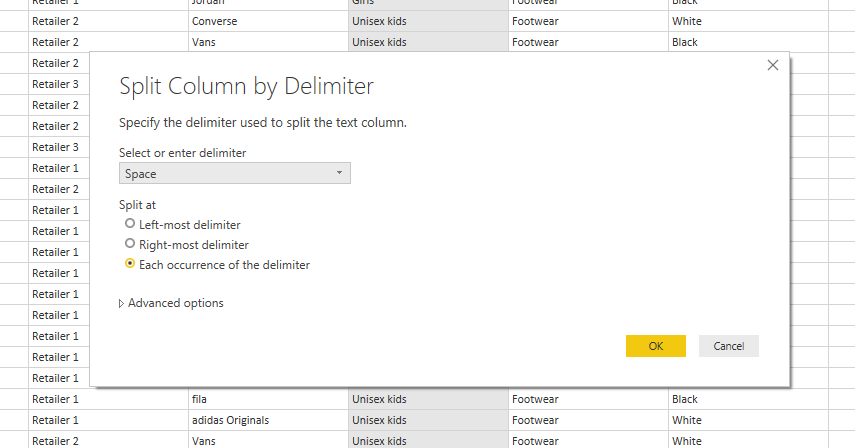
Step 2 – Select the Split Column Function – By Delimiter
Step 2 – Split by Criteria
From the drop-down menu, we can select ‘Blank’ which will allow removing any words following the first word. Click ‘OK’ when done.
Step 2 – Column has now been split.
Duplicating columns
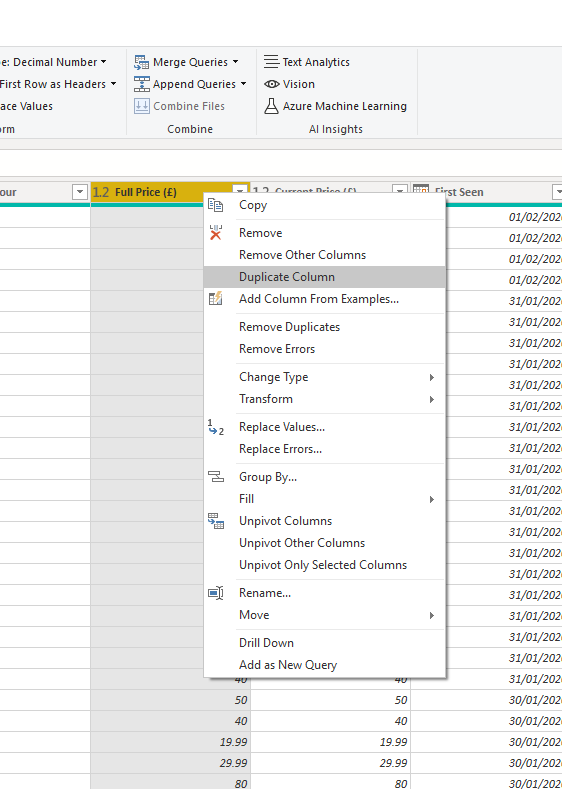
The main reason for duplicating columns is that you want to keep the original from your dataset whilst editing the duplicate. The example we will use is that of duplicating the ‘Full Price’ column so we can then round up our duplicated column to the nearest pound.
Step 1 – Right-click the column you want to duplicate, then click Duplicate.
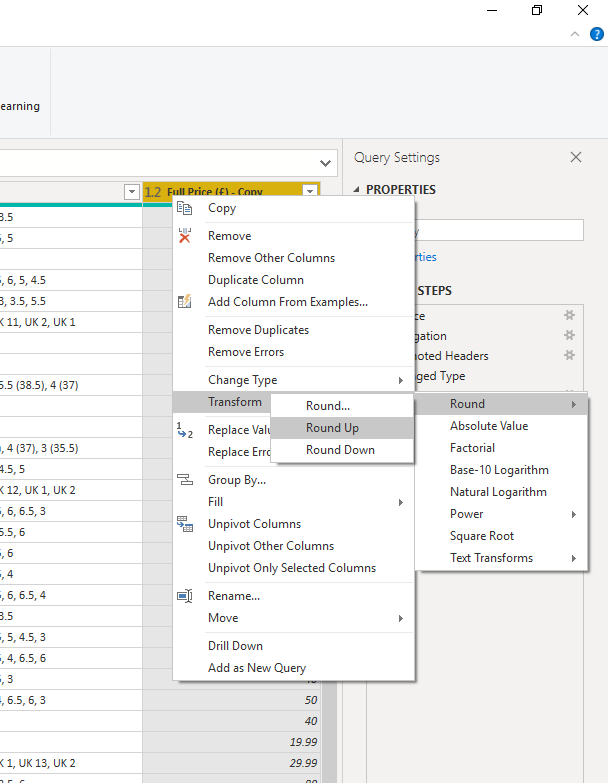
Step 2 – The column has now been duplicated and we can round the duplicated prices.
Combining columns
Combing columns is a great way of collating and filtering your data, in this example, we’re going to add the ‘Brand’ to the ‘Season’. This will then give us a one-click filter to dive deep into each brand’s range for the specific season.
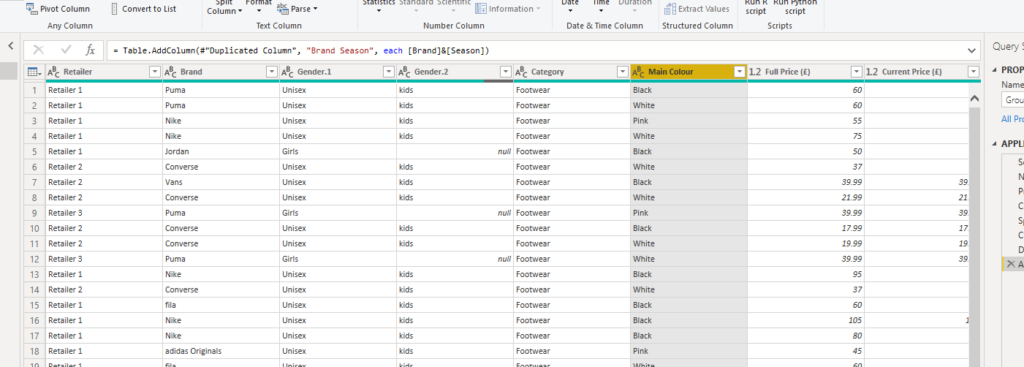
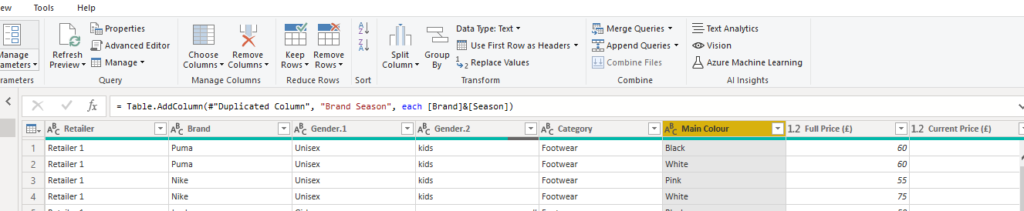
Step 1 – Add a Custom Column
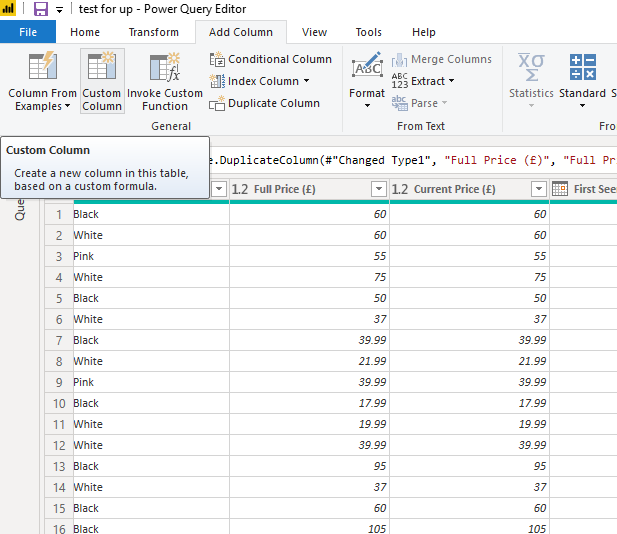
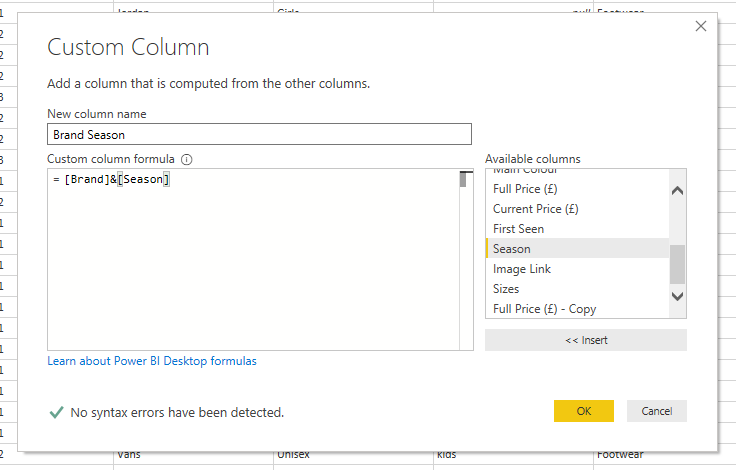
Step 2 – In the Custom Column window, give the new column a name ‘Brand Season’, then in the right-hand scroll box, locate the two columns you want to join, whilst placing a ‘&’ in-between to complete the combine. Click ‘OK’ to confirm.
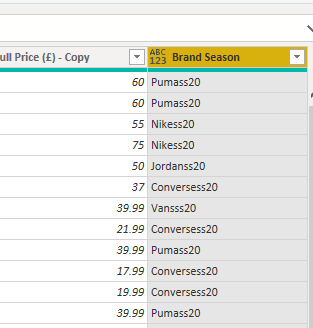
Step 3 – The combine column has now been created to which we can filter on ‘Brand Season’.
Managing relationships within Power BI
Power BI enables data sets to communicate with one another through several methods; the most frequently used are that of Merging, Linking, and Hierarchies.
Merging/Joining datasets
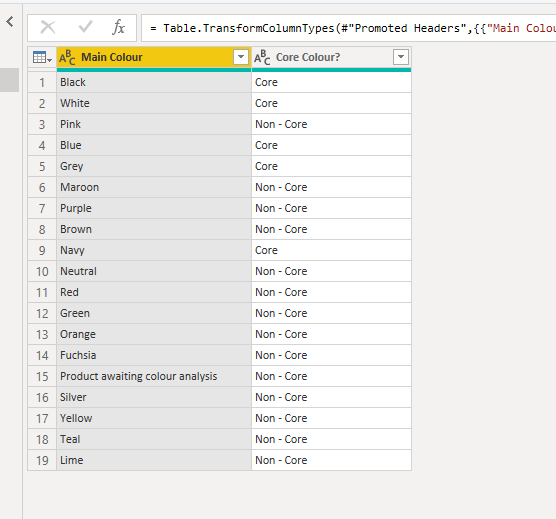
We need two or more data sets in order to create a merge, besides, to merge two datasets we need the same column to exist in both data sets. For this example, we’re going to classify the Colour column into Core and Non-Core colours.
Step 1 – Create a new excel using the techniques outlined above and import it into Power BI.
Step 2 – Click back into the original table that we created and locate the column we need to merge against.
Step 3 – Go ahead and click the Merge Queries option.
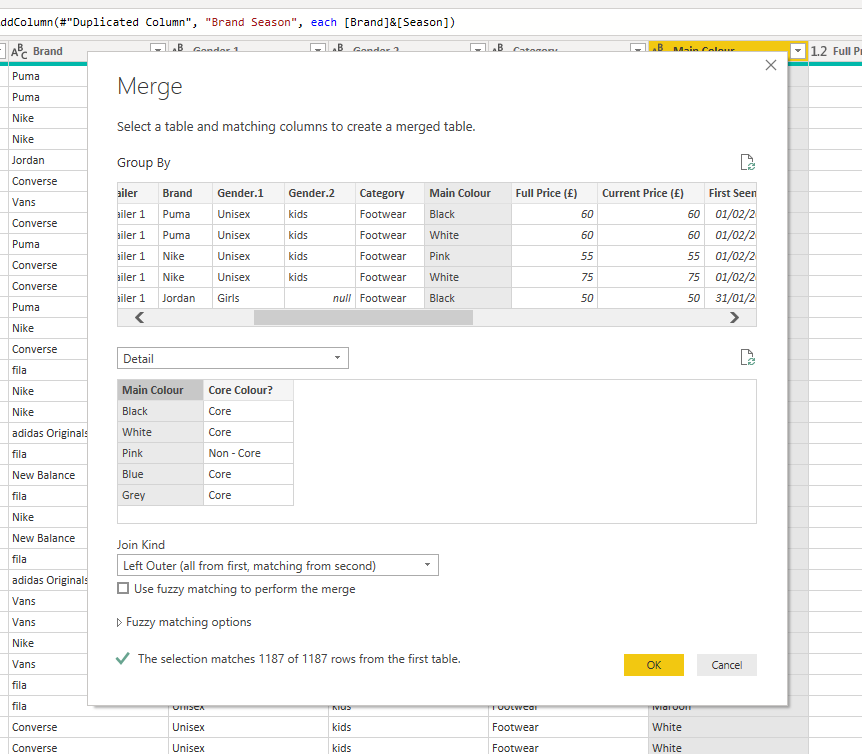
Step 4 – Merge Window
Scrolling along with the top window, select the column we wish to merge to; in the 1st drop-down box, locate the new table and then find the corresponding column (Main Colour/Main Colour). In the bottom left-hand corner, we see a green tick, which means Power BI has successfully matched up all the rows. Go ahead and click ‘OK’:
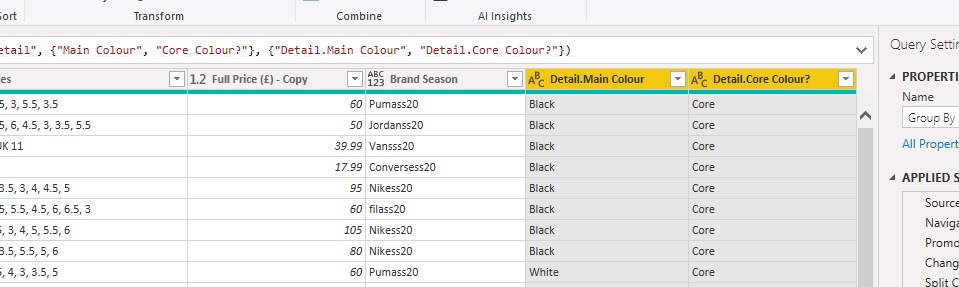
Step 5 – The table has now been merged, click the outwards arrow and then hit ‘OK’ to expand the detail:
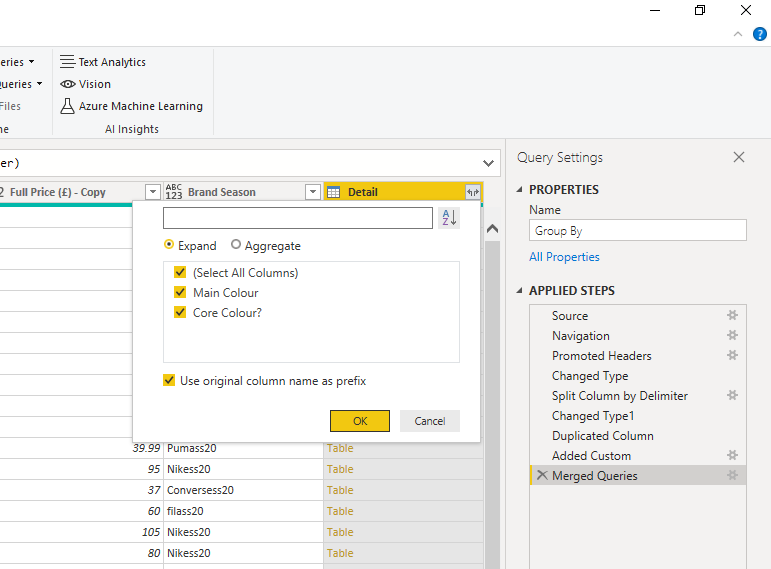
Step 6 – The tables have successfully been merged.
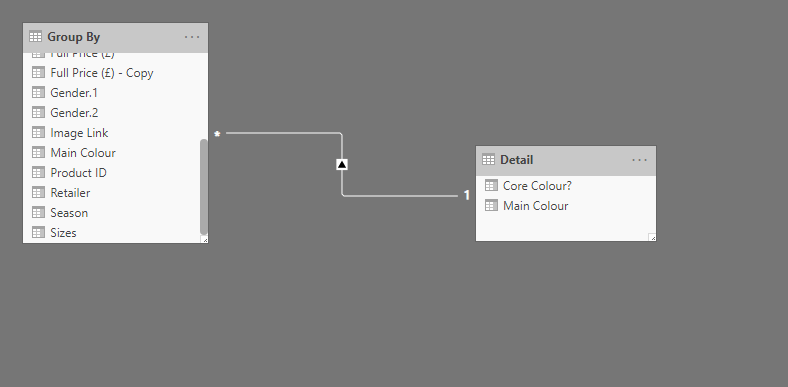
Model views/Relationship link
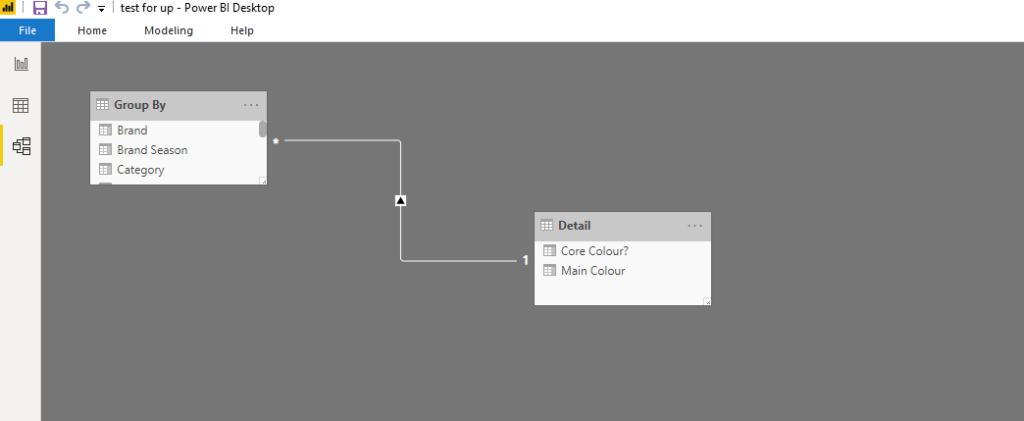
The model view allows us to view all our datasets in one place and highlights any relationships between them; currently, you should be able to see a solid white line link between your two data tables.
Step 1 – Link Between Tables
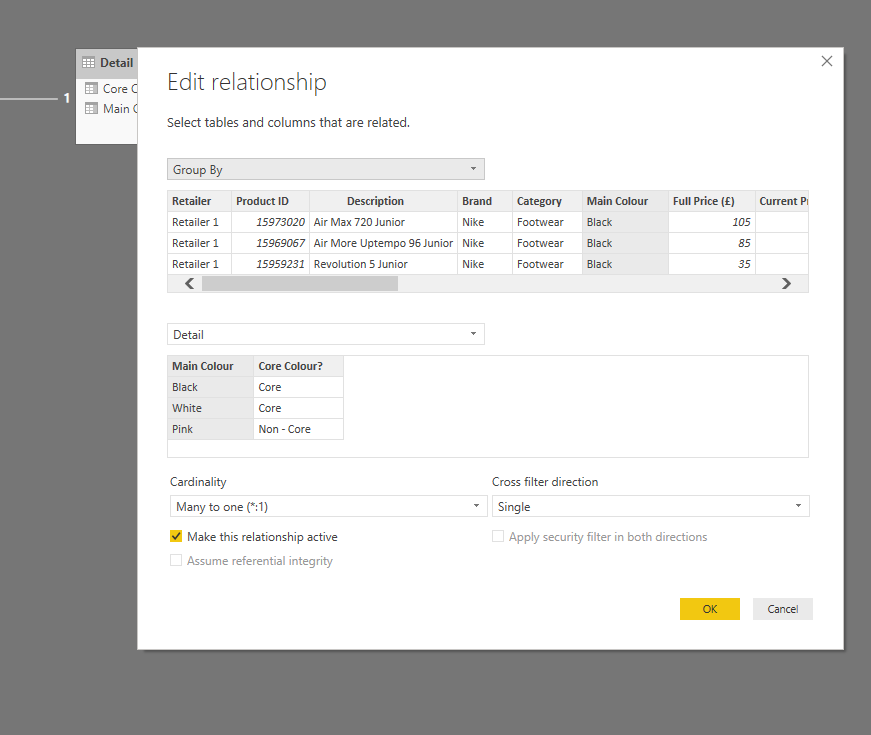
Step 2 – Double Click the link to highlight the connection made.
Step 3 – Opposed to merging, we do have the ability to match up columns in the model view by dragging and dropping as well.
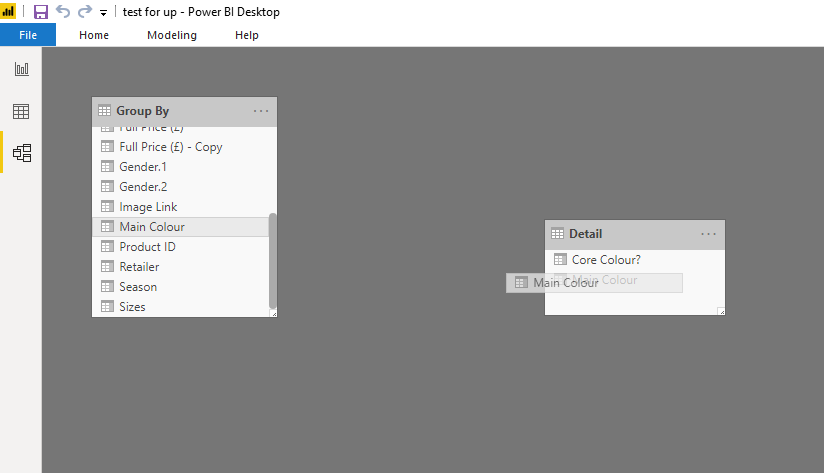
Step 4 – Relationship Made.
Hierarchies
Creating a hierarchy allows you to stack data together for easier overviews, especially when using drill down in visuals later in your journey.
Step 1 – Drag and Drop one field over another. Here we’re going to add the Description to the Product ID.
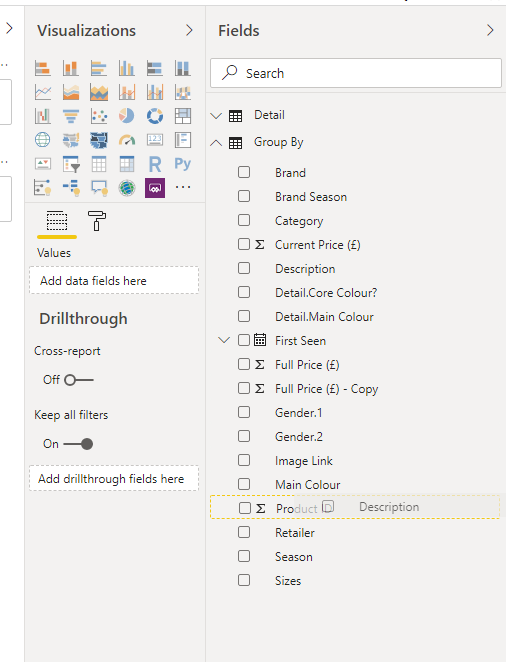
Step 2 – The hierarchy has now been created.
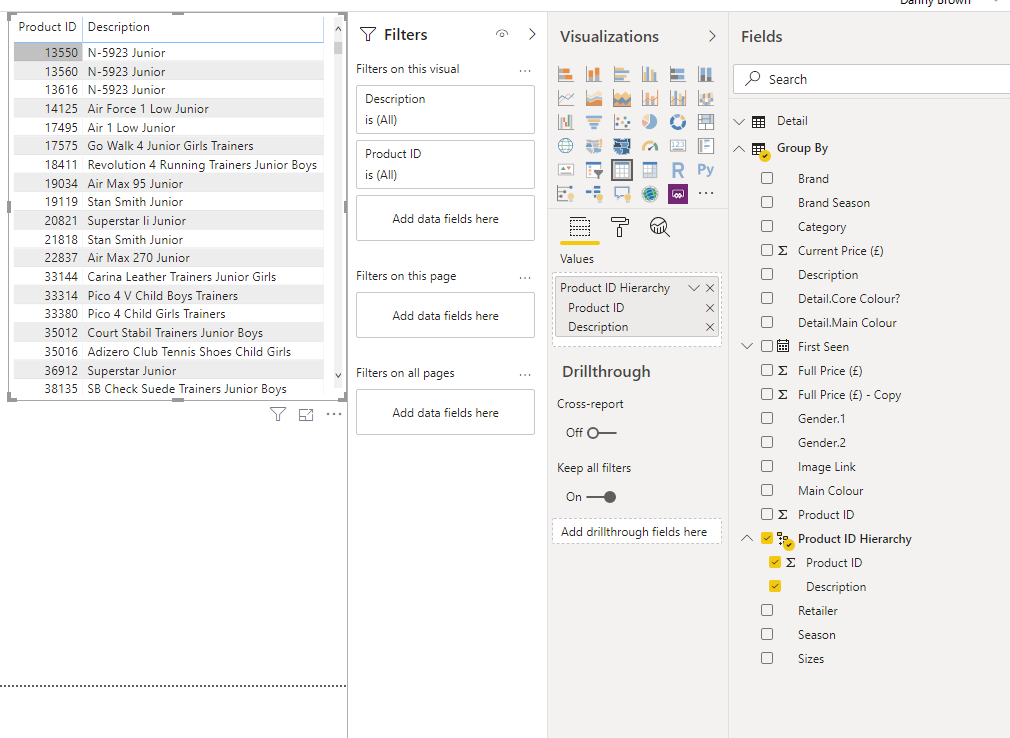
Check that the Product ID Hierarchy will now pull both fields through together when creating visuals.
Conclusions
To sum up, this time we have looked at Microsoft Power BI from different angles, starting from data import and moving on to data manipulation and managing relationships within this platform. We have outlined the main advantages this service can boast and shown the stepwise guides you can apply when it comes to performing the above-mentioned actions with Microsoft Power BI. The next article will move us onto Power BI’s visualizations, which give Power BI the edge over most analysis tools on the market today.
Tags: excel, excel power query, microsoft office, power bi, sql Last modified: September 20, 2021