This article will help you get to grips with the basics of Power BI and what it has to offer as an analytics tool. Along the way, we’ll cover the following: what Power BI is; why we need Power BI; Excel Vs Power BI; and, finally, installing Power BI.
What is Microsoft Office Power BI?
Power BI is a cloud-based analytics service that allows individuals and organizations to edit and visualize big data sets very easily. Power BI enables creating and publishing reports and dashboards that provide key insights through the use of interactive visuals.
Why you need Power BI
Data is now the most valuable resource in the world, and we need to take this into account. Most individuals and organizations are out there using the same outdated analysis tools they have always used as they don’t have the training or the resources to adapt. Power BI has been designed with ease of use in mind. With a little training and dedication, the ordinary admin or the Excel user can begin creating professional data sets and analytical reports, which will aid their business and everyday needs. Many people see Power BI as the natural extension of Excel Power Query and Power Pivot as it picks up where Excel begins to experience difficulties.
Power BI vs Excel
The initial misconception is that Power BI is here to replace Excel, which is far from the truth, though. Power BI can be used alongside Excel when analyzing data. But don’t get me wrong, Power BI has some key features that Excel simply cannot beat such as:
Visualizations
Excel is a very plain platform regarding analysis: hard numerical data is analyzed through pivot tables, basic charts, and user-generated logic. Microsoft has evolved these charts and graphs through Power BI and moved into ‘Visualizations’ — this gives Power BI the capacity to take numerical data and transform it into a graphical representation using visuals such as Geographical Mapping, URL Images, Matrix’s, Row Cards, and much more. These visuals are constantly updated in the Power BI Marketplace, which can be accessed through the Power BI Desktop App. The main feature of the visuals is the way they are used to empower analysis, such as their filtering capability. As for Excel, it still relies on generic filters and slicers. The key benefit is that users can quickly navigate around datasets, observe, and analyze the relationship between the variables, which wasn’t possible previously. (See Figure 1 to see Power BI’s filtering in action).
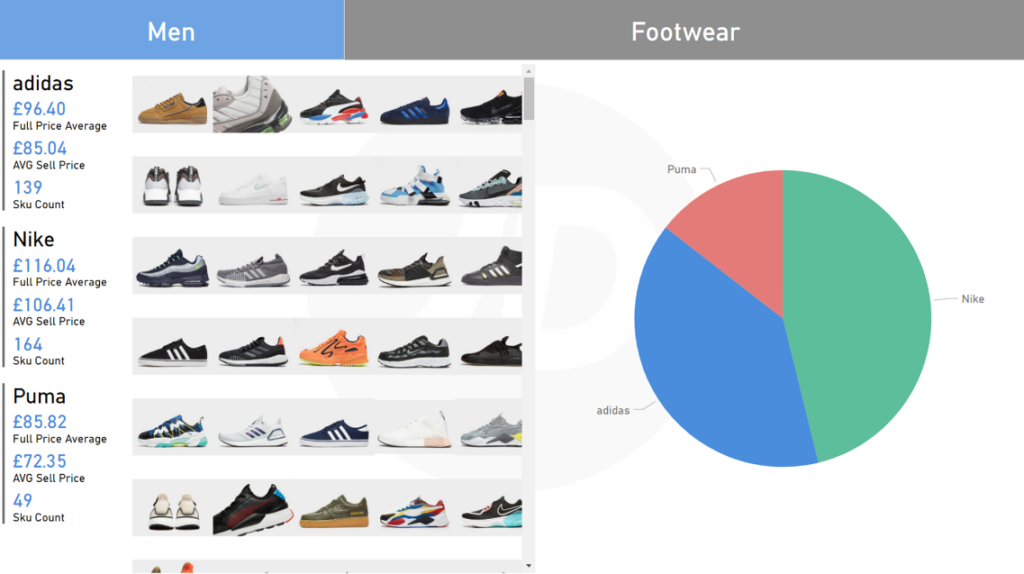
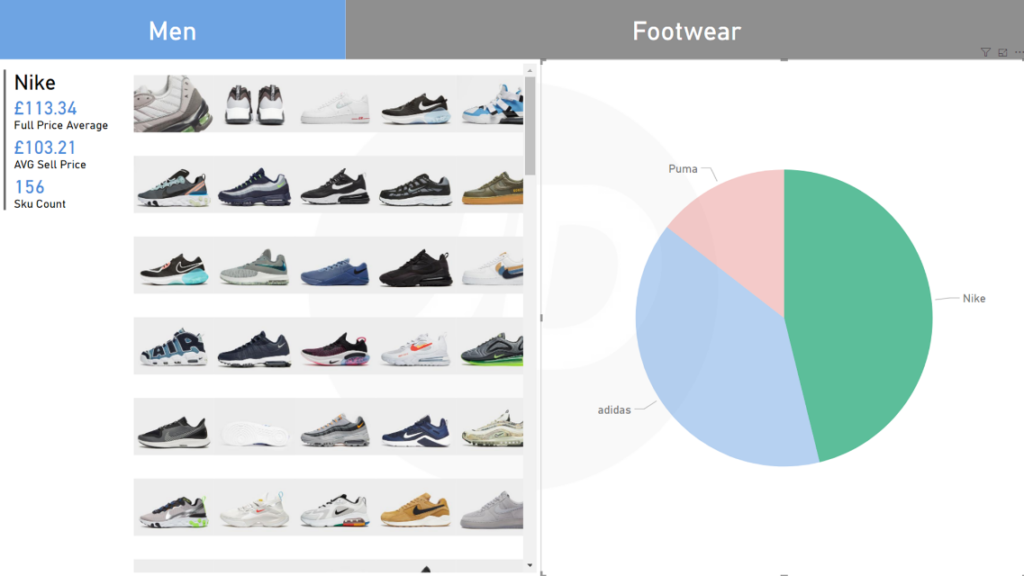
Fig.1. Puma, Nike, and Adidas Pie Chart before and after element click
Accessing, storing, and processing data
Power BI has been designed from the ground up to collate vast amounts of compressed data from an array of data sets, not only does it have the power to collate, but also manipulate, edit, and publish data — something Excel processing powers can only dream of even with the help of Power Query. Gone are the days of your “Excel has stopped working!”
Fig.2. Excel has stopped working
Cloud-based
Excel is generally used as a standalone program, and Power BI is something bigger, it’s part of Microsoft service. A service that automates, shares, and informs. Automation is implemented through scheduled refreshes set by the users, reports, and dashboards uploaded to Microsoft’s cloud and shared automatically (no more attachments!), informing key stakeholders when new reports are live through a live subscription model. Operating in the cloud provides a dynamic working and sharing environment as opposed to Excel’s static offline base.
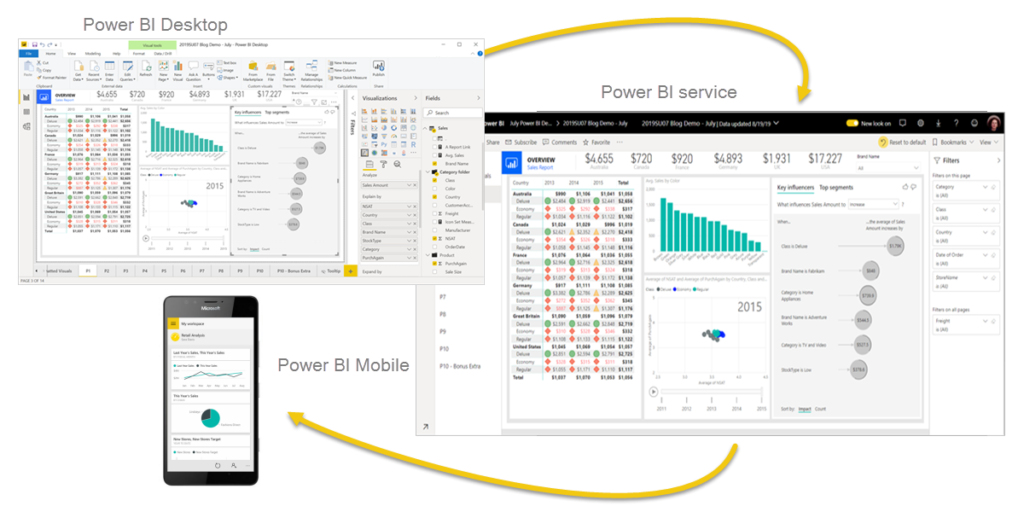
Fig.3. Power BI Service
Which Should I Use When?
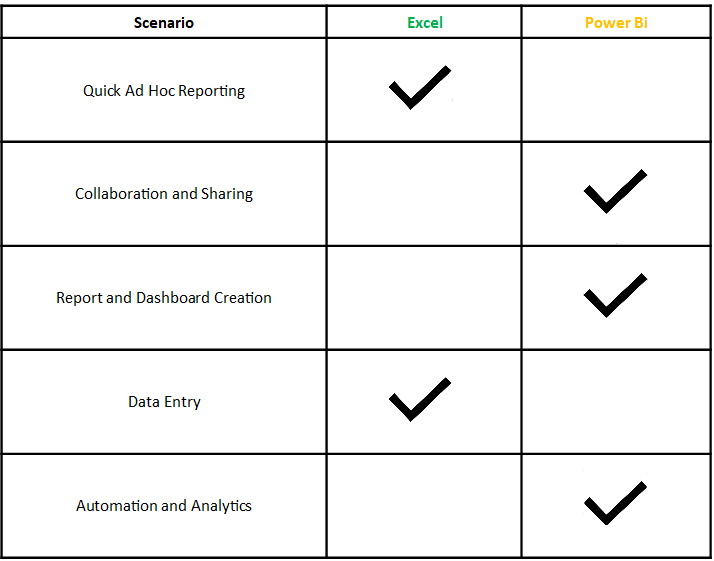
These are some of the main differences between the two platforms. However, Power BI is not without limitations as mentioned above. It can be used in conjunction with Excel. Power BI is reliant on other sources for data: data entry in Power BI is possible but not advisable. Excel is used worldwide to record and input data, therefore, most beginners will be using Excel as a starting point when stepping into the world of Power BI. (This point will be covered in a later article).
Installing Power BI
Power BI Desktop is free for the individual user; it easily covers all the basic features you need when starting, such as editing data, creating visuals, and publishing reports. There are, however, two priced subscription versions: Pro ($9.99 Per Month) and Premium ($4,995), which are targeted at larger organizations that require collaboration, storage resources, data analytics, sharing capabilities, and more. Now that we understand what Power BI is and know its price, let’s get into the installation guide.
Step 1
The Power BI installation is straight forward like most Microsoft Office Programs; even so, Power BI does have a few other platforms, such as a mobile app for viewing your reports and dashboard. For now, let’s stick with the Microsoft Power BI Desktop Installation. To start your download, please follow the link below and click on the Download button.
Click here to download
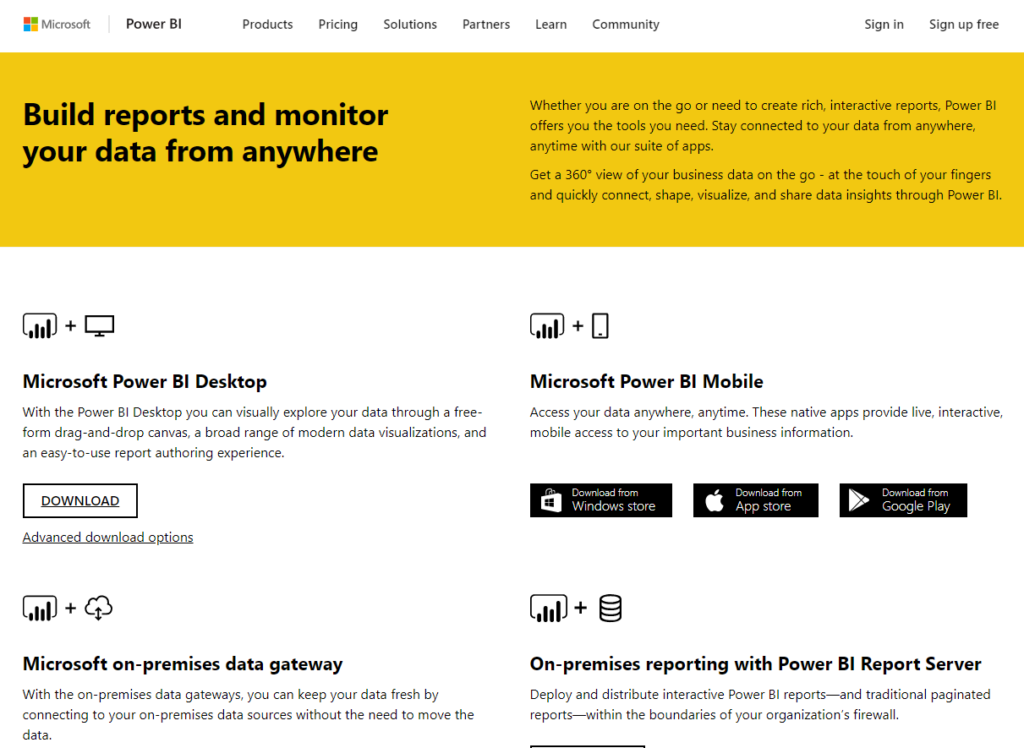
Figure 4. Power BI Download
Step 2
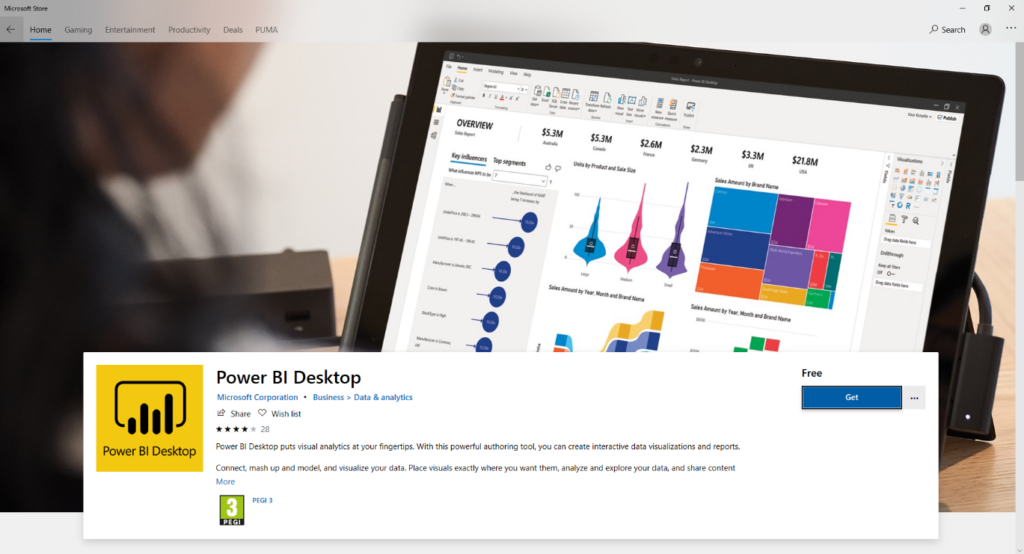
Clicking the Download button will launch Microsoft Store. This allows accessing the majority of Microsoft Programs in a user-friendly interface. To begin the installation process, click Get, the Power BI installation will then initiate with a progress bar highlighting the progress.
Step 3
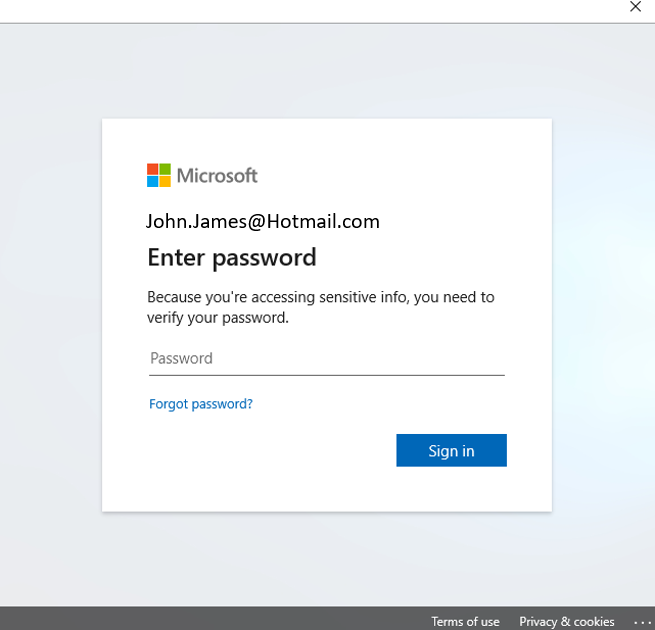
A sign-in window will then appear (unless you have already signed in). Simply type in your email and password, then hit Sign In. You will be taken back to the previous screen, and the installation will begin.
Step 4
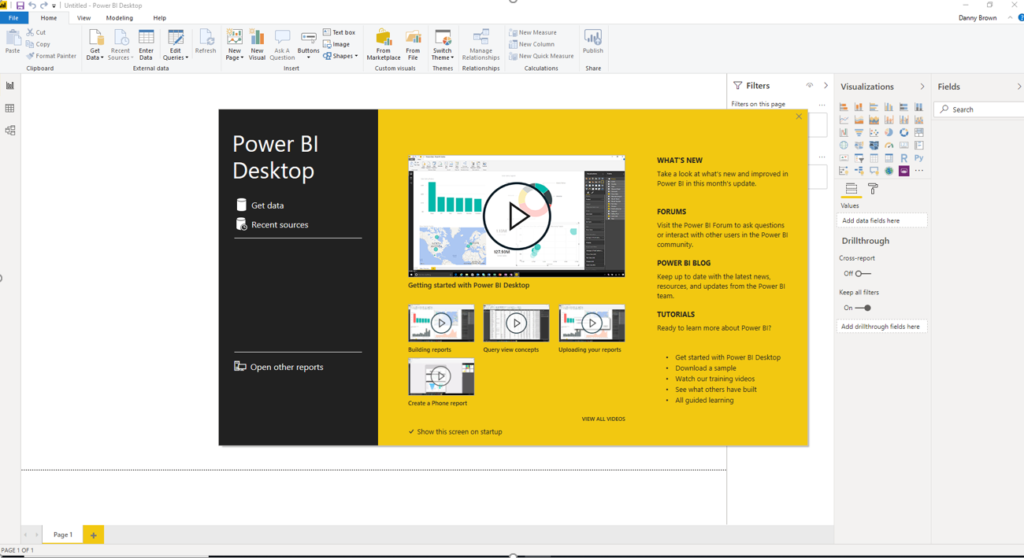
Once the installation process is complete, the Launch button should appear. Click the Launch button to open the Power BI Desktop App.
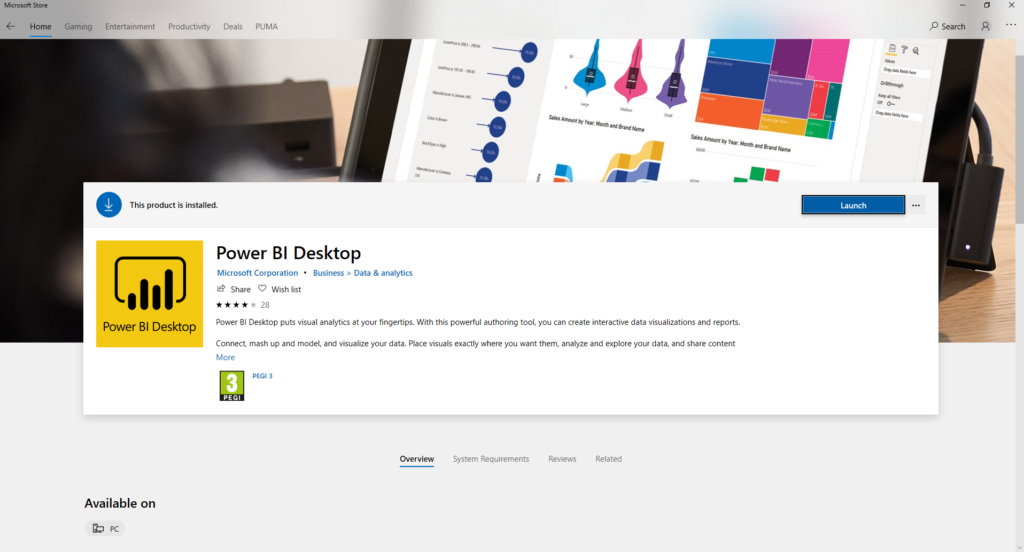
Step 5
Power BI should now be successfully installed.
You should now have a basic understanding of what Power BI is and know its main uses, in Part 2, we will move on to how we import data into the service through Excel, SQL Server, and The Web.
Tags: excel, excel power query, microsoft office, power bi Last modified: September 20, 2021