Would SQL Server graph database features fit your next project? While you may not know the definitive answer right now, you might be wondering, “What problems does it solve?”.
In broad terms, this post tackles the issues of what a graph database is, what its uses are, and what benefits you and your stakeholders can derive from SQL Server graph database capabilities. And see for yourself why that is not another excuse for using something new for your new project. So, if you haven’t yet checked out this “feature”, it’s time to take a look at how cool this is.
Who knows? This can be a great solution for your next project.
So, let’s dive right in.
What is a Graph Database?
While we know rows, columns, primary and foreign keys are part of relational databases, graph databases use nodes and edges. They are mainly suitable for many-to-many relationships. Unlike the HierarchyID, a node can have more than 1 parent, while HierarchyIDs are limited to one-to-many relationships only.
Meanwhile, nodes can have properties, and edges define the relationship between nodes.
Let’s make a more complete comparison between a graph database and a relational database. First, JOINs are used to relate different points of data in a relational database. To illustrate this, let’s say a social network model has individuals with friends. And then, to get someone’s friends from the database, you can apply a self-join to a table, like the one below:
SELECT
c.Name
FROM Person a
INNER JOIN FriendOf b on a.personId = b.PersonId
INNER JOIN Person c on b.friendId = c.personid
WHERE a.Name = 'Barry
The problem arises when querying for deeper levels (friends of friends of friends). Not only that the query becomes longer or more complex as you go deeper, but the performance also falls.
This is where graph databases show to good advantage.
In other words, as the complexity of the relationship increases, the ability of the relational data model decreases, whereas the ability of the graph data model grows.
Other notable differences are the following:
| Relational Model | Graph Model |
| Relationships are evaluated at query time when tables are joined | Relationships are stored in the database through edges |
| Conceptual model appears different from the physical model | Conceptual model is the same as the physical model |
To adjust to a graph database and shift from a relational database, you need to give up the relational model mindset. You are going to need this a lot when you form your queries later.
SQL Server Graph Database Features

As is commonly known, SQL Server is a relational database. But since SQL Server 2017, it has acquired graph database features. This begs the question: is it a relational database or a graph database?
The truth is, it is still a relational database sugarcoated with graph database features. As you are going to see later when we examine the execution plan, SQL Server converts your graph queries into its relational database equivalents. But don’t get disappointed by this fact or assume that the performance goes down. As you will find out later, with the right problem being solved, graph features can outperform a relational model equivalent.
Node and Edge Tables
As was mentioned, SQL Server implements nodes and edges in tables. And instead of primary and foreign keys, you can physically define relationships with edge tables. Later on, you will see how to create tables as nodes and edges.
Moreover, you define properties as columns in a table and assign the appropriate data type to them.
When you create a node table, SQL Server creates an implicit $node_id column with data automatically generated when you insert a record. You cannot remove this column or even update its value.
Similarly, when you create an edge table, SQL server creates the $edge_id, $from_id, and $to_id columns.
$from_id has the node id of the node where the edge originates. Meanwhile, $to_id has the node id of the node where the edge terminates. You can imagine a line with 2 points left and right. The left point is $from_id and the right point is $to_id.
$edge_id, on the other hand, is the unique autogenerated id column for the edge table. To illustrate what nodes, edge tables, and their IDs are, see Figure 1 below:
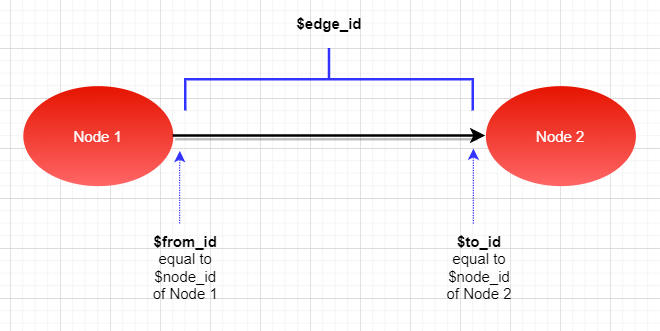
Figure 1: Node and edge tables illustrated
Which of the 2 nodes to fill the left and right of the edge is up to you.
Then, there are other autogenerated columns SQL Server will add that you should not remove or bother with.
Since nodes and edges are tables, you can do an INSERT, UPDATE, DELETE and SELECT. You can also CREATE, ALTER, and DROP them. And to speed up your queries, you can add indexes.
In addition to those, you can do a MATCH in the WHERE clause for pattern-matching and traversal. You will see the syntax of these later.
Last but not least, starting from SQL Server 2019, Microsoft has introduced the SHORTEST_PATH function to find the shortest path between any 2 nodes in a graph.
SQL Server Graph Database Feature Limitations
Like anything else in the world, SQL Server graph database features have their limitations:
- First of all, temporary tables, table type variables, system-versioned temporal tables, and memory-optimized tables cannot be node or edge tables.
- Secondly, in SQL Server Management Studio (SSMS), right-clicking a node or edge table will not show the Design menu item, unlike regular tables.
- Next, creating indexes for $node_id, $from_id, and $to_id using the GUI in SSMS will generate an error. Use CREATE INDEX in the query editor instead.
- And then, you cannot update $from_id and $to_id using the UPDATE statement. If you need to change a relationship between 2 nodes, insert a new record with the new $from_id and $to_id, and delete the old record.
- Following that, cross-database queries on graph objects are not supported.
- Another downside is you cannot change a node table to an edge table and vice versa.
- Finally, SQL Server cannot guess which node is related to another node. It’s up to you to provide the relationship of each node.
When to Use a SQL Server Graph Database
Here are some basic points to keep in mind when deciding if you need SQL Server graph database features.
- First, your application uses interconnected, hierarchical data with many-to-many relationships.
- Next, when HierarchyID, a one-to-many solution, is not enough.
- If you need to traverse or analyze relationships.
- When your application data evolves into more relationships.
- And in case your application falls in any of the following use cases:
- Fraud detection.
- Knowledge graph.
- Real-time recommendations.
- Master data management and identity management.
- Social network.
- Others like these.
In this article, we will use a real-time recommendation for an online food delivery system. Let’s imagine that this system uses a website that has the following features:
- Firstly, different restaurants can use this delivery company with an online food delivery system to get customers to buy food from them.
- Secondly, customers order food from this online food delivery system. Restaurants get notified, pack the order, and let the delivery company do the rest.
- Lastly, the system recommends restaurants near to the customer’s location, restaurants that other customers ordered from as well as food and drinks customers tend to order.
This is a bit similar to FoodPanda.com. So, how do we model this using a graph database?
How to Model a Graph Database
Surely, we won’t go into much detail of all the features mentioned. But let’s define the basic graph database for this purpose.
Below are the 2 simple steps:
- Define the nodes.
- Define the edges.
Let’s start by defining the nodes in this sample:
- Restaurant – Restaurants being serviced by the food delivery company.
- Locations – Locations of restaurants and customers.
- Orders – Orders made by customers to restaurants.
- OrderDetails – Details of orders including food or beverages ordered and the quantities.
- FoodBeverages – List of food and beverages.
- Customers – List of customers.
Now, below are the edges:
- isServed – Food is served in Restaurant.
- isLocated – Restaurant is located in Location.
- willReceiveIn – Customer will receive order in Location.
- ordered – Customer made Order.
- isIncluded – Food is included in Order.
- received – Restaurants received Orders.
- include – Order detail includes Food/beverage.
The conceptual model will look like this:
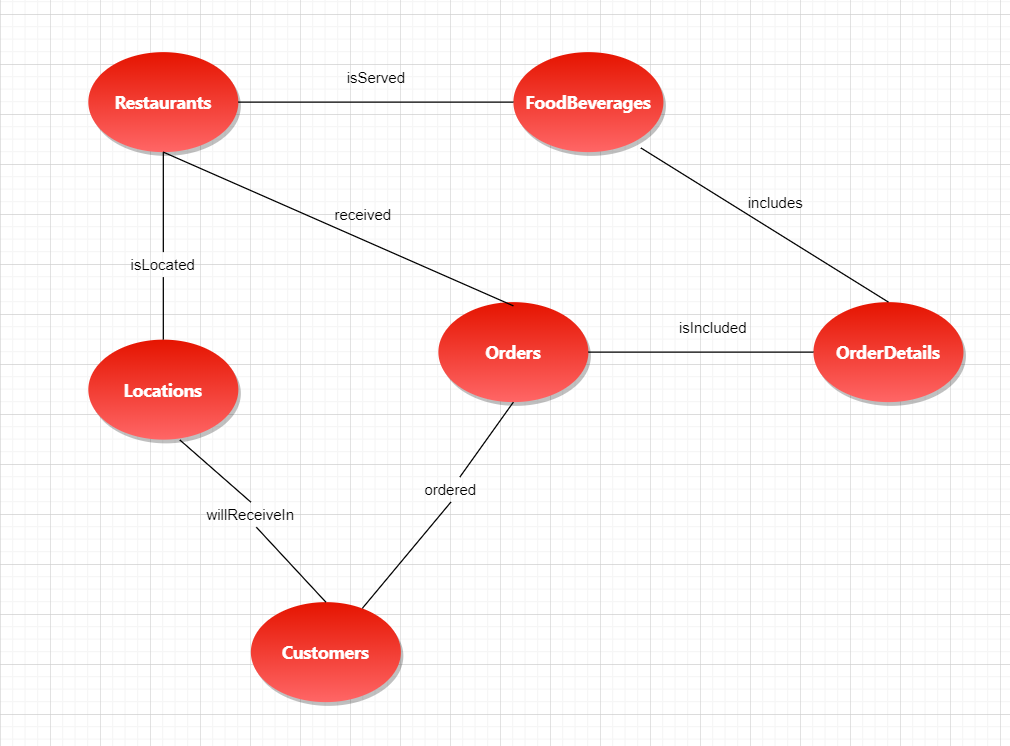
Figure 2: The graph database conceptual model for the food-delivery system
As a comparison, if we design a relational database diagram with all the primary and foreign keys, it will look like this:
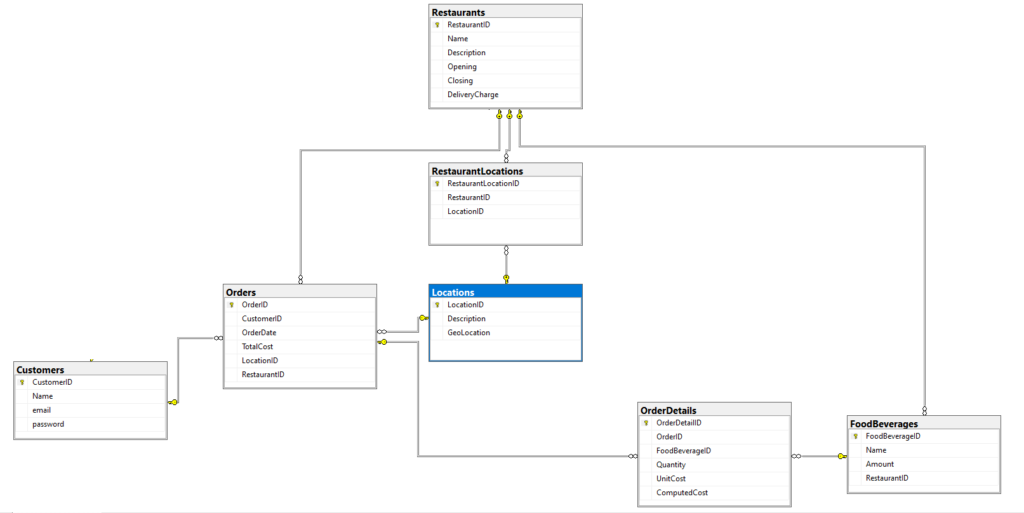
Figure 3: The equivalent relational database design for the food delivery system
Notice that we needed the additional table RestaurantLocations to join Restaurants and Locations.
And if you create a database diagram of the conceptual model of the graph database in SSMS, it will look like floating objects with no relationships, just as shown below:
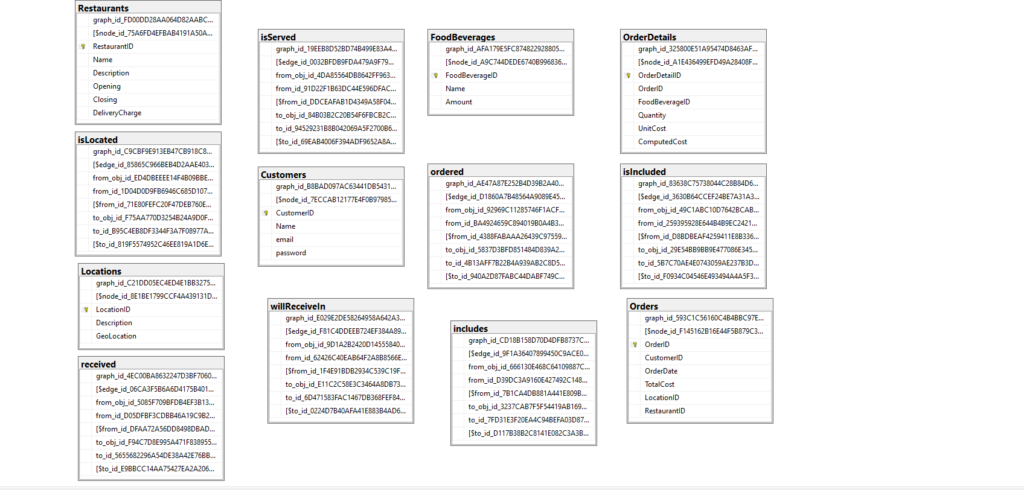
Figure 4: SSMS database diagram of the graph database model of the food delivery system
The database diagram in SSMS is no use if you want to view the relationships between the nodes and the edges graphically. Also, pay attention to the autogenerated columns. As I have already said, do not remove these columns or bother putting data into them.
How to Create Your First SQL Server Graph Database
Next, after you draw the nodes and edges on paper or any diagramming software, create the tables for the nodes and edges in SSMS using the query editor.
Below is the required syntax:
-- For a Node table
CREATE TABLE <tablename>
(
    column1 <datatype>,
    column2 <datatype>,
    columnN <datatype>
) AS NODE

-- For an Edge table
CREATE TABLE <tablename>
(
    column1 <datatype>,
    column2 <datatype>,
    columnN <datatype>
) AS EDGE
Notice the keywords AS NODE and AS EDGE. These keywords differentiate a graph table from other types of tables.
But if you prefer, right-click the Tables folder in SSMS and select New -> Graph Table -> Node Table. And for edge tables, select New-> Graph Table -> Edge Table. See the screenshot in Figure 5 below:
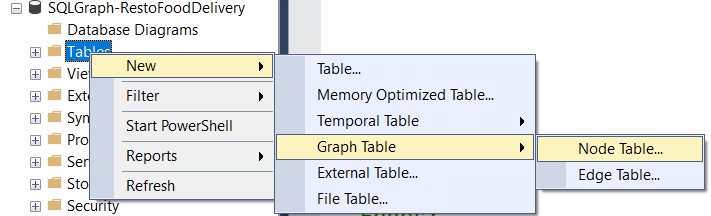
Figure 5: Creating node and edge tables in SQL Server Management Studio (SSMS)
Following that, a new query window will appear. Fill in the table name and fields you need, then execute the commands.
Indexes will be created automatically for $node_ids of your node tables and for the $edge_ids of your edge tables. But you must create one more index for the $from_id and $to_id of each of your edge tables for performance reasons.
See the example below:
CREATE UNIQUE INDEX ix_ordered_from_to on ordered ($from_id, $to_id)Now here’s the complete script of the node and edge tables we need:
CREATE TABLE Restaurants
(
[RestaurantID] INT PRIMARY KEY NOT NULL,
[Name] VARCHAR(20) NOT NULL,
[Description] VARCHAR(50) NOT NULL,
[Opening] TIME NOT NULL,
[Closing] TIME NOT NULL,
[DeliveryCharge] SMALLMONEY DEFAULT 0 NOT NULL
) AS NODE

CREATE TABLE Locations
(
[LocationID] INT PRIMARY KEY NOT NULL,
[Description] VARCHAR(50) NOT NULL,
[GeoLocation] GEOGRAPHY NOT NULL
) AS NODE

CREATE TABLE FoodBeverages
(
[FoodBeverageID] INT PRIMARY KEY NOT NULL,
[Name] VARCHAR(50) NOT NULL,
[Amount] MONEY NOT NULL
) AS NODE

CREATE TABLE Orders
(
[OrderID] INT PRIMARY KEY NOT NULL,
[CustomerID] INT NOT NULL,
[OrderDate] DATETIME NOT NULL,
[TotalCost] MONEY NOT NULL,
[LocationID] INT NOT NULL,
[RestaurantID] INT NOT NULL
) AS NODE

CREATE TABLE OrderDetails
(
[OrderDetailID] INT PRIMARY KEY NOT NULL,
[OrderID] INT NOT NULL,
[FoodBeverageID] INT NOT NULL,
[Quantity] TINYINT NOT NULL,
[UnitCost] MONEY NOT NULL,
[ComputedCost] MONEY NOT NULL
) AS NODE

CREATE TABLE Customers
(
[CustomerID] INT PRIMARY KEY NOT NULL,
[Name] VARCHAR(50) NOT NULL,
[email] VARCHAR(50) NOT NULL,
[password] VARCHAR(10) NOT NULL
) AS NODE

CREATE TABLE isServed AS EDGE
CREATE TABLE isLocated AS EDGE
CREATE TABLE ordered AS EDGE
CREATE TABLE isIncluded AS EDGE
CREATE TABLE received AS EDGE
CREATE TABLE includes AS EDGE
CREATE TABLE willReceiveIn AS EDGE

CREATE UNIQUE INDEX ix_isIncludes_from_to on isIncluded ($from_id, $to_id)
CREATE UNIQUE INDEX ix_includes_from_to on includes ($from_id, $to_id)
CREATE UNIQUE INDEX ix_ordered_from_to on ordered ($from_id, $to_id)
CREATE UNIQUE INDEX ix_received_from_to on received ($from_id, $to_id)
CREATE UNIQUE INDEX ix_isServed_from_to on isServed ($from_id, $to_id)
CREATE UNIQUE INDEX ix_isLocated_from_to on isLocated ($from_id, $to_id)
CREATE UNIQUE INDEX ix_willReceiveIn_from_to on willReceiveIn ($from_id, $to_id)
Inserting Your Initial Data
Preparing your data for the first time is kind of a pain because you need to insert data not just in the node tables but in the edge tables as well. Still, this will be advantageous for shorter and simpler queries. More on this later.
You will use an INSERT statement in the node and edge tables just like you do in other table types. And you can start adding records to node tables, as in the example below:
INSERT INTO Restaurants
VALUES
(1, 'Subway','American * Sandwiches * Fast Food * Salad','10:00','15:59',0)

INSERT INTO FoodBeverages
VALUES
(1,'Sliced Chicken and Ham',149.50),
(2,'Subway Melt',184.00),
(3,'Meatball Marinara Regular Meal',281.75),
(4,'Coke in Can',51.75)
For the edge tables, you will need a node ID for the $from_id and another node ID for $to_id, just like the one below:
--  food&beverages served on Subway (RestaurantID = 1)

INSERT INTO isServed
VALUES
-- for the Sliced Chicken and Ham
(
 (SELECT $node_id FROM Restaurants r WHERE r.RestaurantID = 1),
 (SELECT $node_id FROM FoodBeverages fb WHERE fb.FoodBeverageID = 1)
),
-- for the Subway Melt
(
 (SELECT $node_id FROM Restaurants r WHERE r.RestaurantID = 1),
 (SELECT $node_id FROM FoodBeverages fb WHERE fb.FoodBeverageID = 2)
),
-- for the Meatball Marinara Regular Meal
(
 (SELECT $node_id FROM Restaurants r WHERE r.RestaurantID = 1),
 (SELECT $node_id FROM FoodBeverages fb WHERE fb.FoodBeverageID = 3)
),
-- for  the coke in can
(
 (SELECT $node_id FROM Restaurants r WHERE r.RestaurantID = 1),
 (SELECT $node_id FROM FoodBeverages fb WHERE fb.FoodBeverageID = 4)
In the above example, we established a relationship between the restaurants and the food they serve. So, the node IDs of Restaurants and FoodBeverages were used.
And here’s the point: to establish relationships between node tables, you add records to edge tables.
For a complete script to populate the data in all the tables, see the links at the end of this article.
After we have inserted our initial data, it’s time to query it.
Querying a SQL Server Graph Database
Querying everything in a node table is as easy as ABC:
SELECT * from RestaurantsThat’s it! And you can do the same to edge tables.
Nonetheless, querying 2 related node tables requires the 2 node tables and 1 edge table to use the MATCH function within the WHERE clause. Quite different from what we got used to as we won’t use JOINs. Let’s start with a simple query using MATCH. This will display all the restaurants and the food they serve.
Example 1: Using MATCH
SELECT Restaurants.Name, FoodBeverages.Name, FoodBeverages.Amount
FROM Restaurants, isServed, FoodBeverages
WHERE MATCH(FoodBeverages<-(isServed)-Restaurants)
Let’s dissect the query:
SELECT Restaurants.Name, FoodBeverages.Name, FoodBeverages.Amount
– this simply lists the properties (columns) of the node. You can use table names or table aliases to reference the properties.
FROM Restaurants, isServed, FoodBeverages
– the FROM clause will include all the node and edge tables that you need in the query. In this case, node tables Restaurants and FoodBeverages, and the isServed edge table. If you’ve been programming SQL statements for quite a while, it will look like the SQL-89 standard syntax for SELECT.
WHERE MATCH(FoodBeverages<-(isServed)-Restaurants)
– This part will be the one that needs getting used to if you’ve never been to graph databases before. If I’m going to display this graphically, it will look like this:
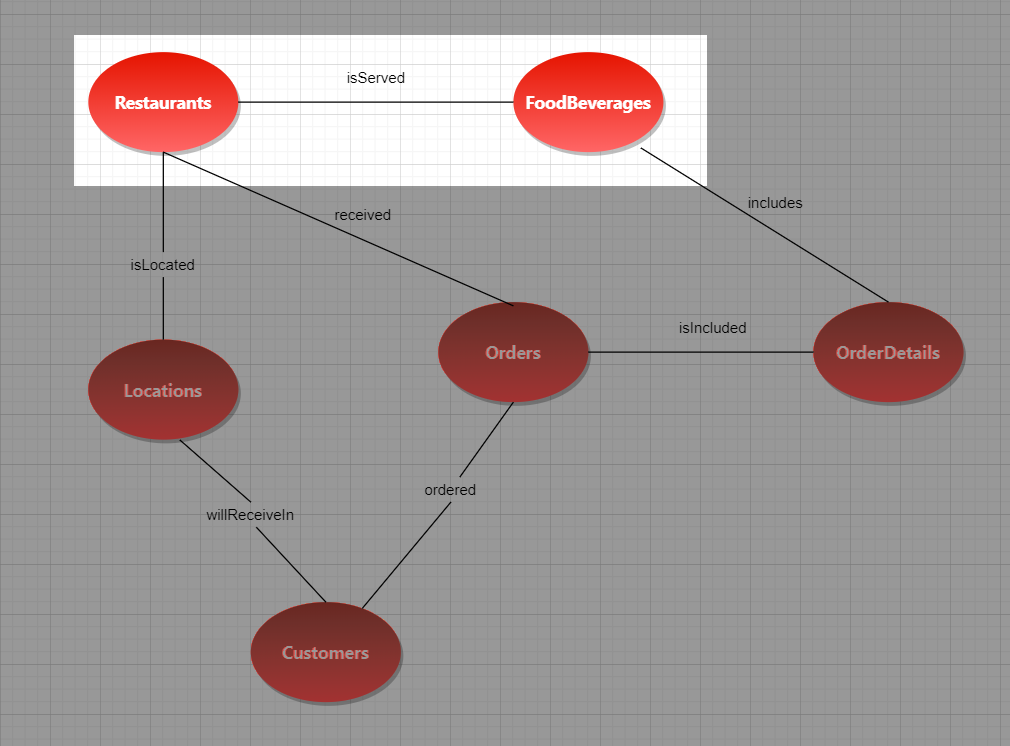
Figure 6: Highlighted in the graph database is the relationship between Restaurants and FoodBeverages. It looks like the MATCH syntax used in the sample.
As you see, the querying strictly follows the conceptual diagram we made earlier for the Restaurants and FoodBeverages. And edge tables are always enclosed in parentheses. In this case, the isServed edge table is used to relate Restaurant to FoodBeverages.
Now, notice the arrows. When you inserted records in the edge table, you defined what’s the $from_id and $to_id. This will follow where the arrow will start and end.
Querying graph databases is simpler and more natural because it basically follows the conceptual model.
Before we are finished with this example, below is the result set:
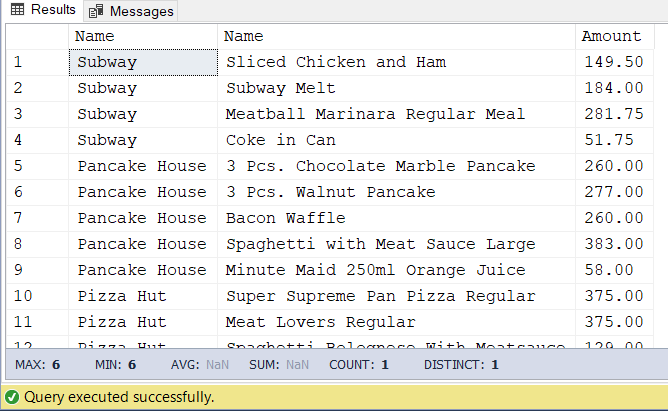
Figure 7: Result set showing the list of restaurants and the food they serve
Example 2: Using MATCH
This time, let’s try another example that may be common to the food delivery system website. Imagine that a customer is ordering food for the very first time. Since he’s starving, he would like to order food from the nearest restaurant.
In this example, Customer Fletcher (CustomerID=3) is in the Ateneo de Manila University School of Medicine (LocationID=7). He needs to know the nearby restaurants located within 1000 meters from him. This is what will become of the query:
-- this will be used to store Fletcher's location - the place where the
-- order will be delivered
DECLARE @deliveryLocation GEOGRAPHY

-- Get the location of Fletcher. We assume that Fletcher defined his location from his account with a map.
SELECT @deliveryLocation = Locations.GeoLocation
FROM Customers, willReceiveIn, Locations
WHERE MATCH(Customers-(willReceiveIn)->Locations)
AND Customers.CustomerID = 3

-- Get the restaurants within 1000m from Fletcher's location
SELECT
 Restaurants.Name
,Restaurants.Description
,Restaurants.Opening
,Restaurants.Closing
,Locations.Description
,ROUND(Locations.GeoLocation.STDistance(@deliveryLocation),2) AS Distance
FROM Restaurants, isLocated, Locations
WHERE MATCH(Restaurants-(isLocated)->Locations)
AND locations.GeoLocation.STDistance(@deliveryLocation) <= 1000
ORDER BY Distance
Here’s the result set:
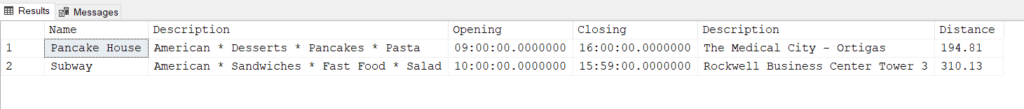
Figure 8: Result set showing the list of restaurants within 1000 meters from the customer’s location
Nice, isn’t it?
Since we know the location of both the restaurant and the customer, we can measure the distance between them using the geography data type and the STDistance function. I’ll explain more about the geography data type in the next post.
Example 3: Answering “People who ordered <food item> also ordered…”
Now, since this system uses a real-time recommendation, let’s try something a bit more complex like returning the result for “People who ordered <food item> also ordered…”
In this example, we would like to know what else people ordered when ordering Berry Pomegranate Power (FoodBeverageID=16) from Jamba Juice.
SELECT
fb2.Name
FROM Orders o1, isIncluded ii1, OrderDetails od1, includes i1, FoodBeverages fb1
     ,isIncluded ii2, OrderDetails od2, includes i2, FoodBeverages fb2
WHERE MATCH(fb1<-(i1)-od1<-(ii1)-o1-(ii2)->od2-(i2)->fb2)
AND fb1.FoodBeverageID = 16
AND fb2.FoodBeverageID <> 16
Let’s dissect the query.
FROM Orders o1, isIncluded ii1, OrderDetails od1, includes i1, FoodBeverages fb1
,isIncluded ii2, OrderDetails od2, includes i2, FoodBeverages fb2
There are 2 things to get the result we want:
- The orders containing Berry Pomegranate Power (FoodBeverageID = 16). This is accomplished by listing the tables Orders o1, isIncluded ii1, OrderDetails od1, includes i1, FoodBeverages fb1.
- The same orders containing items other than Berry Pomegranate Power (FoodBeverageID <> 16). This is accomplished by adding isIncluded ii2, OrderDetails od2, includes i2, FoodBeverages fb2.
We added the node and edge tables twice to satisfy the 2 conditions above.
WHERE MATCH(fb1<-(i1)-od1<-(ii1)-o1-(ii2)->od2-(i2)->fb2)
This is the path to graph from FoodBeverages <- OrderDetails <- Order -> OrderDetails -> FoodBeverages. This is illustrated in the graph below:
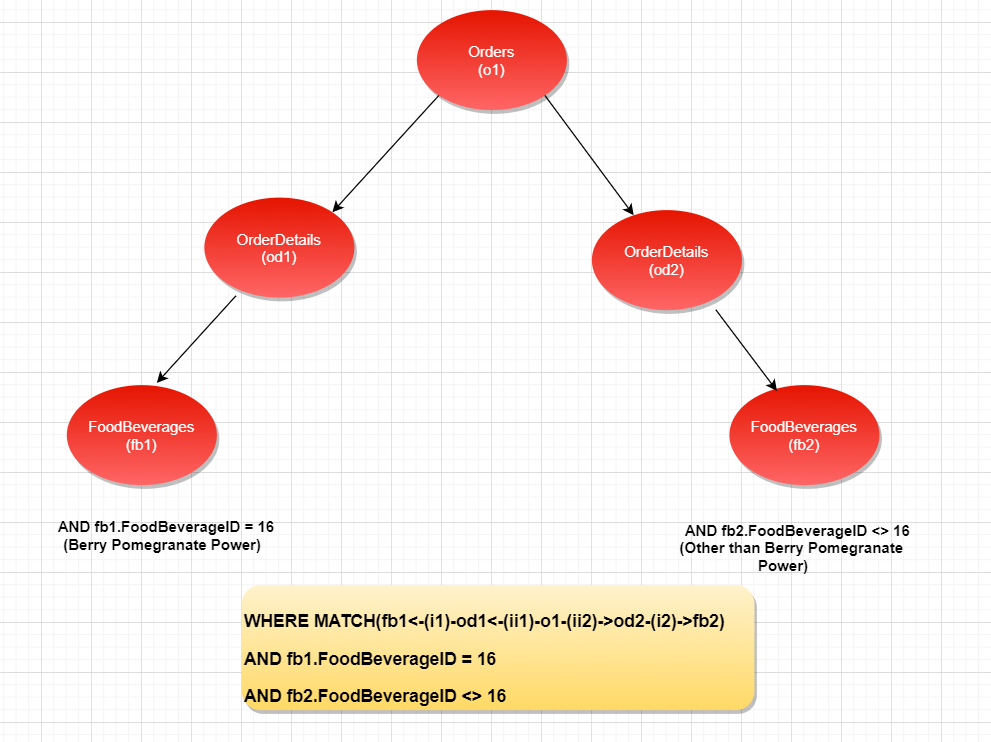
Figure 9: The graphical representation of MATCH(fb1<-(i1)-od1<-(ii1)-o1-(ii2)->od2-(i2)->fb2)
The WHERE clause with MATCH is constructed to traverse the graph in this order. To further filter the condition and get the exact records we want, the required conditions are appended to the WHERE clause:
AND fb1.FoodBeverageID = 16 — for orders with Berry Pomegranate Power
AND fb2.FoodBeverageID <> 16 — for the same orders with items other than Berry Pomegranate Power
And the result? Please see below:
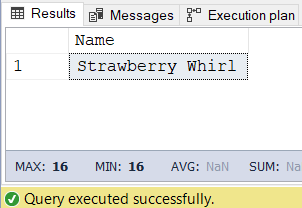
Figure 10: Strawberry Twirl is the item ordered by customers who also ordered Berry Pomegranate Power
Example 4: Answering “People who ordered from <Restaurant> also ordered from..”
Let’s try another recommendation.
In this example, we will answer “People who ordered from Jamba Juice also ordered from…”.
Let’s use the same logic using different nodes and edges. Here goes:
SELECT DISTINCT
 r1.Name
,r1.Description
,r1.Opening
,r1.Closing
FROM Restaurants r1, received rcv1, Orders o1, ordered ord1, Customers c
     ,Restaurants r2, received rcv2, Orders o2, ordered ord2
WHERE MATCH(r1-(rcv1)->o1<-(ord1)-c-(ord2)->o2<-(rcv2)-r2)
AND r1.RestaurantID <> 4
AND r2.RestaurantID = 4
Again, let’s dissect:
FROM Restaurants r1, received rcv1, Orders o1, ordered ord1, Customers c
,Restaurants r2, received rcv2, Orders o2, ordered ord2
The graph path we need is Restaurants->Orders<-Customers->Orders<-Restaurants.
WHERE MATCH(r1-(rcv1)->o1<-(ord1)-c-(ord2)->o2<-(rcv2)-r2)
This clause can be graphically illustrated using the Figure 11 below:
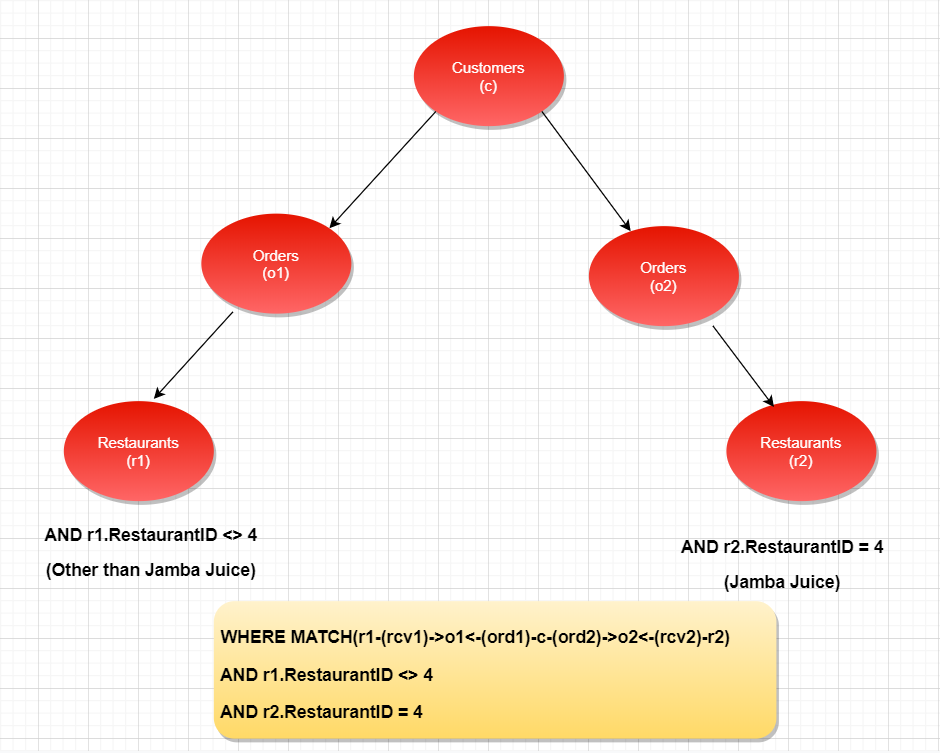
Figure 11: The graphical representation of MATCH(r1-(rcv1)->o1<-(ord1)-c-(ord2)->o2<-(rcv2)-r2)
AND r1.RestaurantID <> 4 AND r2.RestaurantID = 4
And like the previous example, we need 2 required conditions:
- First, customers who ordered from Jamba Juice (RestaurantID=4).
- Then, the same customers who also ordered from restaurants other than Jamba Juice (RestaurantID <> 4).
And before we forget, below are the restaurants from which people also ordered aside from Jamba Juice:
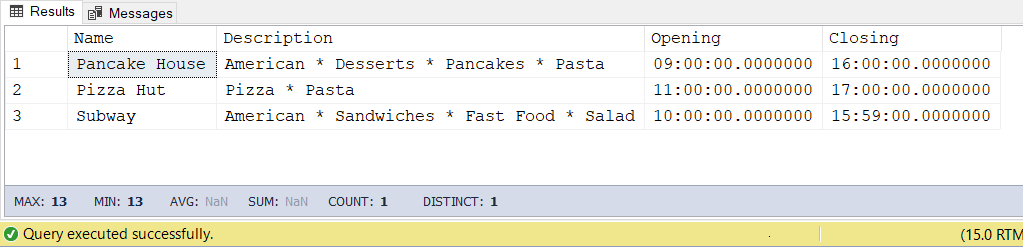
Figure 12: Customers also ordered food from Pancake House, Pizza Hut, and Subway, as shown in this result set
So, how do you like querying graph tables so far?
Do you wonder if all of these are worth it? We can do the same thing using a relational model.
Actually, you may be in for a surprise in the next section.
Benefits of Using SQL Server Graph Database Features
There are 2 benefits of using SQL Server graph features. And that’s a big deal. So let’s have a look at both of them.
1. SQL Server Graph Database Query Syntax Is Simpler
Let’s use the same graph query that answers “People who ordered <food item> also ordered…”:
SELECT
fb2.Name
FROM Orders o1, isIncluded ii1, OrderDetails od1, includes i1, FoodBeverages fb1
     ,isIncluded ii2, OrderDetails od2, includes i2, FoodBeverages fb2
WHERE MATCH(fb1<-(i1)-od1<-(ii1)-o1-(ii2)->od2-(i2)->fb2)
AND fb1.FoodBeverageID = 16
AND fb2.FoodBeverageID <> 16
Now, let’s compare it with the query using the usual relational approach. Please note that I created a relational database with similar tables and added primary and foreign keys. See the diagram I showed earlier in Figure 3. Here’s the equivalent query:
WITH OrderIDs AS
     (
      SELECT Orders.OrderID
      FROM Orders
      INNER JOIN OrderDetails ON Orders.OrderID = OrderDetails.OrderID
      WHERE Orders.RestaurantID=4
      AND OrderDetails.FoodBeverageID = 16
     )
SELECT
FoodBeverages.[Name]
FROM Orders
INNER JOIN OrderDetails ON Orders.OrderID = OrderDetails.OrderID
INNER JOIN FoodBeverages ON OrderDetails.FoodBeverageID =
                             FoodBeverages.FoodBeverageID
WHERE Orders.RestaurantID=4
AND FoodBeverages.FoodBeverageID <> 16
AND Orders.OrderID IN (SELECT OrderID FROM OrderIDs)
Both queries will return 1 record, which is Strawberry Whirl (See Figure 10).
One thing that we can highlight from the 2 is how simpler and shorter the graph query is compared to the relational approach. Even if you use a subquery instead of a common table expression (CTE), the resulting code will be longer than the SQL graph query.
Why is that?
Because the graph query solves a problem more suited for graph databases.
But that’s not the end of it.
2. SQL Server Graph Database Performance Is Better
Like I mentioned earlier, with the right problem, a graph database can outperform the relational equivalent. Let’s put that to the test.
We will use STATISTICS IO to gauge how many logical reads both queries use and see how much data SQL Server needs to process these queries. The bigger the number is, the slower the query is.
SQL GRAPH QUERY ANALYSIS
Let’s start with the graph query:
SELECT
fb2.Name
FROM Orders o1, isIncluded ii1, OrderDetails od1, includes i1, FoodBeverages fb1
     ,isIncluded ii2, OrderDetails od2, includes i2, FoodBeverages fb2
WHERE MATCH(fb1<-(i1)-od1<-(ii1)-o1-(ii2)->od2-(i2)->fb2)
AND fb1.FoodBeverageID = 16
AND fb2.FoodBeverageID <> 16
The logical reads from this query are shown below:
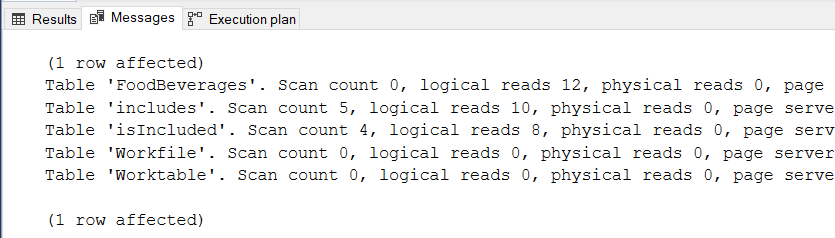
Figure 13:STATISTICS IO result for the graph query sample
Here are some points from Figure 13:
- The query needs 12 * 8kb (96kb) from FoodBeverages, 10 * 8kb (80kb) from includes edge table, and 8 * 8kb (64kb) from isIncluded edge table. Total of 240kb.
- The query uses tempdb because of the presence of WorkFile and WorkTable. If you take a look at the execution plan, it has a node with a Hash match. This will do just fine with zero values in all criteria.
- We didn’t see the tables Orders and OrderDetails in the result, but their edge tables appeared.
Before we proceed to the second query, let’s check the execution plan.
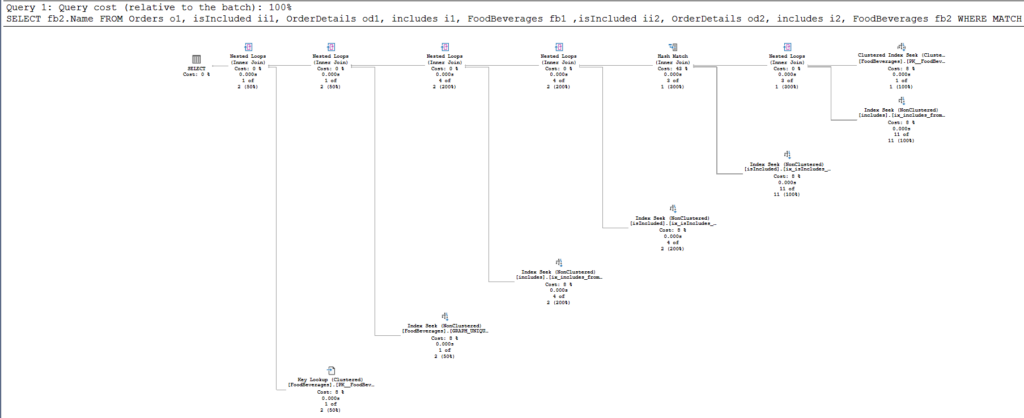
Figure 14:Execution plan for the graph database query
The first thing you might notice is the presence of INNER JOINs in most of the nodes of the execution plan.
Why? Aren’t we using a graph database?
Here’s a fact to consider: Since SQL Server IS a relational database WITH graph features and NOT a native graph database, it’s natural to have a query processor that will behave with a relational approach.
However, the big question is: is this bad for performance?
The result of our analysis with the second query is going to reveal the answer.
RELATIONAL QUERY ANALYSIS
Let me provide the second query again:
WITH OrderIDs AS
     (
      SELECT Orders.OrderID
      FROM Orders
      INNER JOIN OrderDetails ON Orders.OrderID = OrderDetails.OrderID
      WHERE Orders.RestaurantID=4
      AND OrderDetails.FoodBeverageID = 16
     )
SELECT
FoodBeverages.[Name]
FROM Orders
INNER JOIN OrderDetails ON Orders.OrderID = OrderDetails.OrderID
INNER JOIN FoodBeverages ON OrderDetails.FoodBeverageID =
                           FoodBeverages.FoodBeverageID
WHERE Orders.RestaurantID=4
AND FoodBeverages.FoodBeverageID <> 16
AND Orders.OrderID IN (SELECT OrderID FROM OrderIDs)
And below is the result of the STATISTICS IO:
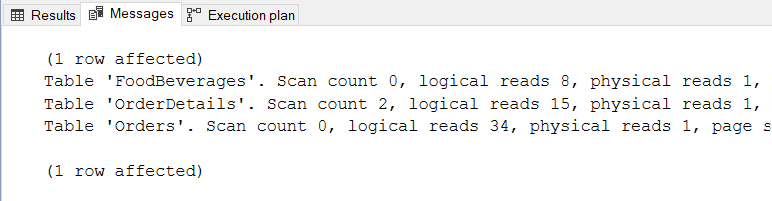
Figure 15: STATISTICS IO for the relational database query for the same purpose
What did this reveal?
- FoodBeverages has logical reads of 8 * 8kb (64kb), OrderDetails with 15 * 8kb (120kb), and Orders with 34 * 8kb (272kb). A total of 456kb. This is almost twice as much compared to the graph query logical reads.
- No tempdb usage.
So, is using a graph database a bad idea?
The numbers in the STATISTICS IO speak for themselves. Graph database queries can outperform the relational equivalent when solving a real-time recommendation system problem.
Can Graph Databases Solve All Our Database Problems?
At this point, your familiarity with the capabilities of graph databases has become better. But like I have stressed repeatedly, you need the right problem to solve when using the power of graph databases.
In other words, we cannot abandon relational databases altogether. They’ve been solving our database needs for decades. So, how do you know if your next project merits the need for graph databases? What questions should you ask yourself when deciding if this is a good fit?
I have already mentioned the use cases for graph databases above. But if you are still in doubt, here are some more points to help you decide if you really need them.
Do Most of Your Queries Need to Traverse Nodes?
First and foremost, relationships are essential in graph databases. Consider the real-time recommendation system we used in this article. To get the food item people ordered as well, you need to traverse nodes. The connections or relationships matter a lot to get the answer you need. Technically speaking, your requirements need queries with a WHERE clause structured like this (at least):
WHERE MATCH(node1-(edge1)->node2<-(edge2)-node3)Or a more complex one using SHORTEST_PATH.
Hence, if you only store data and query from a single point, you don’t need a graph database. How do you know? Again, technically speaking, the WHERE clause is something like the one below:
WHERE table1.column1 = value
AND table2.column2 = value
AND tableX.columnX = value
The above structure doesn’t need to traverse the relationships of the records involved. It queries for specific values.
Will I Just Store Data and Rarely Query It?
Table records that involve logs without relationships to other entities or anything similar that doesn’t require querying on a regular basis don’t need a graph solution.
Am I Just Going to Store a Key-Value Pair?
Storing key and value pairs and retrieving values using an ID as a key is better suited for a relational database or a key-value store.
Conclusion
To sum up, SQL Server graph database is a feature introduced in SQL Server 2017. So what have we learned and how can we make use of it?
- A graph database uses nodes and edges and is good for many-to-many relationships.
- Then, we can make use of it in scenarios like real-time recommendation engines, or requirements that involve traversing relationships between nodes.
- Next, in SQL Server, nodes and edges are implemented as tables. To speed up the queries, you can use indexes just like other table types.
- Then, inserting data can be a bit hard, but the reward is in simpler and faster queries suited for traversing graphs.
- Lastly, graph databases are good solutions to the right problem. The same is true for the relational databases that served us for decades.
Why not try your hand at using the graph features of SQL Server? Below, you can find the scripts we used in this article to test it out.
- Tables, indexes, and sample data for the graph database
- Tables, indexes, and sample data for the relational database
Additionally, in case you need more information on SQL Server graph features, here are the resources from Microsoft:
- SQL Graph
- MATCH (T-SQL)
- Architecture
- Sample
If you enjoyed reading this article, please encourage us by sharing this in your social networks.
Tags: edge table, how to, node table, sql server, sql server 2017, sql server graph database Last modified: September 20, 2021