
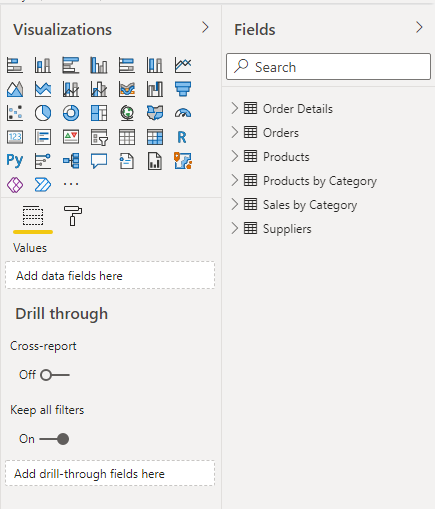
The Power BI Drill-through feature allows us to dig deeper into the data and get detailed information about a particular data entity.
This article will explore the Northwind database to create a simple report that includes the Power BI Drill-through functionality. The script and the detailed information on creating the Northwind database on your SQL Server instance can be found in the dedicated branch of GitHub.
- Import Data in Power BI from SQL Server
- How to Create a Report with Drill-Through Filter in Power BI
- Setting Up Drill-through from Table in Power BI
- Perform Drill-Through Operations in the Visualization
- Conclusion
Import Data in Power BI from SQL Server
Thus, our first task is to create the Northwind database on the SQL Server instance.
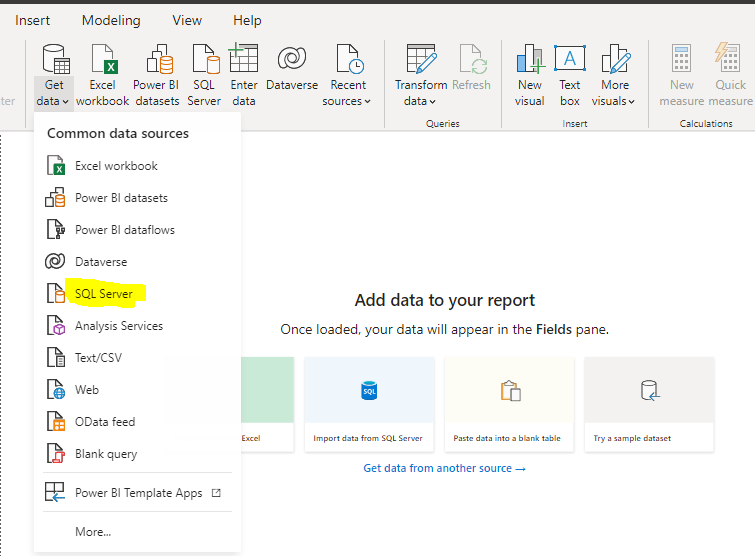
Open the Power BI dashboard and click the Get data option from the top menu. A dropdown list will appear. Select SQL Server from the dropdown list:
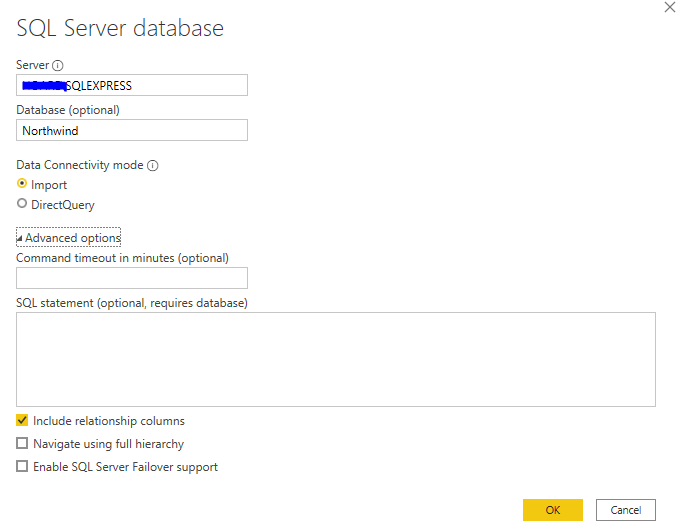
Next, you need to enter your SQL Server name and the database name. Look at the following screenshot for reference:
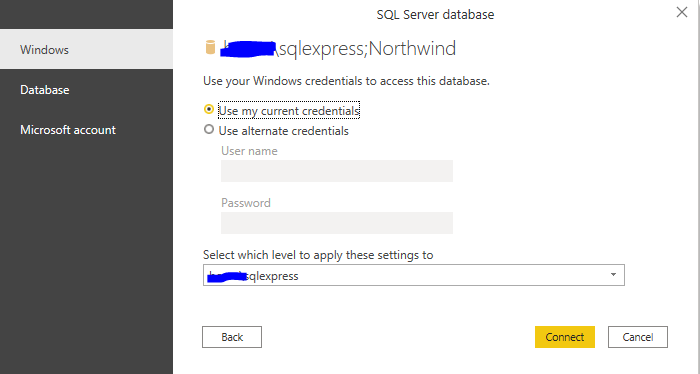
You will be asked to specify the credentials to access the dataset. Click the Connect button.
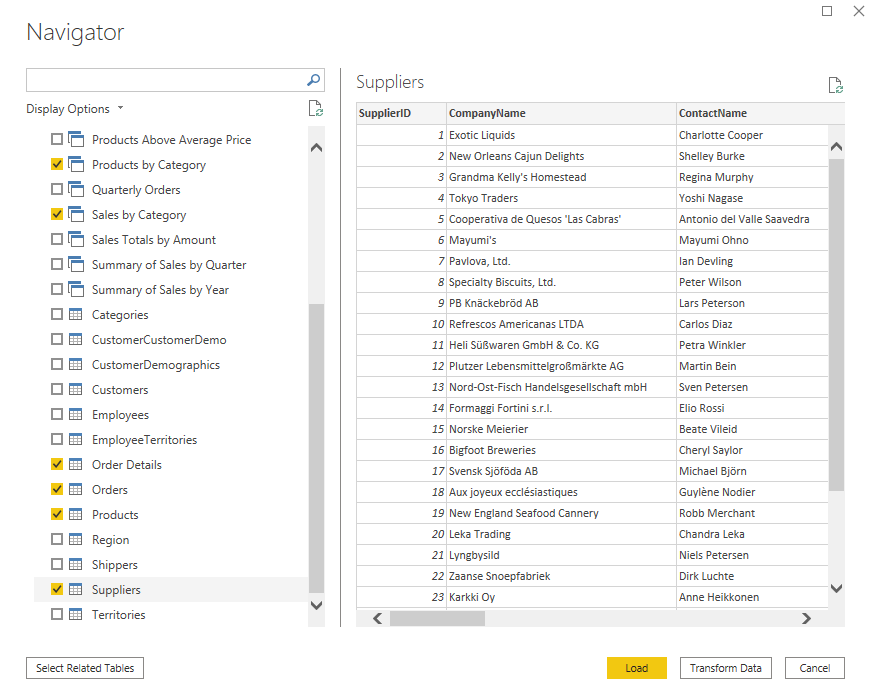
In the next window, have a look at the list of all the tables inside the Northwind database on the left. You can select the necessary tables.
Click Load to get the data into your reports view.
Once you’ve loaded the data into your reports view, you can see all the tables in the Fields window on the right side of your reports view:
How to Create a Report with Drill-Through Filter in Power BI
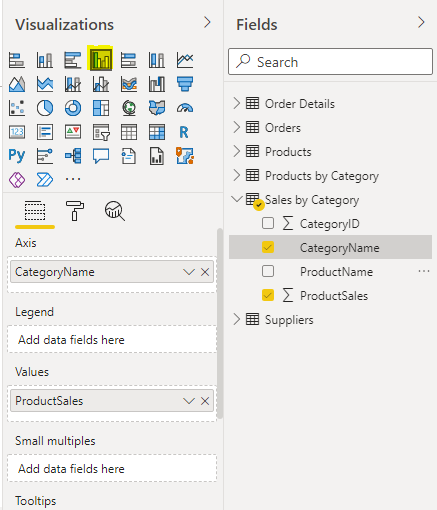
In the Visualizations window in your reports view, select Clustered Column Chart.
In the Axis field, add the CategoryName column from the Sales by Category table.
In the Values field, add the ProductSales column from the same table.
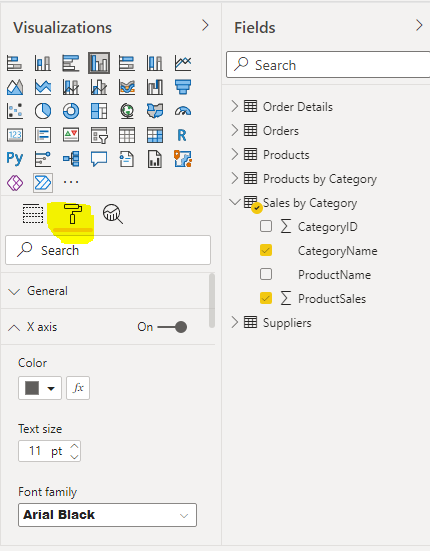
For a clearer view, we will increase the font size and the font family of the labels on the X-axis of our clustered column chart. To do so, you can go to the Format option, select X-axis, and then change the Text size and Font Family fields as shown in the following screenshot.
After performing the above steps, you can see a clustered column chart in your reports view:
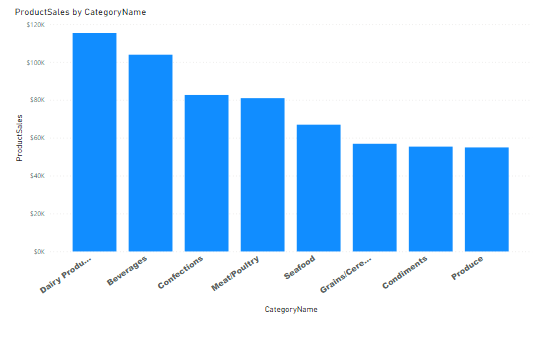
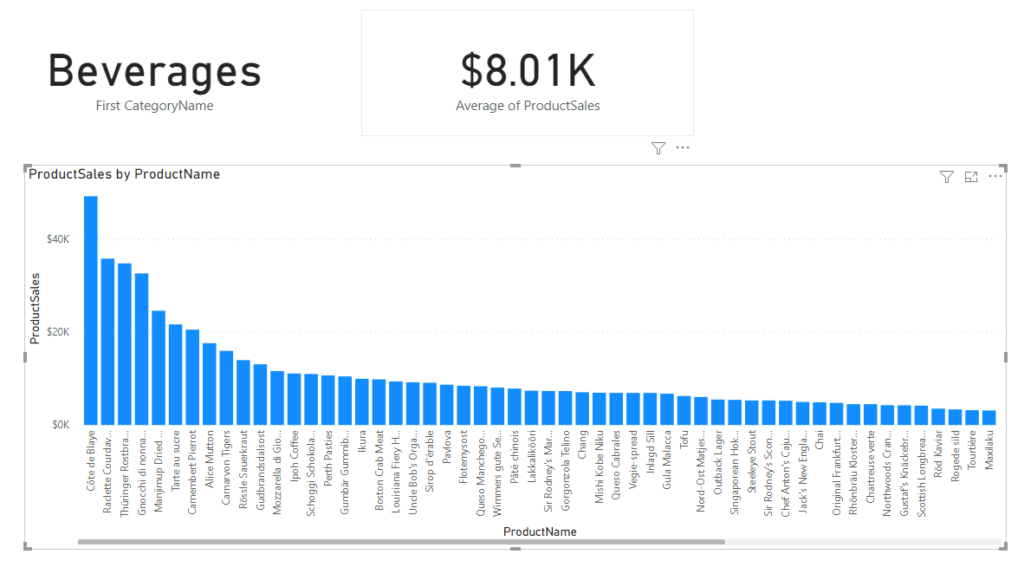
You can see the sum of product sales for different categories of products in the Northwind database and the overall product sales for each category. But what if you want to see the product sales for all seafood products? How can you do that? The answer is Power BI Drill-through.
Setting Up Drill-through from Table in Power BI
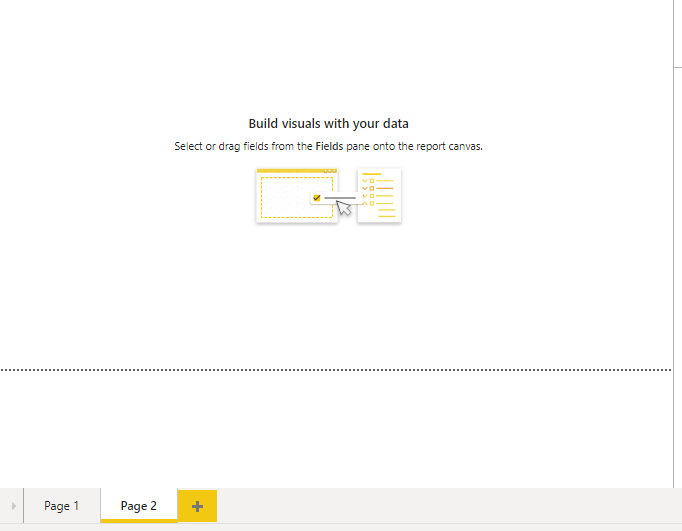
Create a new page in your Power BI reports view. You can do so by clicking the + button at the bottom of your reports view. A new page will be created inside your report – empty by default:
We will add some information on this second page. This information will be updated based on the category name selected on Page 1.
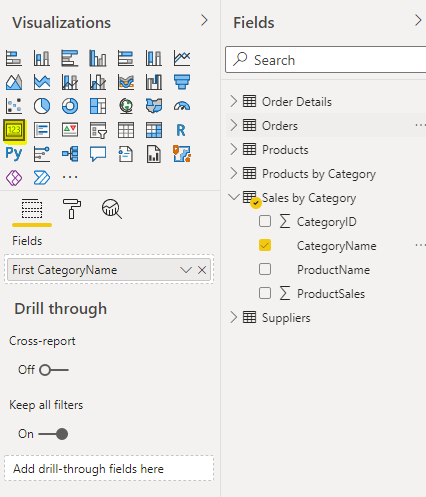
On Page 2, add a card that will show the name of the category (see the following screenshot).
In the Fields category, you need to add the CategoryName column from the Sales by Category table.
In the same way, we will add another card showing the average product sales price for all products in a particular category:
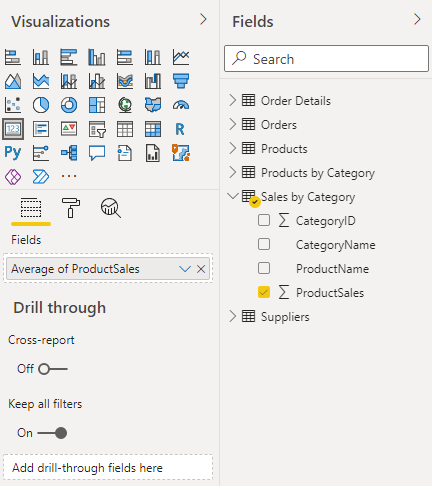
At this point, Page 2 of your reports view should contain two cards. One shows the category name, and another one will show the average of product sales of all products in that category.

Don’t worry about the default category name and the number of average sales now. These are default values from the CategoryName and ProductSales tables. They will be updated later when you use the Power BI Drill-through functionality.
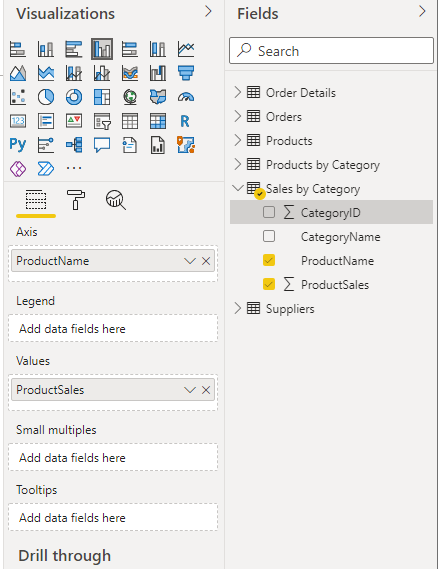
One Page 2, we add a clustered column chart that shows the sum of sales for all products in a particular category. This chart will be updated based on the categories selected from the clustered column chart on Page 1.
In the Axis field, you will add the ProductName column. In the Values field, you will add the ProductSales column from the Sales by Category table:
Page 2 of your reports view should now contain 2 cards and a clustered column chart as shown in the following image:
Now, the interesting part comes. You will be defining your Drill-through column.
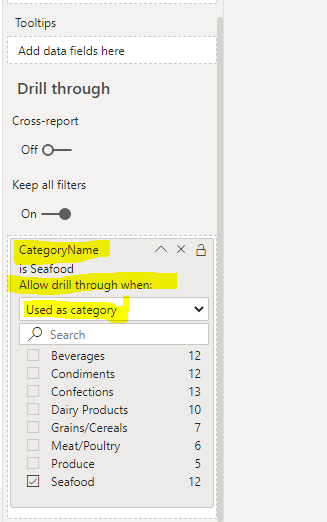
You want to get your clustered column chart updated using the CategoryName column whenever someone uses the Drill-through functionality to open Page 2. Therefore, in the Add drill-through fields here field (see the following screenshot), drag and drop the CategoryName column.
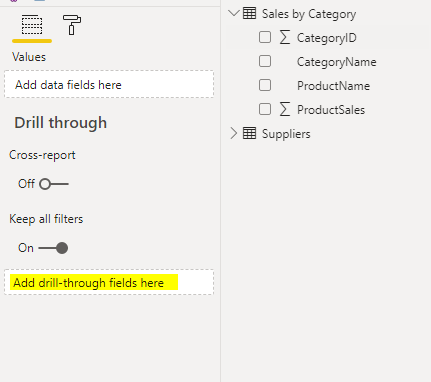
Your drill-through field should now look like this:
Perform Drill-Through Operations in the Visualization
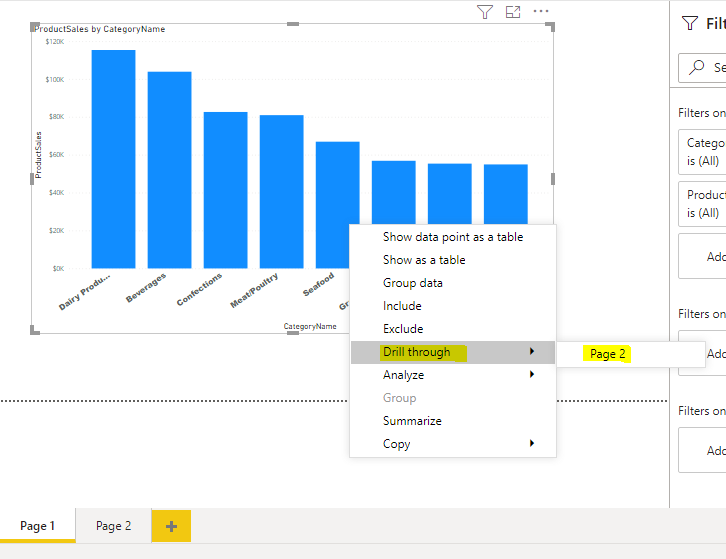
Go to Page 1 and right-click the bar for any category in your clustered column chart. From the list of options that appear, select Drill through > Page 2. Click the bar for the Seafood category, as shown in the below image.
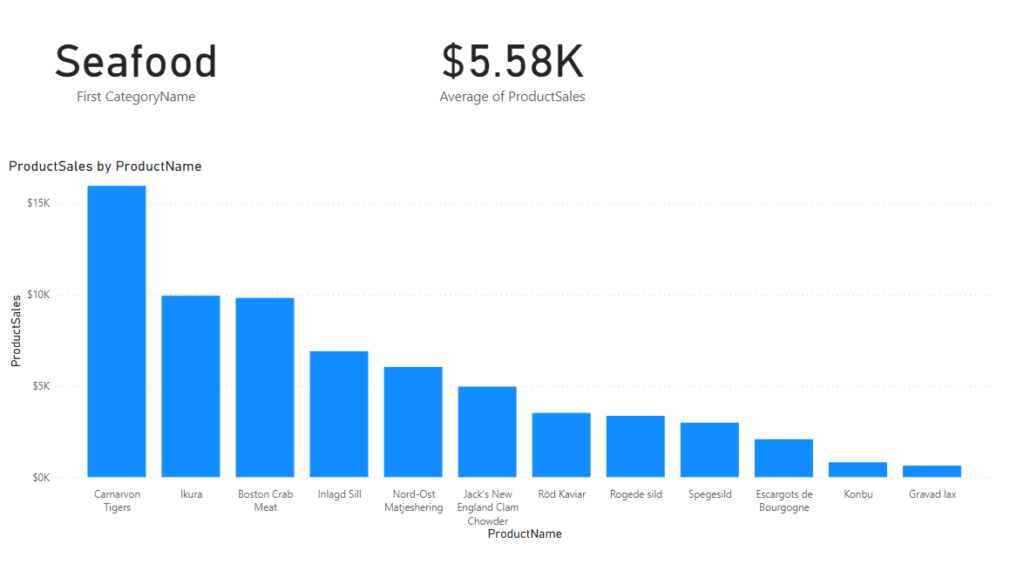
You will be taken to Page 2 of your visualization where you can see the category name (Seafood) in one card, and the average sales for all the products in that category. Furthermore, the clustered column chart will display the sum of sales for individual products in the Seafood category.
Let’s try another category from Page 1. Click the bar for the Meat/Poultry category from the clustered column chart on Page 1, and then drill through to Page 2. You can see the category name, the average sales of all the products, and the sum of sales for individual products in the Meat/Poultry category.
Conclusion
The Drill Through feature in Power BI has proved itself to be helpful. You can get detailed information on your sales that is much more problematic to obtain in different ways. Use it to analyze your sales and plan your business development!
Tags: power bi, power bi features, power bi reports Last modified: October 27, 2022