
In this article, you will see how to create paginated reports using the Power BI Report Builder tool from Microsoft. You will also see how you can create parameterized paginated reports that display filtered data based on some parameter values.
Table of Contents
- Creating Paginated Report using Power BI Report Builder
- Get Default Paginated Report with Power BI Report Builder
- Formatting the Paginated Report
- Parameters for Filtering Data in Paginated Report
- Publishing Paginated Report in Power BI
At first, you need to download the Power BI Report Builder tool here:
Creating Paginated Report using Power BI Report Builder
Step 1. Install the Power BI Report Builder
Install the Power BI Report Builder and run it. You will see the following dashboard:
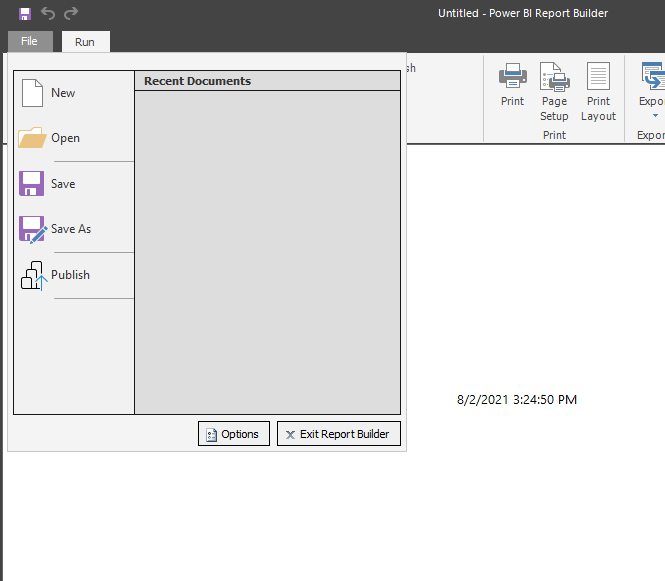
Since you will be creating a New paginated report, click the New option. If you want to open an existing paginated report, you can select the Open option.
Step 2. Choose Table or Matrix Wizard
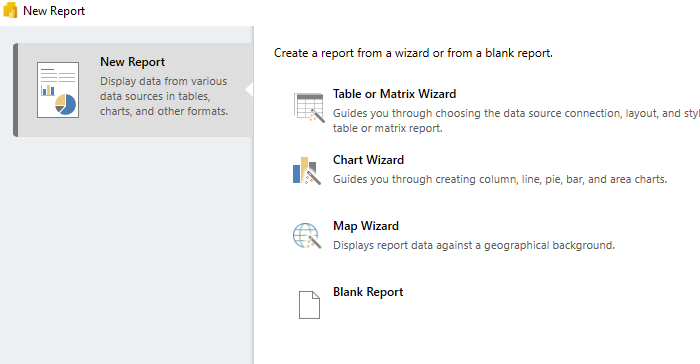
In the Power BI Report Builder tool, you have the options as shown in the following screenshot. You will be creating a paginated report that displays data in the form of a table. Therefore, select the first option i.e. Table or Matrix Wizard.
Before you follow the next steps, make sure you have created the Northwind database on your SQL Server instance. The script and the details can be found here.
Step 3. Connecting to a Data Source
Once you have created the Northwind database on your SQL Server instance, click the Next button:
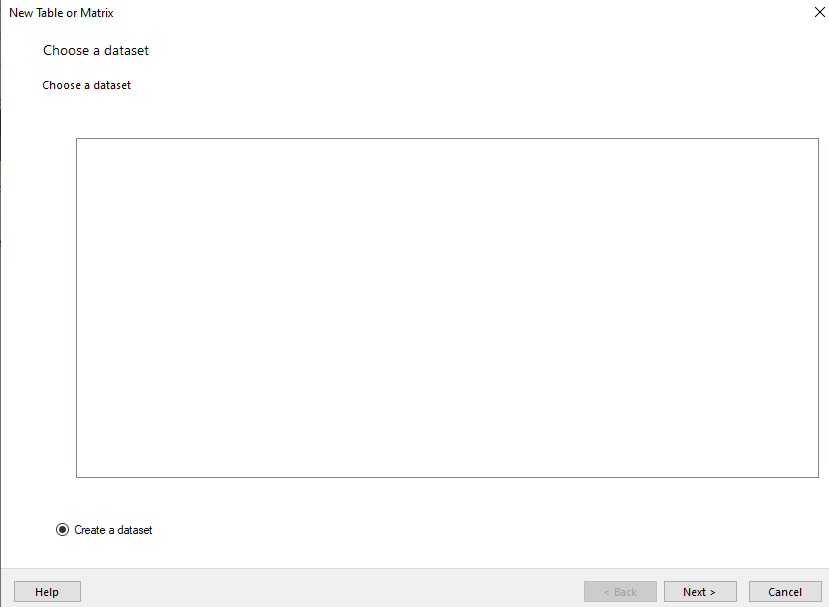
You will see the following screen:
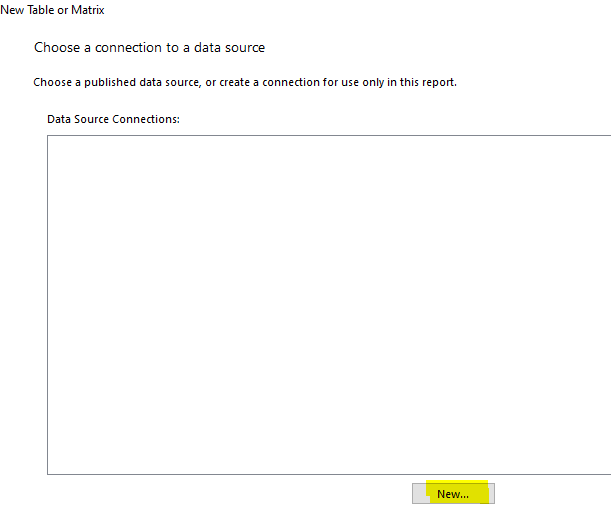
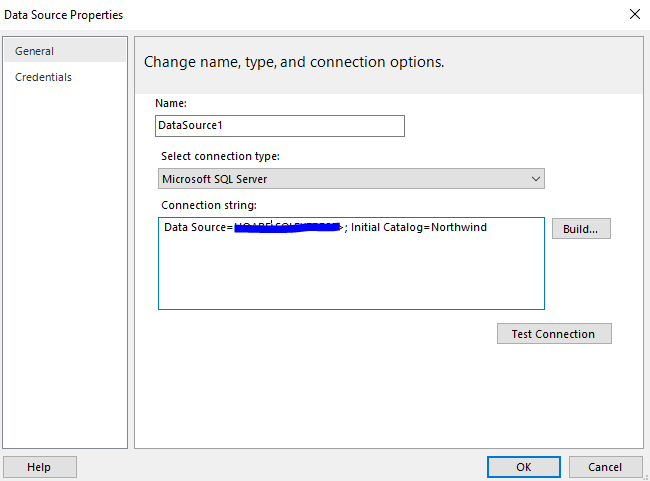
Step 4. Define required options
Next, you will need to specify the name of the data source, the connection type, and the connection string (depending upon the connection type). The default name will be DataSource1. The connection type in our case is Microsoft SQL Server. The connection string format depends on the connection type. To see different formats for connection strings, take a look at the official Microsoft documentation available here.
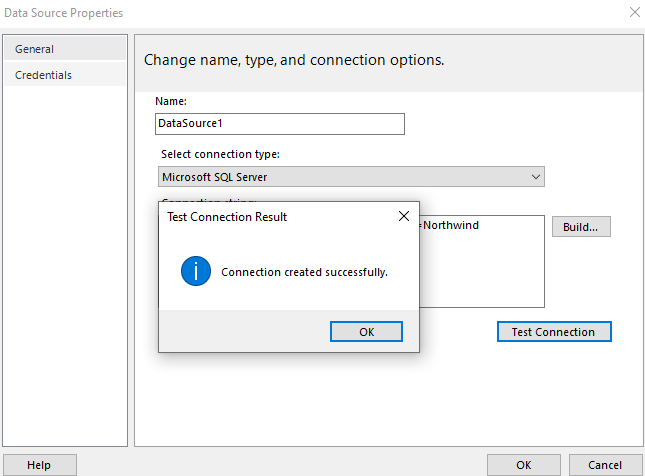
Step 5. Test your connection
Finally, to see if your connection is successful, click the Test Connection button. If the Power BI Report Builder manages to establish a connection with your SQL Server instance, you will see the message “Connection Created Successfully” as shown below:
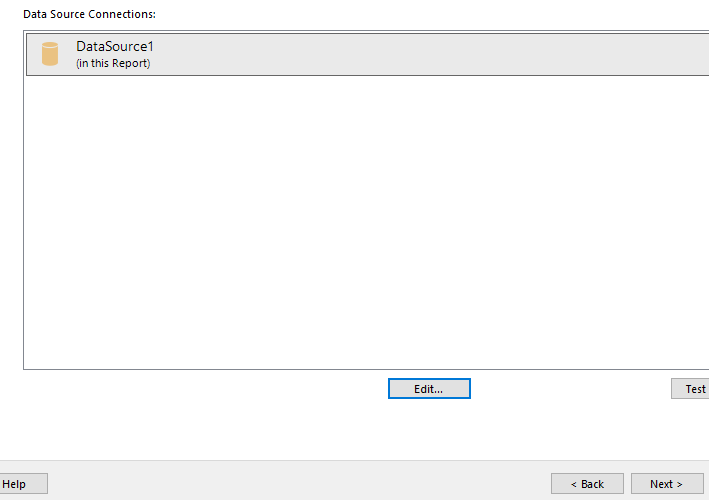
Once you have added a data source to your paginated report, you will see that it appears in the list of Data Source Connections window as shown below. Click the Next button on the following window.
Step 6. Choose database tables
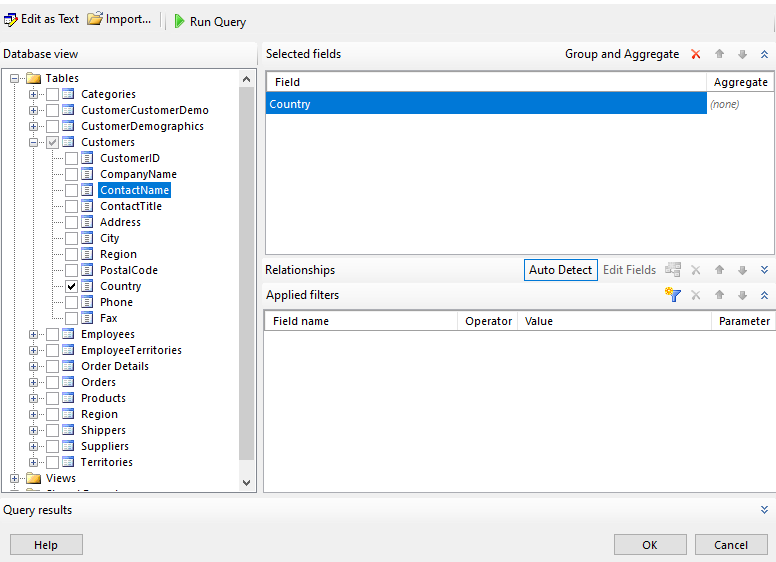
In the query designer window, you can define the SQL query that will be used to populate your paginated report. In the left section in the following window, you can see all the tables in your Nordwind database. Click the + sign to open the details including column names in each table.
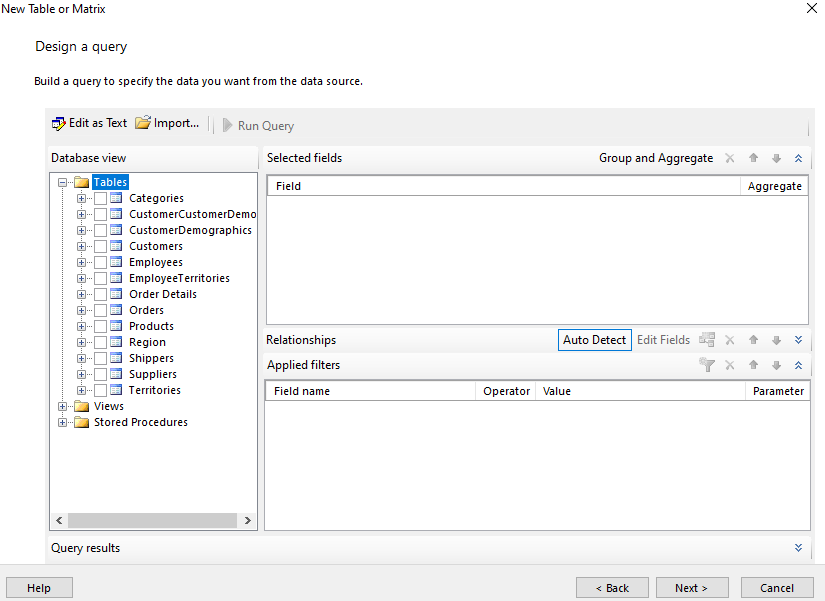
You will create a paginated report that displays information from the CompanyName, ContactName, City, Country, and Postal Code columns from the Customer table of your Northwind database. Select these columns and then click the Run Query button from the top of your query designer window as shown below:
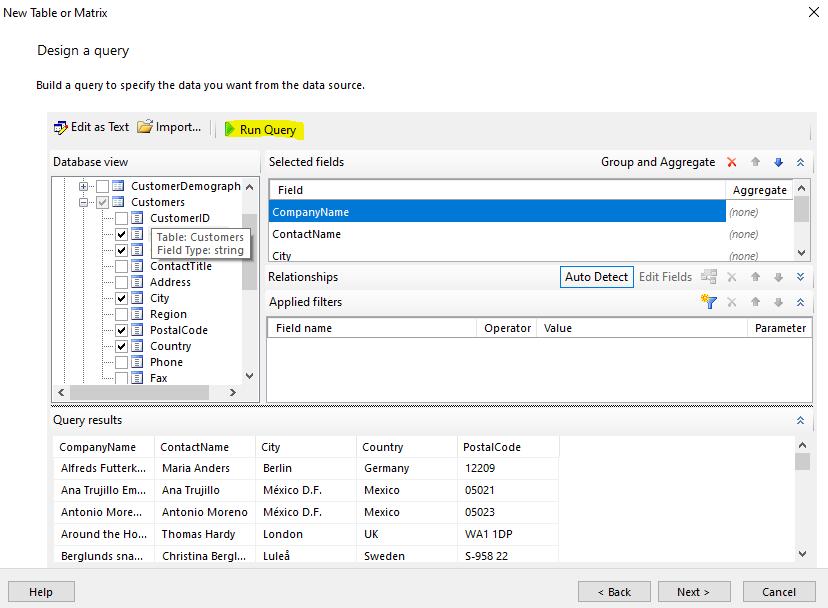
In the above screen, you can see the records retrieved by your query. Click Next.
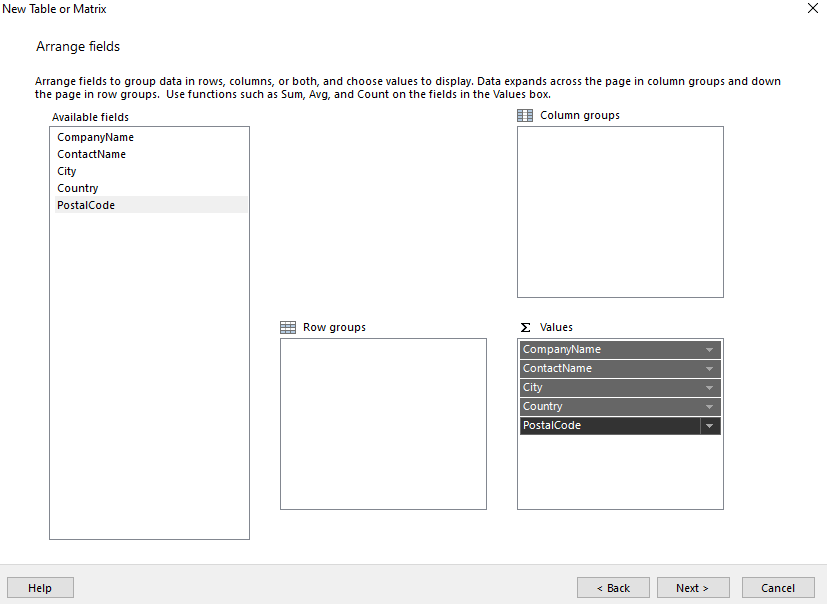
You will see the following screen. If you want to aggregate data by rows or columns, you can add the corresponding rows and columns in the Rows groups and Column groups panes on the following window. We will simply drag all the column names to the Values pane as shown in the screenshot below. Click Next.
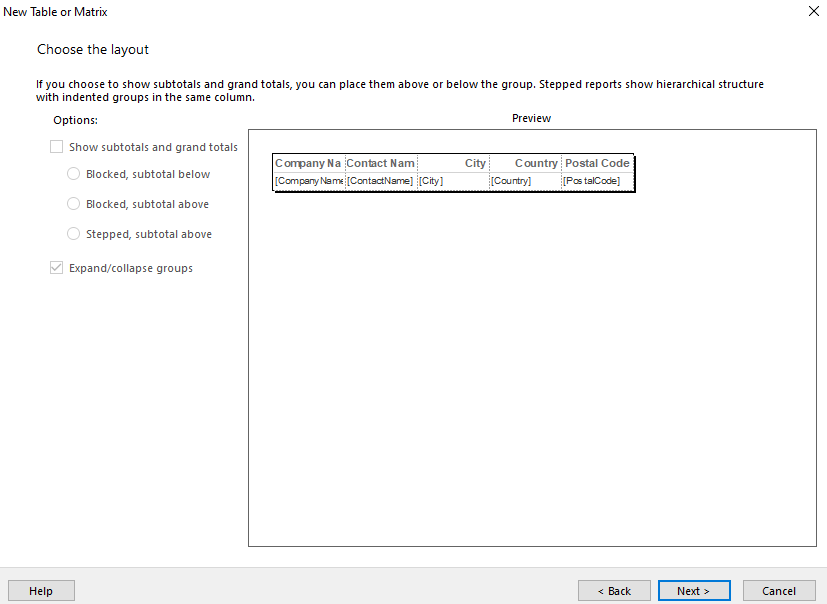
The following screen shows the preview of your paginated report. You can change the layout if you want. Click the Next button again.
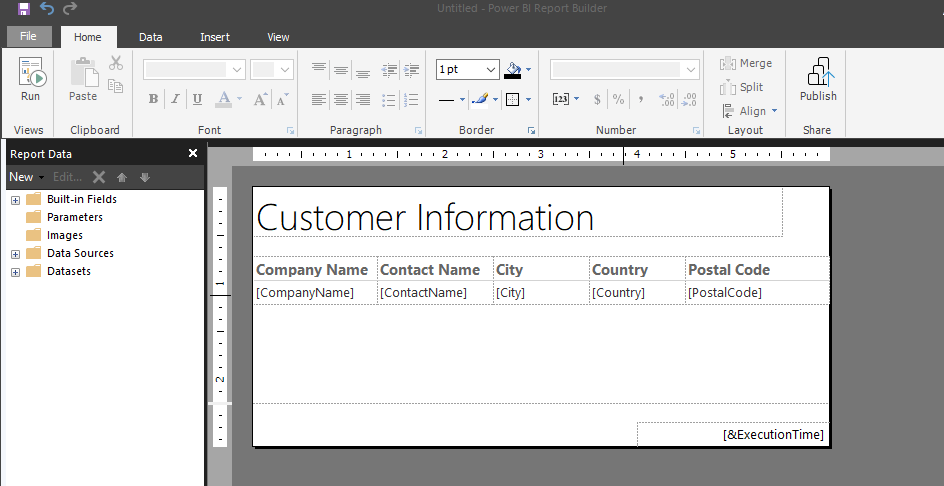
The final preview of your paginated report is displayed in the following screenshot.
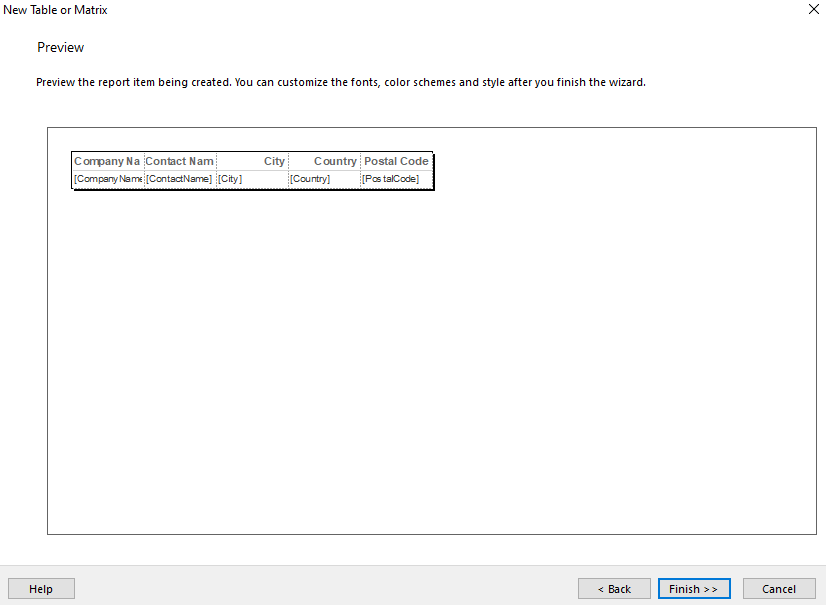
Once you click Finish, you will see the following window.
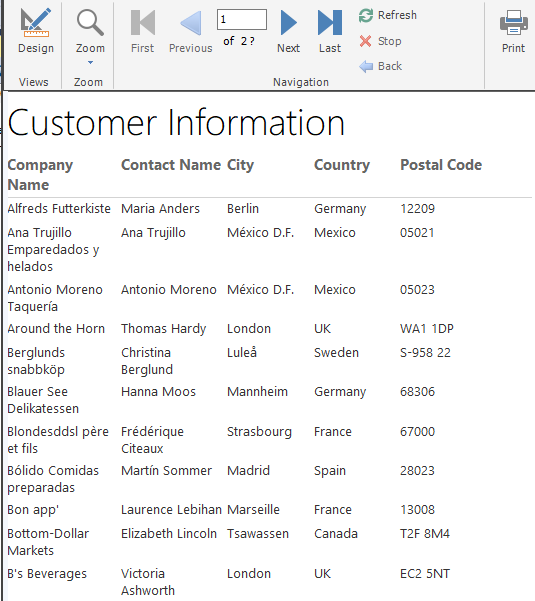
Let’s click the Run button and see how your report looks by default. Once you do so, you will see the following screen. By default, your report contains two pages. You can move to the next page by clicking the right or left arrow from the top menu.
Get Default Paginated Report with Power BI Report Builder
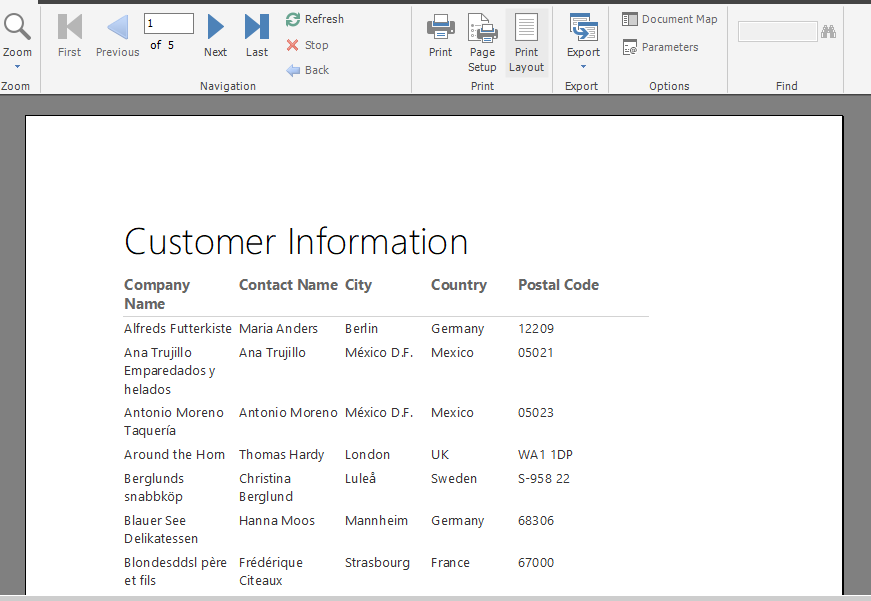
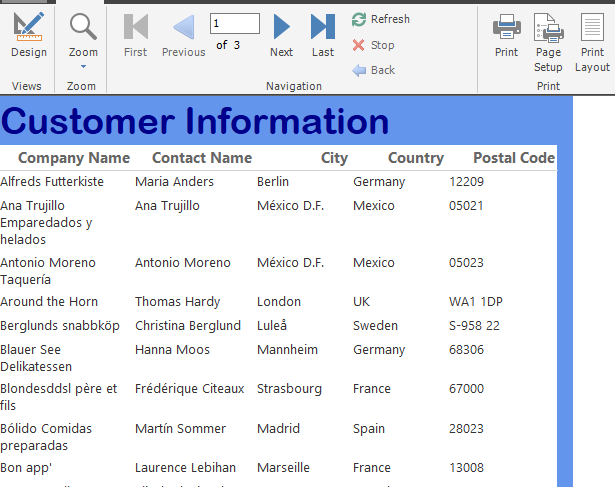
You can also see how your report will look like in the printed form. To do so, select the Print Layout option from the top menu. You can now see that in print layout your report consists of 5 pages.
Formatting the Paginated Report
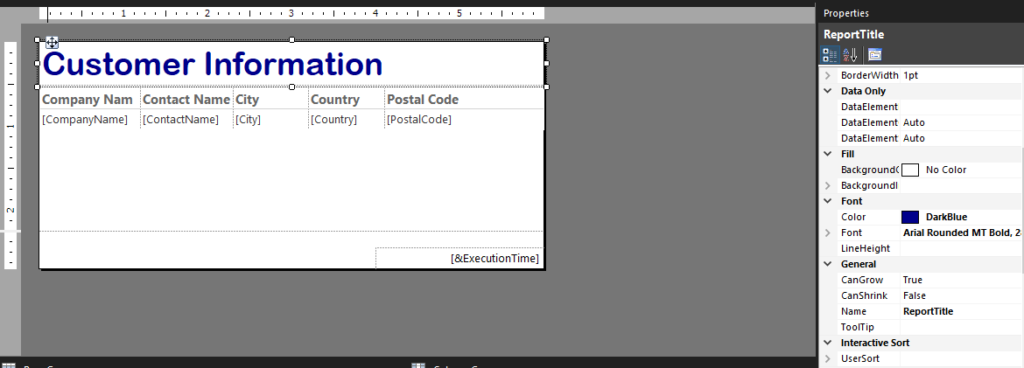
You can format a paginated report in the Power BI Report builder tool by clicking the View option in the top menu and then by ticking the checkbox for Properties as shown below.
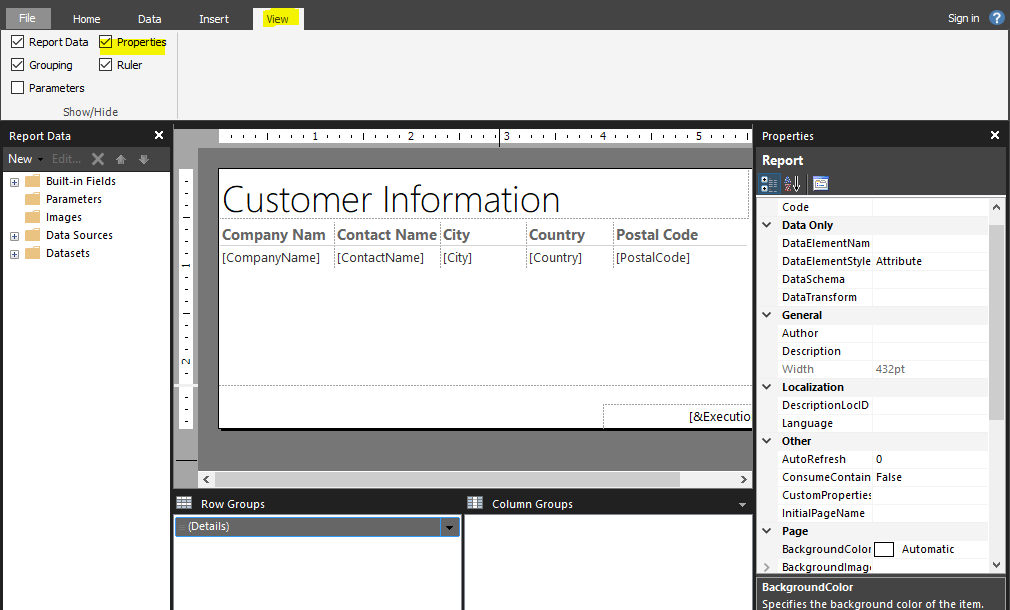
In the Properties window, you can change color, font shape, size, and other options for your report.
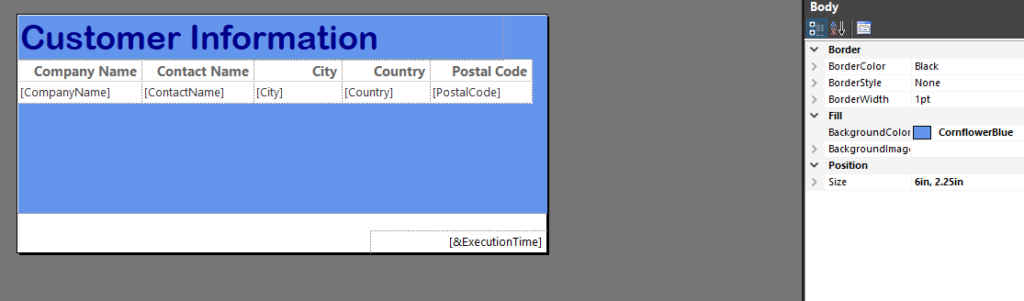
Once you have formatted your report, you can again run the report and see how it will look in real time.
Parameters for Filtering Data in Paginated Report
Power BI Report Builder allows you to filter data using Parameters. In this section, you will see how to define a parameter that allows you to filter records by country names.
You can create a parameter using an existing dataset or you can create a new dataset that will be used to populate your parameter values. In this section, we will populate our parameter using values from a dataset.
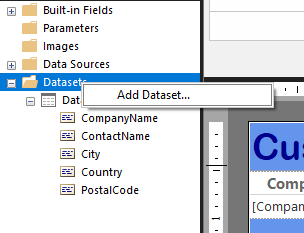
Click the Datasets folder on the left pane and then click the Add Dataset option as shown below:
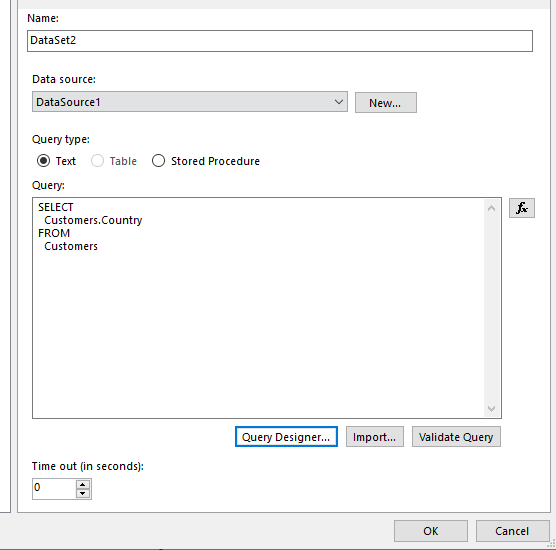
Select the query that will populate our parameter values. We want our parameter to contain the list of all countries from the Customer table. Hence, we add the Country column to our query designer and then click the OK button.
The following screenshot shows the query that will be used to populate the parameter values. Click the OK button:
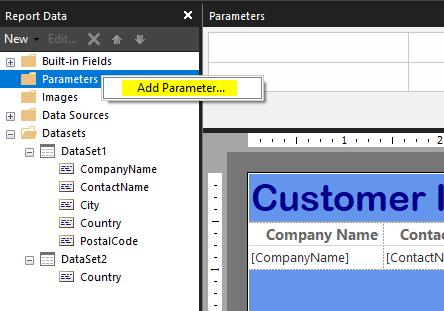
The next step is to add a parameter itself. To do so, right-click the Parameters folder and then select the Add Parameter option as shown below:
In the Name field, enter the name of your parameter, and in the Prompt field add the text that will be displayed on your report for selecting the country name.
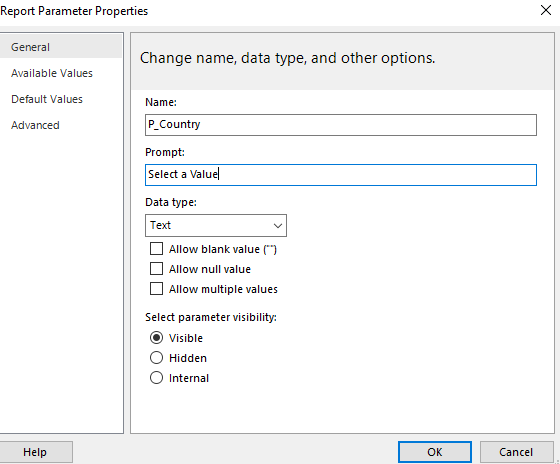
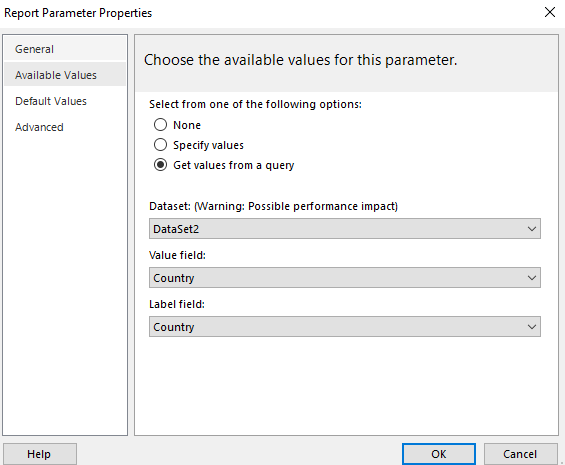
To select the data source for your parameter, select the Available Values option on the left pane. Select the radio button for Get Values from a query. In the Dataset field, enter the name of your newly created data source. In the Value and Label fields, select Country.
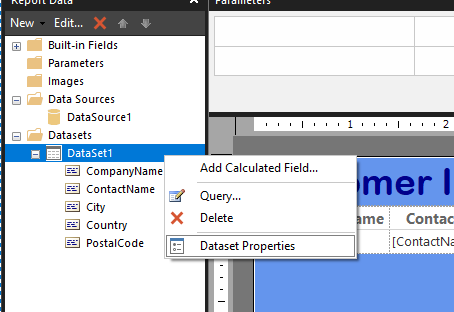
The last step is to add this parameter to your Dataset that is used to display your report. To do so, right-click Dataset1 and then Dataset Properties as shown below:
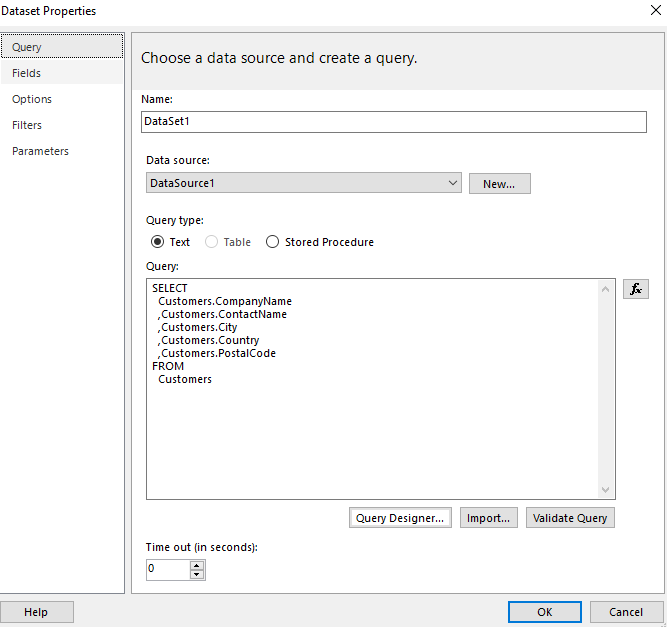
The query designer will open. By default, the SELECT query selects the 5 columns without any filter as shown below.
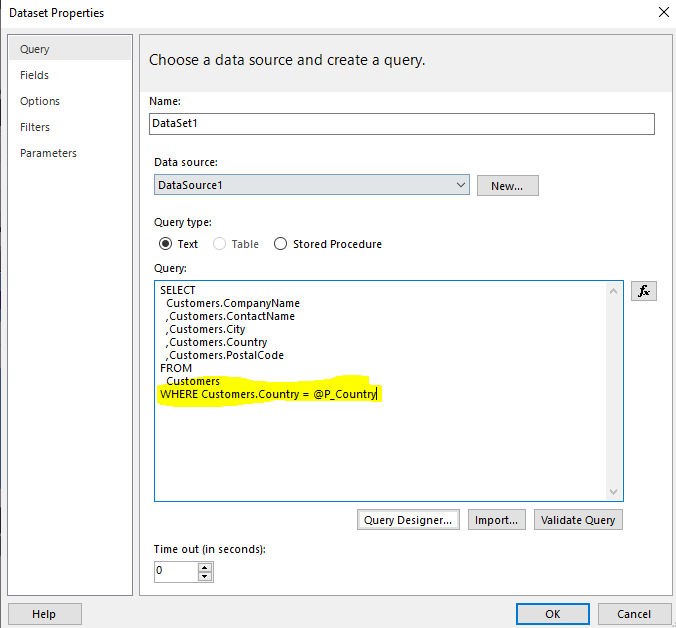
You want to filter records based on the values selected with the P_Country parameter that you defined earlier in this section. To do so, you have to modify your query and add a WHERE clause which filters those records where the Customers.Country column has values equal to the value specified by the P_Country parameter. The following screenshot shows your edited query:
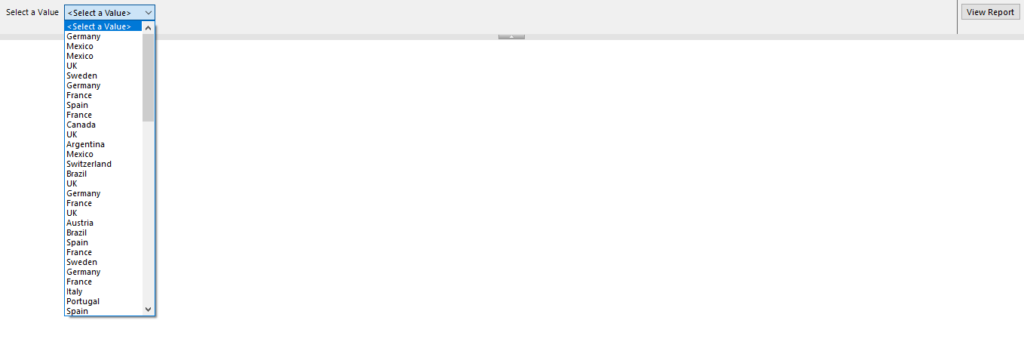
Now if you run your report, you will see a dropdown list Select a Value. Select any country name and then click the View Report button as shown below.
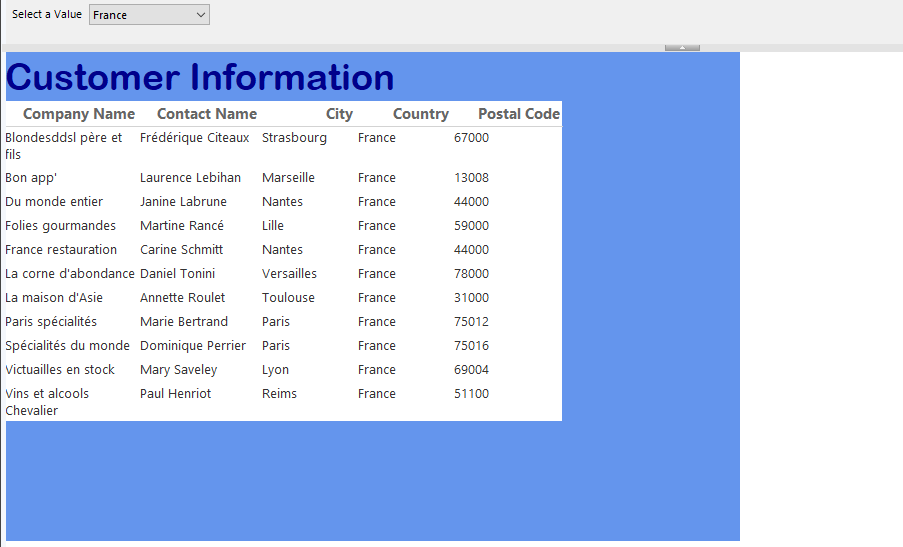
If you select France, you will only see those records where the Country name is France, as shown below:
Publishing Paginated Report in Power BI
Once you have created your paginated report, you can publish it via Power BI Services. You will need a Power BI premium account for that.
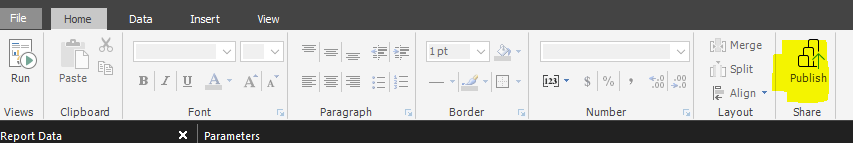
To publish your report, click the Publish option from the top menu as shown below:
The following screen will appear. Here, enter the name of your report and then click Publish.
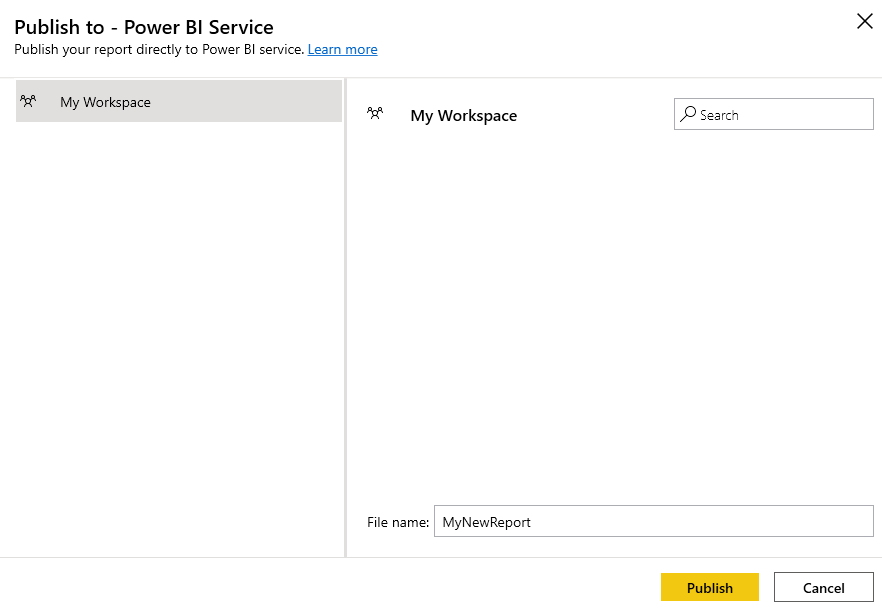
If you are logged into Power BI services as a premium user, your report will be published in your default workspace. You can then share your paginated report with your team, customers, and other stakeholders.
Tags: paginated report, power bi, power bi features, power bi reports Last modified: May 16, 2023