
Oracle Autonomous Data Warehouse (ADW) is a fully managed and high-performance solution, turned and optimized for Data Warehouse workload. It means you don’t need to take more effort and resources (DBA role) to manage the database and optimize the workload.
Power BI Desktop is a business analytics service by Microsoft. It offers interactive visualizations and business intelligence capabilities with a simple interface, letting the end-users create reports and dashboards.
The current article describes the process of creating a Sales Analysis with Power BI Desktop and data hosted in Oracle Autonomous Data Warehouse.
Table of contents
- What is Power BI?
- What is Oracle ADW?
- Prerequisites
- Create an ADW connection in Power BI Desktop
- Create the Time dataset in Power BI
- Create measures in a Power BI dataset
- Build the Sales Analysis
- Conclusion
What is Power BI?
Power BI is Microsoft’s online service that allows you to create and share dashboards and reports with anyone. It can be used by anyone to create their own dashboards or reports, and they can be shared with others.
You can use any type of data source in Power BI. Data sources include data from the cloud (SQL Server, Oracle Autonomous Data Warehouse, Azure SQL Database, Amazon Redshift, and others), on-premises databases (SQL Server, Oracle, MySQL, and others), Microsoft Excel files, CSV files, and even tables in other applications.
What is Oracle ADW?
Oracle Autonomous Data Warehouse is a fully managed database that is optimized for data warehousing workloads. With it, you can do your data warehousing with the market leading performance of Oracle Database.
CloudStore is the only complete, native cloud data warehouse that delivers a completely new, comprehensive cloud experience. It’s easy to use, fast and elastic.
Prerequisites
Before we start the process, you need to make sure that you have the necessary equipment:
- Download and install the latest version of Power BI Desktop – follow up the system requirement and instruction before installing the application.
- Install the Instant Oracle Database Client, version 12.1.0.2 or higher on the Power BI environment.
- Provision ADW database instance and download ADW Wallet file, then unzip the ADW wallet file to the secured folder.
- Download the sample file and load its data into your ADW database instance.
Create an ADW connection in Power BI Desktop
You cannot create a connection to ADW in Power BI Desktop directly. Instead, you must create a system TNS_ADMIN variable in Windows. This variable points to the secured folder with the ADW wallet file.
Press Win+R to open the Run dialog box and enter the following command:
rundll32.exe sysdm.cpl,EditEnvironmentVariablesThe Environment Variables window appears immediately. Click New to create the TNS_ADMIN variable if it does not exist:
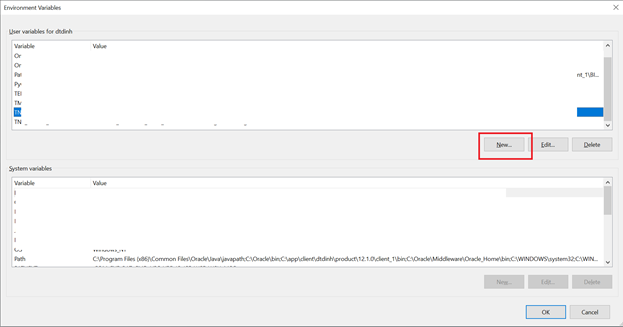
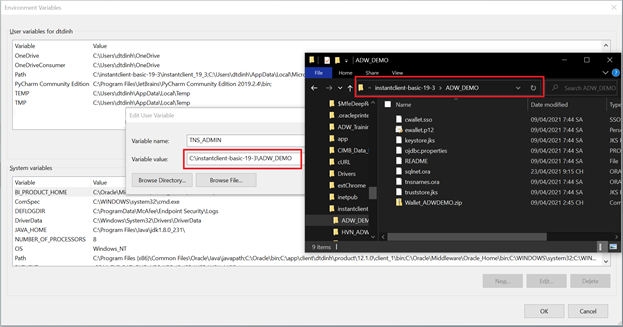
- Enter the variable name: TNS_ADMIN
- Enter the variable value: absolute the path to the secured folder where unzipped wallet file is stored
- Click OK
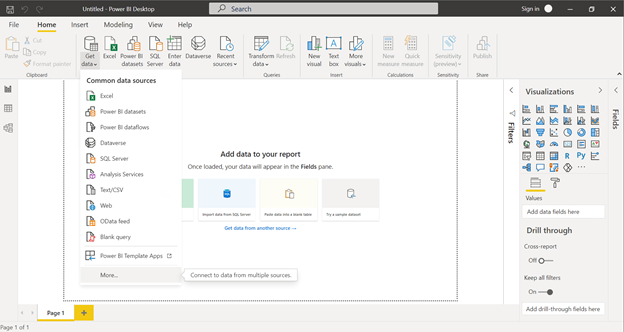
Now you need to reboot the computer to make sure that the system variable works. When done, open Power BI Desktop and click Get Data:
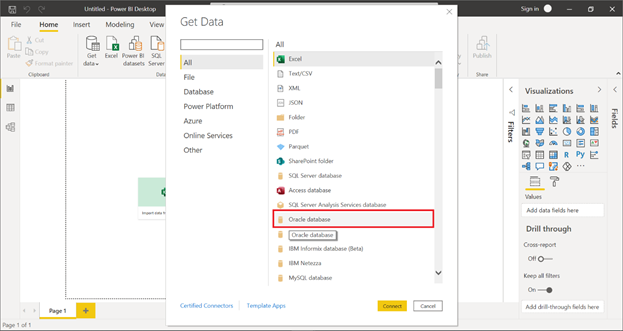
Select Oracle Database
- Enter the service name. You get the ADW service name from the tsnnames.ora file in that secured folder where you store the unzipped ADW wallet file.
- Enter the adwdemo_high service.
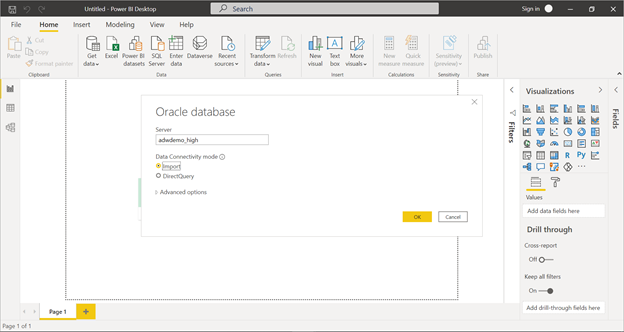
When you connect to the data source such as SQL Server, Oracle, etc., you need to consider the Data Connectivity mode.
- Import: The selected tables and columns are imported into Power BI Desktop. It means that both the metadata and data are imported into Power BI Desktop during the initial phase. When you create or interact with the visualization, Power BI Desktop uses imported data. You must refresh it to get the latest version from the underlying data source. This option is suitable for small datasets.
- Direct Query: No data is imported or copied into Power BI Desktop. When you create or interact with a visualization, Power BI Desktop queries the underlying data source. Thus, you will always view the current data. This option is suitable for large datasets.
You might also be required to enter the ADW database user name and password.
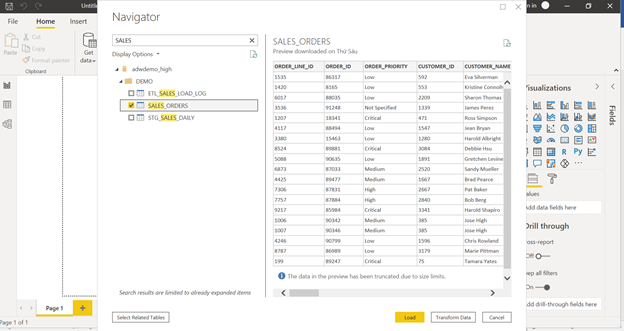
In the Navigator window, choose the database schema > DEMO > filter the SALES table > SALES_ORDERS table
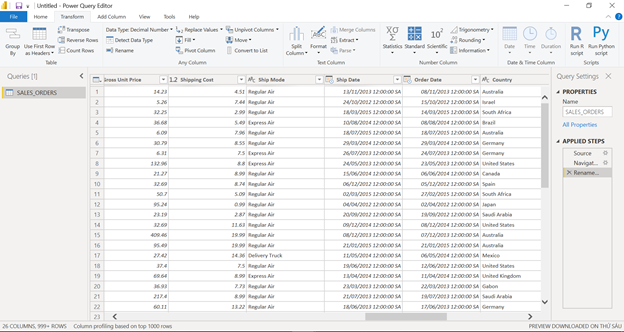
Click Transform Data. Here, you do the transformation in the dataset imported, such as renaming, changing data type, etc.
- If you see the ABC icon, it means the column data type is Text
- If you see the Calendar icon, the column data type is Date or Date/Time
- If you see the 1.2 icon, the column data type is Number
- To rename the column, right-click on that column > Rename
- To change the data type, right-click on that column > Change Type > select the necessary data type, e.g., Text
- Click Close & Apply
Create the Time dataset in Power BI
The Time dataset is essential when you want to analyze the time series, such as Month over Month, Month to Date, Quarter over Quarter, etc. We are going to build the Time dataset from SALES_ORDERS loaded before, using the DAX function.
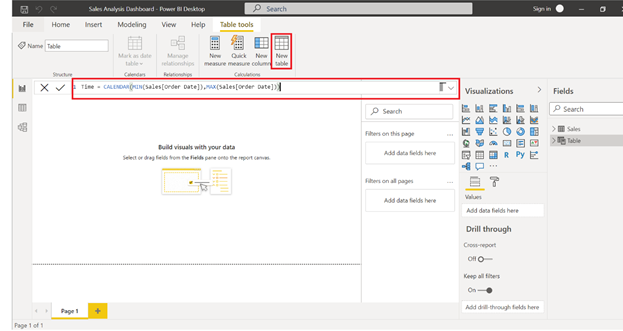
- Right-click on the SALES_ORDERS dataset in Fields on the right > Rename > Sales
- Click on the Sales dataset > New Table in the Table Format menu > enter the following DAX expression
Time = CALENDAR(MIN(Sales[Order Date]),MAX(Sales[Order Date]))This expression creates the Calendar time based on the Order Date column of the Sales dataset. Click Enter.
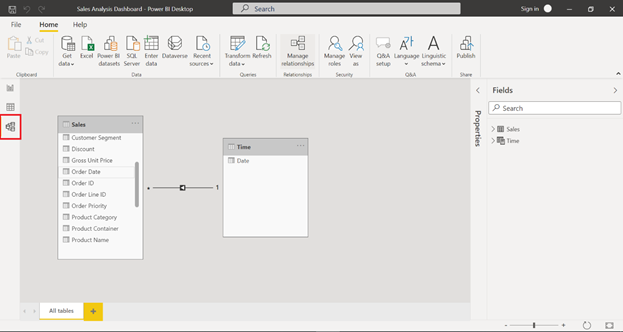
Click on the Model tab > Drag the Order Date of Sales to the Date of Time dataset to create a relationship:
Create measures in a Power BI dataset
After creating the connection to ADW, you can create reports based on the imported datasets. Pay attention to the Data Connectivity mode used during the process of creating the connection, as both metadata and data were imported into Power BI Desktop.
Now, let us compare Revenue of Year to Date to Revenue of Last Year to Date. For that, we need to create new measures using the DAX functions in your dataset.
Power BI measure 1: Total Sales
Right-click on the Sales dataset > New measure and enter the DAX expression:
Total Sales = SUM(Sales[Sales])Power BI measure 2: Total Sales YTD
Right-click on the Sales dataset > New measure. You will use the TOTALYTD DAX function and the Time dataset to calculate Total Sales from January to the current period. The DAX expression is below:
Total Sales YTD = TOTALYTD([Total Sales], 'Time'[Date].[Date])Power BI measure 3: Total Sales Last YTD
Right-click on the Sales dataset > New measure. We’ll use the CALCULATE and SAMPERIODLASTYEAR DAX functions and the Time dataset to calculate Total Sales from January to the current period. The DAX expression:
Total Sales Last YTD = CALCULATE([Total Sales YTD],SAMEPERIODLASTYEAR('Time'[Date].[Date]))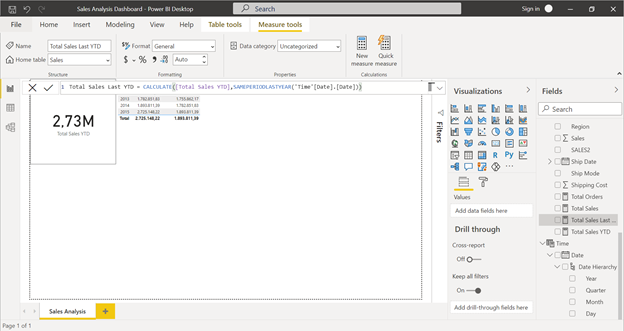
Power BI measure 4: Total Orders
DAX expression:
Total Orders = DISTINCTCOUNT(Sales[Order ID])Power BI measure 5: Total Profit
DAX expression:
Total Profit = SUM(Sales[Profit])Power BI measure 6: % Sales YTD
We are going to calculate % between the Total Sales YTD and Total Sales Last YTD
DAX expression:
% Sales YTD = IF([Total Sales Last YTD]>0,(([Total Sales YTD] - [Total Sales Last YTD]) / [Total Sales Last YTD] * 100.00),0)Build the Sales Analysis
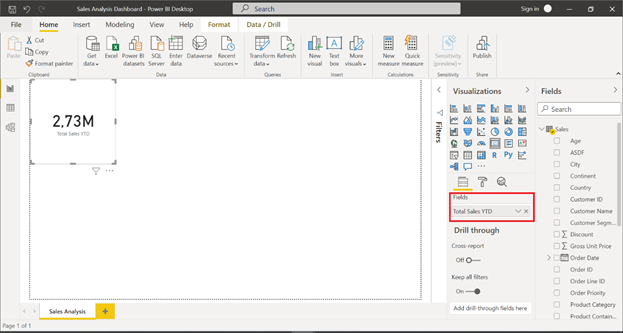
1. Total Sales Year to Date
The report will display the Total Sales YTD of the Current Period:
- Chart Type: Card
- Choose the Card visualization type in the Visualization panel
- Drag and drop Total Sales YTD to the Add data field here
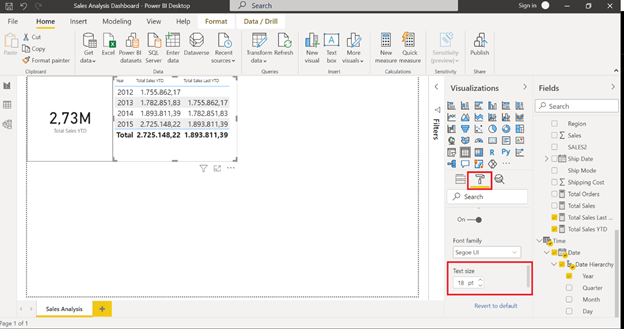
2. Total Sales YTD vs Total Sales Last YTD
The report displays the comparison between Total Sales YTD and Total Sales Last YTD by Year
- Chart Type: Table chart
- Choose the Table chart type in the Visualization panel
- Expand the Time dataset and select Year in the hierarchy
- Choose both Total Sales YTD and Total Sales Last YTD
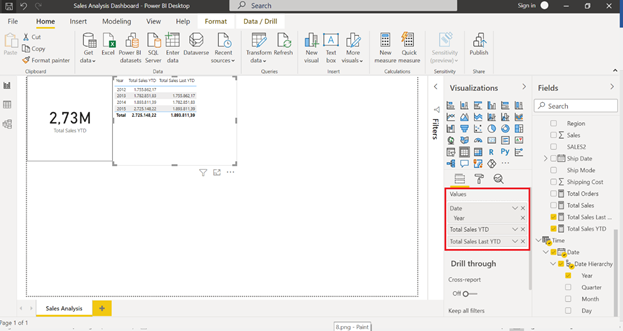
Go to Format and change the text size to 18pt
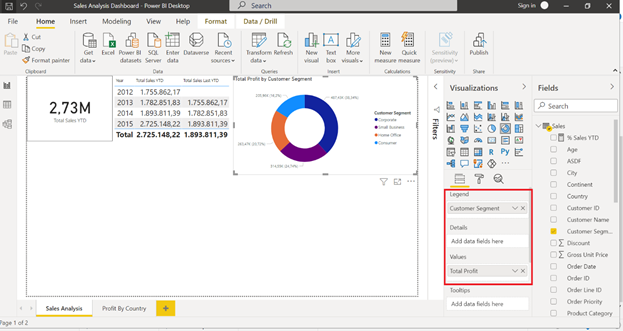
3. Profit By Customer Segment
This report will display Total Profit by Customer Segment
- Chart Type: Donut chart
- Title Name: Profit By Customer Segment
- Choose Total Profit and Customer Segment
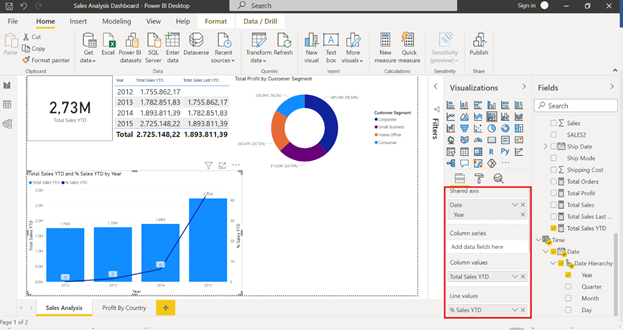
4. % Sales YTD change
This report will display % Sales Change (Up or Down) between Total Sales YTD and Total Sales Last YTD
- Chart Type: Line and Stacked Bar chart
- Choose Line and Stacked Column chart in Visualizations
- Choose % Sales YTD, Total Sales YTD, and Year of Time datasets
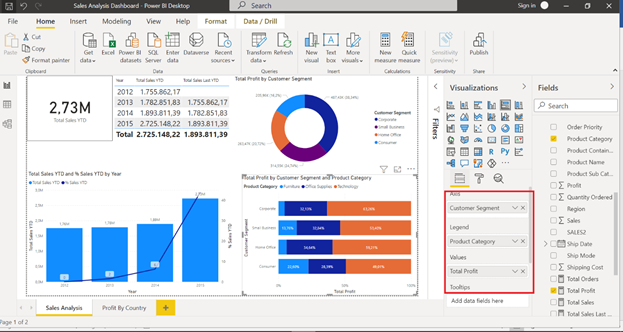
5. Total Profit By Customer Segment and Product Category
This report will display Total Profit distribution by Customer Segment and Product Category
- Chart Type: 100% Stacked Bar chart
- Choose 100% Stacked Bar chart in Visualizations
- Choose Customer Segment, Product Category, and Total Profit
- Go to Format > Data Label = On
Conclusion
Oracle Autonomous Database provides plenty of solutions to help you to leverage your performance workload. No matter if you are working with Power BI, Qlik, Tableau, or any Self-service BI tools, you can connect to the Oracle Autonomous Database and continue working on your datasets if they are migrated to Oracle Cloud.
This option also helps you save costs if you purchased Business Intelligence tools or application licenses. Just lift and shift your datasets to Oracle Autonomous by minimizing the operation effort of the database platform and infrastructure.
Read also
Formatting Data in Power BI Desktop Visualizations
How to Create Paginated Report in Power BI: Definitive Tutorial
Learn to Use Time Intelligence in Power BI
Power BI Date Table Template Tutorial
Centralized Data Modeling Using Power BI Templates
Tags: oracle, oracle autonomous database, power bi, power bi reports Last modified: October 03, 2022