
Time intelligence is a smart way of analyzing time period-based data, such as sales according to dates, using built-in time intelligence functions of Power BI. It is one of the most convenient ways because it eliminates the need to spend time on developing specialized solutions for your team.
The current article will focus on applying Time Intelligence in Power BI reports and dashboards. Additionally, it will share some professional tips.
What is Time Intelligence in Power BI?
Time intelligence in Power BI depends on at least one Date table (also known as the Date dimension from the data warehouse perspective) that is connected with other tables (mostly the central FACT table) through the date-time columns.
With a connected and marked Date Table, we can drill down and up in different time frames. For instance, we can view the sales data for a complete year and then drill down to that year’s months, weeks of each month, etc.
Another method is making use of built-in time intelligence functions in DAX language (serves to create calculated tables, columns, measures, etc. in Power BI) to see data from multiple perspectives in different time frames.
You don’t have to be a DAX language pro to use the Power BI Time Intelligence features (functions). However, some basic understanding is required.
Time intelligence helps business users to see the data trends that can help to understand the strengths and weaknesses from many points of view, including Sales.
For example, you can instantly view year-to-date sales and understand how your business is running from the beginning of the year up till now. Plus, many other functions are helping to evaluate business trends and define the best course of action promptly.
The key behind utilizing Time Intelligence in Power BI in the best way is almost always a solid, stable, and standard data model design. The required tables must be picked up, enhanced, and linked with the FACT table (a special type of table used in a data warehouse) to work with Date tables.
Using Time Intelligence in Power BI
Let us get some hands-on experience of preparing the environment to use Time Intelligence functions/features in Power BI. This article assumes that you have the Power BI Desktop installed and possess some basic understanding of its work. You can refer to the below articles for the necessary information:
In most cases, Time Intelligence is used to bring the data for the following queries:
- Total Sales
- Total Sales per Product
- This Year Sales
- Previous Year Sales
- Last Year Sales
- Year to Date Sales
- Last Year – Year to Date Sales
We can answer all these questions with Power BI reports, using Time Intelligence functions.
Understanding the Data Set for IT Sales
The Data set for the Power BI report consists of the following tables:
- IT Sale table
- Date table
One option is to start with the Date table. We assume that you have the Date generic template and you can import it into your Power BI time report straight away to begin your project.
We’d recommend you read the below article – it describes how you can create and save your Date template:
Why you should be using Date Template in Power BI
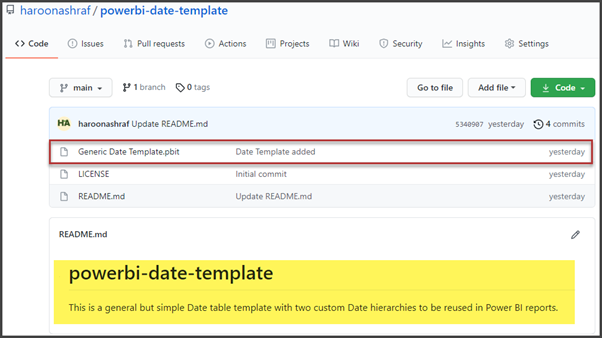
You can also download the Date template from my Github repository, but it is better to do it yourself to understand the procedure and specificities better.
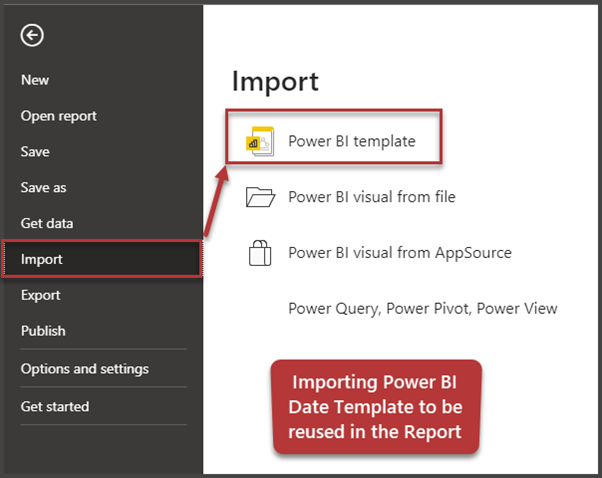
Import Power BI Date Template to start the Project
To begin our project, we are importing the Power BI Date Template. Open the Power BI Desktop and go to the File menu > Import:
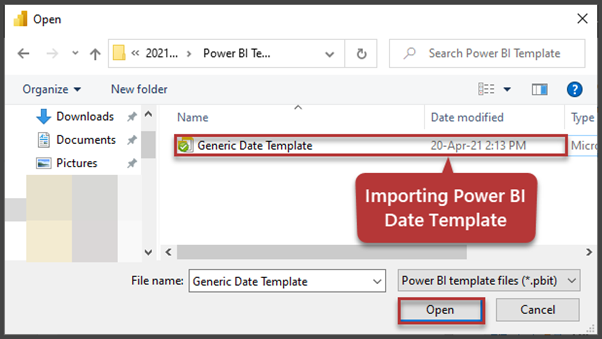
Click the stored template to open it as shown below:
You will see the following screen once the template is loaded:
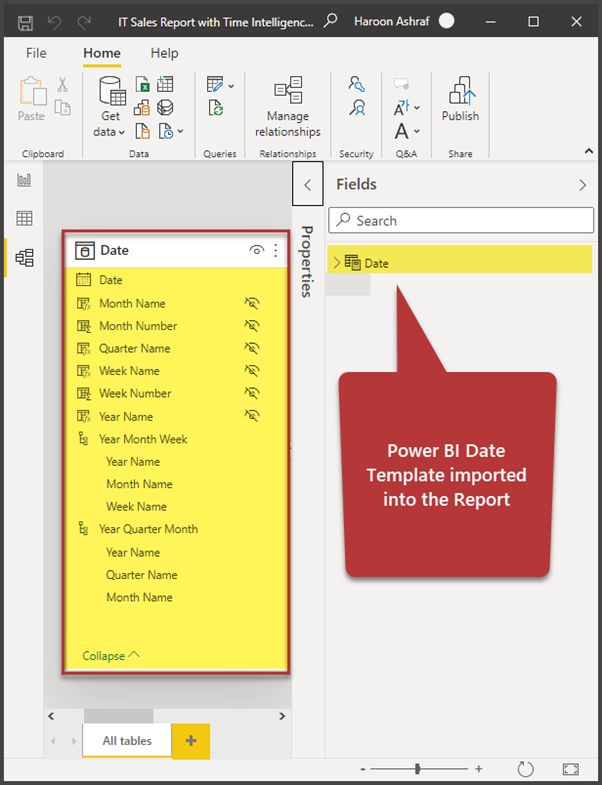
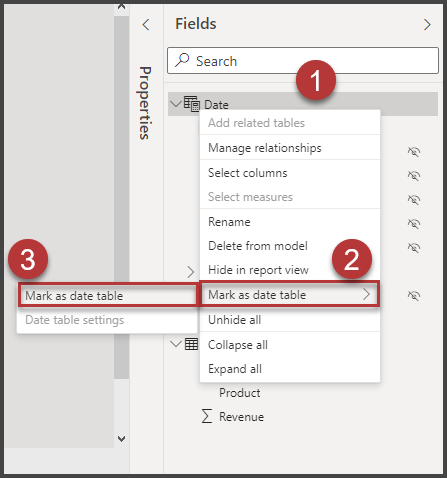
Right-click on Date in the Fields panel and select Mark as date Table > Mark as date table:
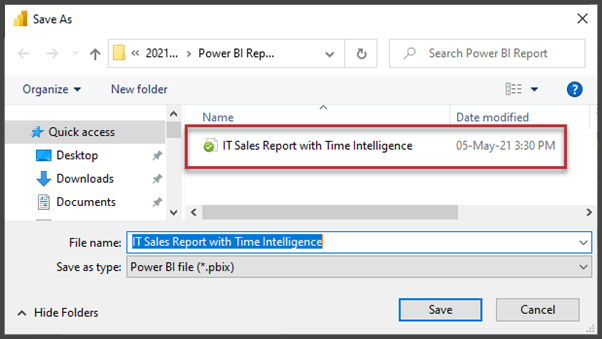
Save the report as IT Sales Report with Time Intelligence to some location that you can easily access. We’ll need it for future reference:
Create and Populate the IT Sale Table
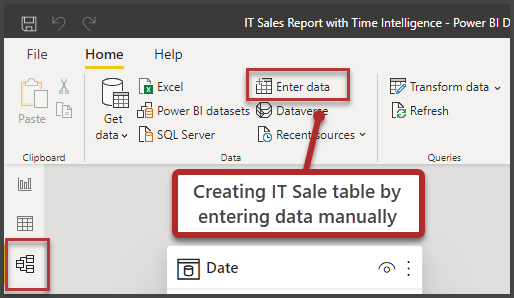
We are going to create this table manually by entering some rows into it in the Power BI report. In practice, you’d load this table from the data warehouse database.
On the Home ribbon, click Enter data:
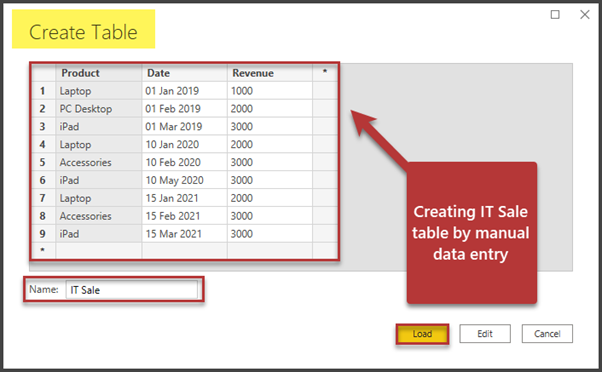
Fill the IT Sale table to add the following columns:
| Product | Date | Revenue |
| Laptop | 01 Jan 2019 | 1000 |
| PC Desktop | 01 Feb 2019 | 2000 |
| iPad | 01 Mar 2019 | 3000 |
| Laptop | 10 Jan 2020 | 2000 |
| Accessories | 10 Feb 2020 | 3000 |
| iPad | 10 May 2020 | 3000 |
| Laptop | 15 Jan 2021 | 2000 |
| Accessories | 15 Feb 2021 | 3000 |
| iPad | 15 Mar 2021 | 3000 |
Copy and paste the above table into the blank table in the Power BI report and rename it to IT Sale. Click Load:
Link Tables to form relationships
Switch to Model view and join the Date column in the IT Sale table with the Date column in the Date table to create a relationship between these two tables. This relationship qualifies you to use the Time Intelligence functions for your data:
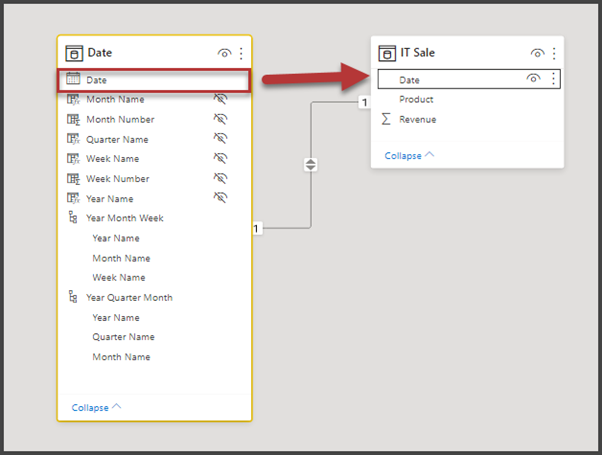
Change the tabular relationship between IT Sale and Date
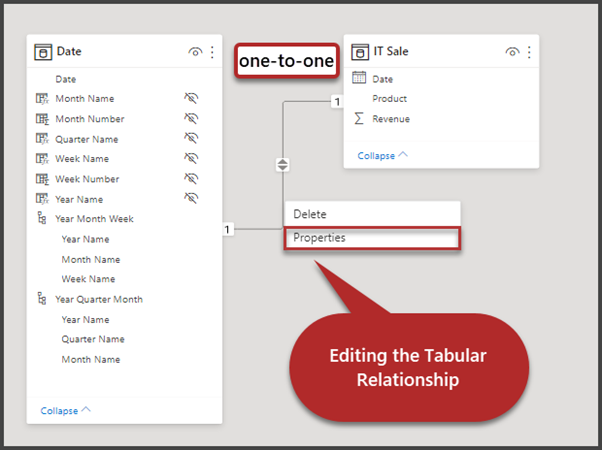
So, there is a one-to-one relationship between the two tables. However, it is highly recommended to change it to one-to-many because there may be multiple sales on the same date. The one-to-one tabular relationship can’t handle this situation.
Right-click on the active link between the two tables and click Properties:
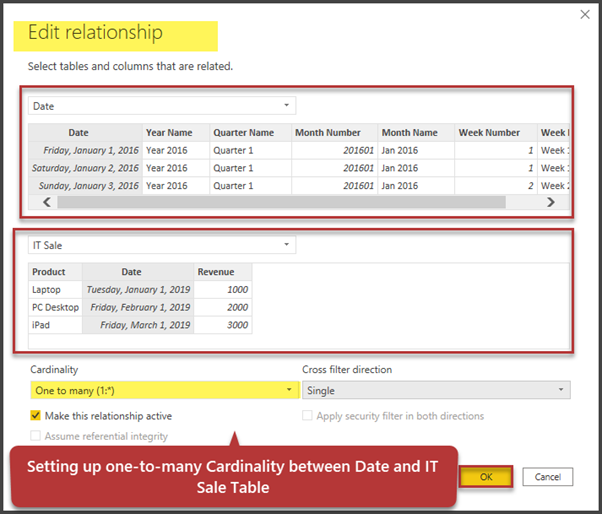
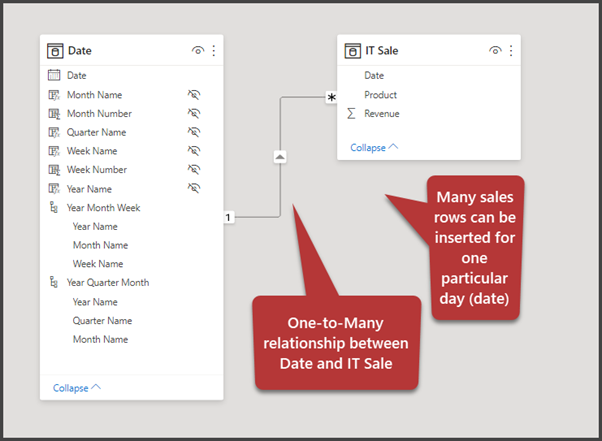
Change the Cardinality to One to many (1:*) and set the Cross filter direction to Single. Click OK. This will allow us to insert as many Sales as possible on a particular Date.
The Power BI Data Model now looks as follows:
Prepare the Total Sales Calculation
One of the first requirements is to be able to define Total Sales in the Power BI report. It is pretty easy since Power BI has already done this for us:
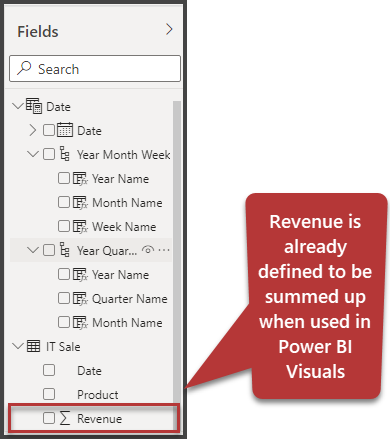
This is the default (in-built) behavior of the Power BI report – it summarizes a numeric value to be used in visuals.
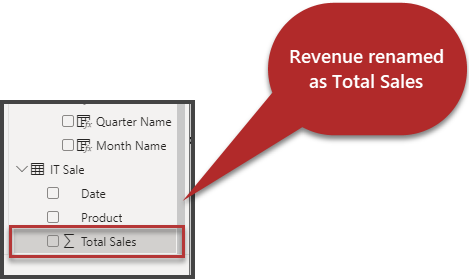
Right-click on the Revenue field and rename it to Total Sales:
Analyze Total Sales in Power BI Report
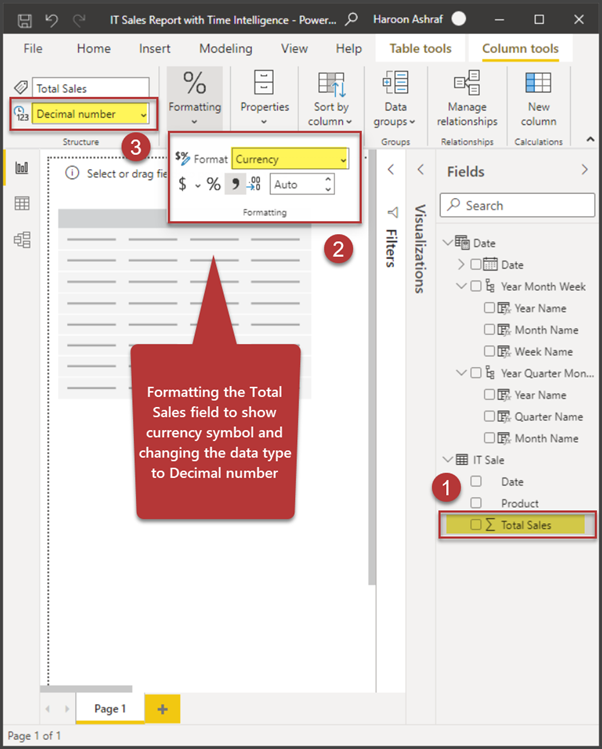
We need to make one adjustment before displaying the figure. Click the Total Sales field and change the following:
- Format should be Currency
- The data type should be Decimal
Select the Table visual from the Visualizations pane:
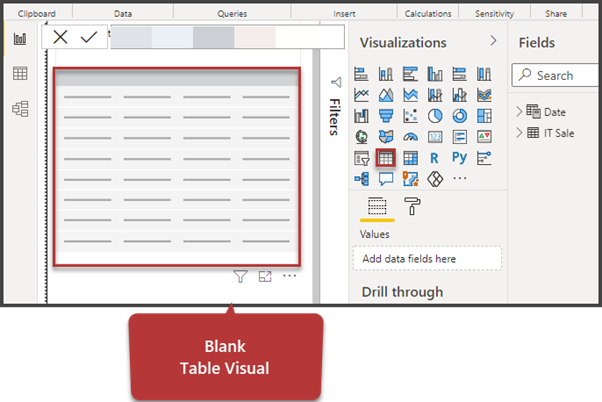
Expand the IT Sale table and select Total Sales only when the table visual is in focus.
Select the Total Sales field in the Fields pane to see the Total Sales in the Power BI designer surface (Canvas):
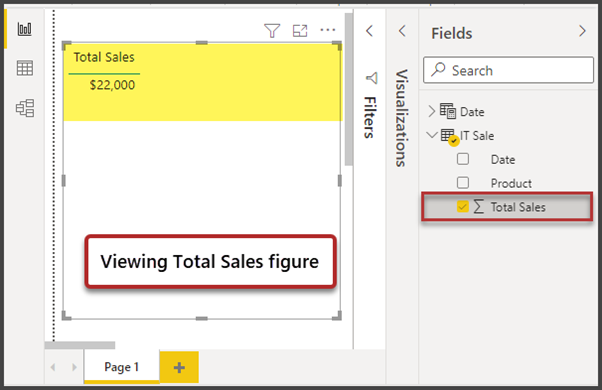
We can see that the overall sales of all the products match the amount of 22,000 dollars.
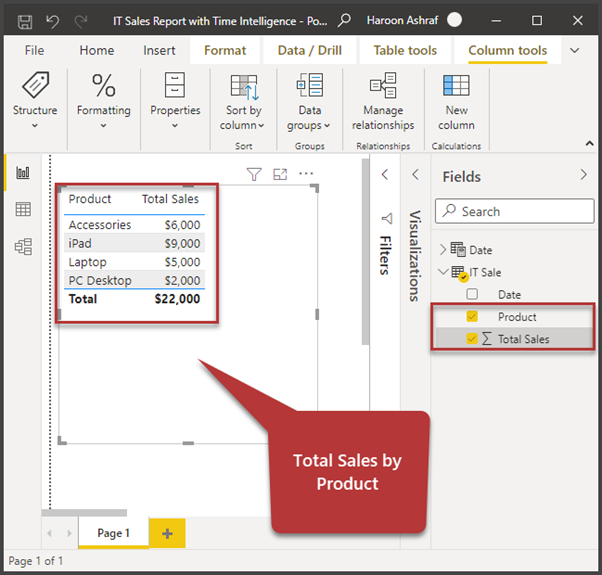
Analyze Total Sales by Product in Power BI Time Report
Next, we want to see the total sales by-product:
- Unselect the previously selected Total Sales field.
- Select Product and Total Sales in the Fields pane. They will be shown in that same Table visual as follows:
- Select stacked column chart visual to bring it onto the Canvas to view Total Sales by Product:
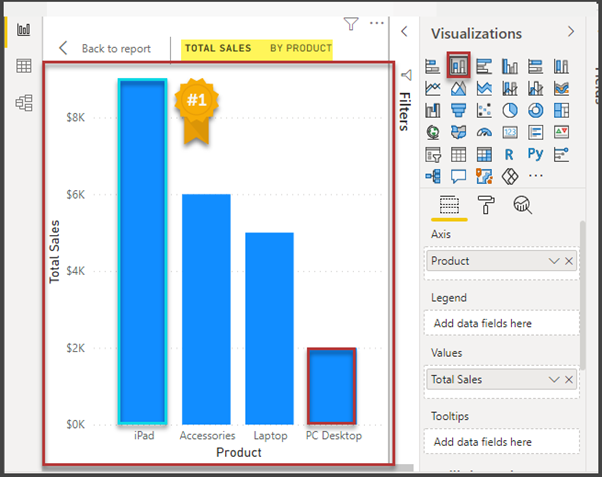
It is very easy to discover that iPad sales have gone way up as compared to other items.
Congratulations! You have successfully learned to prepare the Power BI report for Time Intelligence functions along with showing the Total Sales by Product figures.
Please stay in touch as we will use Time Intelligence functions in the next part of this article to understand better the sales of the products sliced by different but custom-made time frames.
Things to do
Please try the following things to improve your skills further:
- Try to bring in another table of customers buying these products and see if you can view Total Sales by Customer.
- Crate another Power BI time report called SQL Articles Publishing Report by adding the Article table manually based on the sample database SQLDevBlog5 mentioned in the article. Then join the Published column with the Date table and create the one-to-many relationship.
- Refer to the article and try creating another Power BI time report based on the Student table of TechnicalTraining sample database. Build the one-to-many relationship between the Date column of the Date table and the RegistrationDate column of the Article table. See if you can find Total Articles.