Customer Segmentation Analysis is a popular business issue, especially in Retail domain, where companies need to discover the data and group customers based on customer attributes, such demographics and customer transactions. The results of customer segmentation analysis let the retailers understand the customers’ behavior and create effective campaigns.
This tutorial will describe the usage of Data Flow in Oracle Analytics for resolving the Customer Segmentation problem (the data is hosted in Autonomous Data Warehouse).
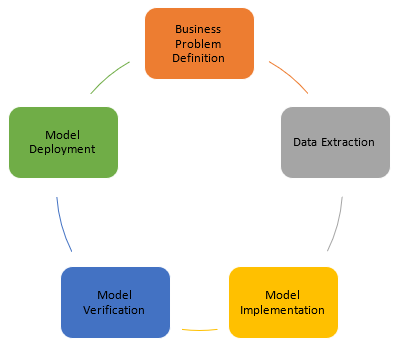
Project Lifecycle Phases
Most of data science projects involve five stages of Project Lifecycle Development:
- Business Problem Definition. Define what business problems you need to resolve and start to identify the data required: the data sources, attributes, and how the data should be transformed.
- Data Extraction. Define the processes to extract data.
- Model Implementation. Define the algorithms and models necessary to resolve the business problems based on training the dataset. In this stage, you may need to run various algorithms and models to find out those ones returning the most accurate result.
- Model verification. Apply the algorithms and models to your testing dataset.
- Model Deployment. After model verification, deploy the model and run it on the real dataset.
Repeat these stages until you resolve business problems completely.
Prerequisites
- Download and install the latest version of Oracle Analytics Desktop (currently it is version 6.0)
- Provision Autonomous Data Warehouse database
Data Source Overview
Click here to download a sample dataset. We are going to work on E-commerce customer dataset that lists purchases made by 4000 customers. It has 8 columns: InvoiceNo, StockCode, Description, Quantity, InvoiceDate, UnitPrice, CustomerID, Country.
Bonus: Learn how to bill a client efficiently using these tips.
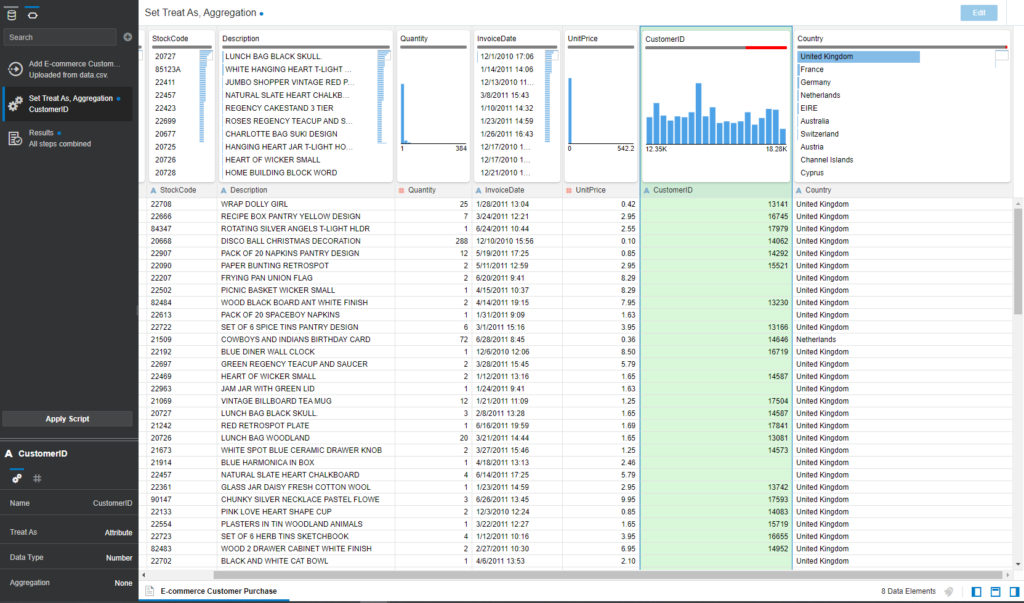
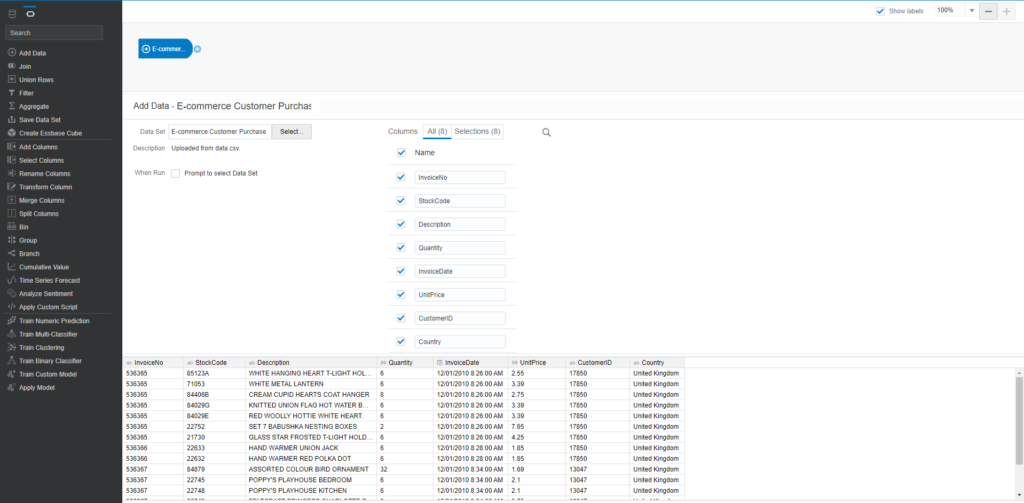
Open the Oracle Analytics Desktop and click Add to import the dataset:
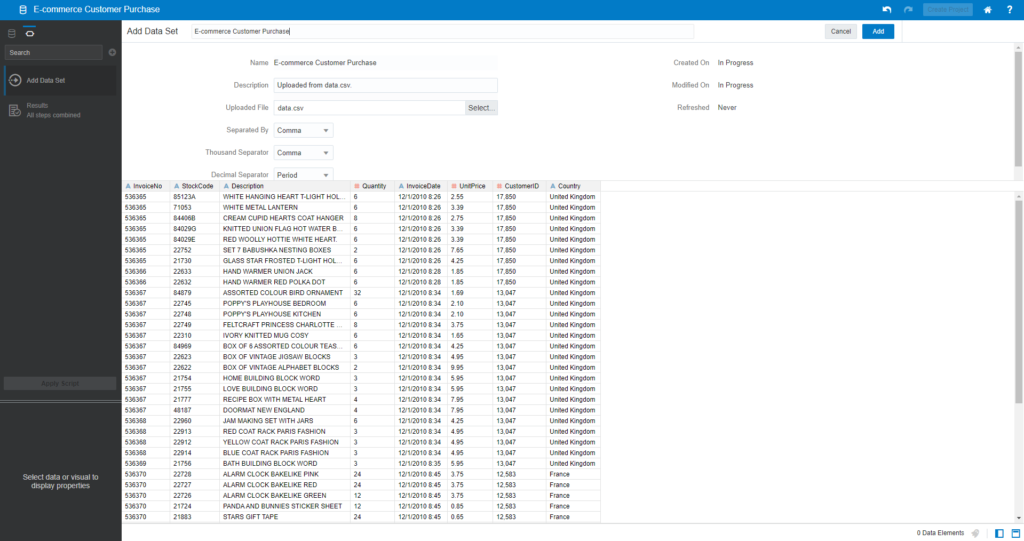
You can see some summary of profiling data for 8 fields above. There is notice on CustomerID – a lot of Invoices are missing the Customer ID (29%), and Country values are also missing around 1%.
Data Preparation
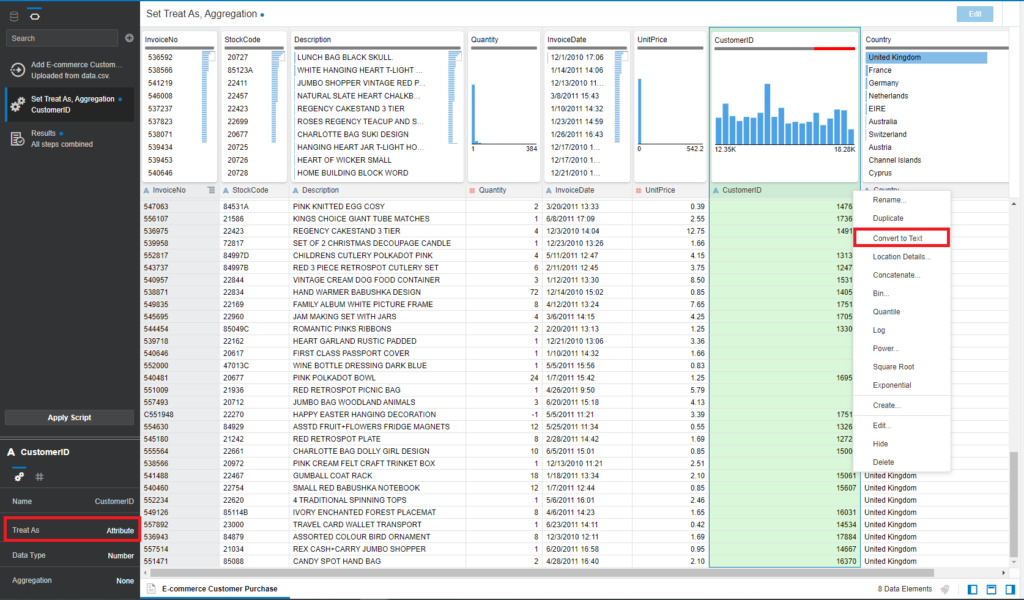
- Convert CustomerID to the Text data type and Treat as > Attribute. Click on the Menu icon of the CustomerID field and Convert to Text:
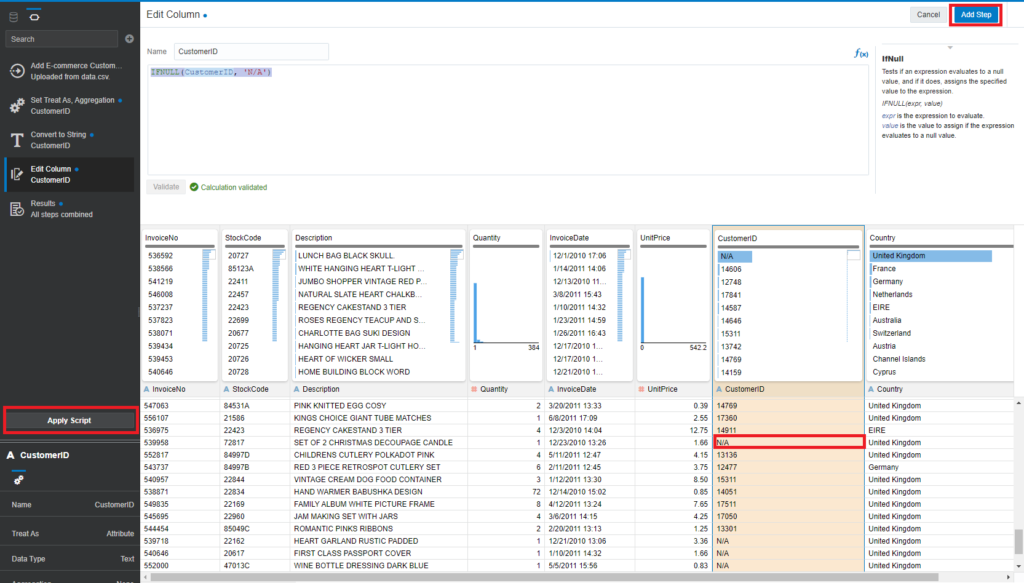
- Continue clicking on Menu of CustomerID > Edit. You need to replace any missing CustomerID with the N/A value.
- Enter expression: IFNULL(CustomerID, ‘N/A’)
- Click Add Step and Apply Script
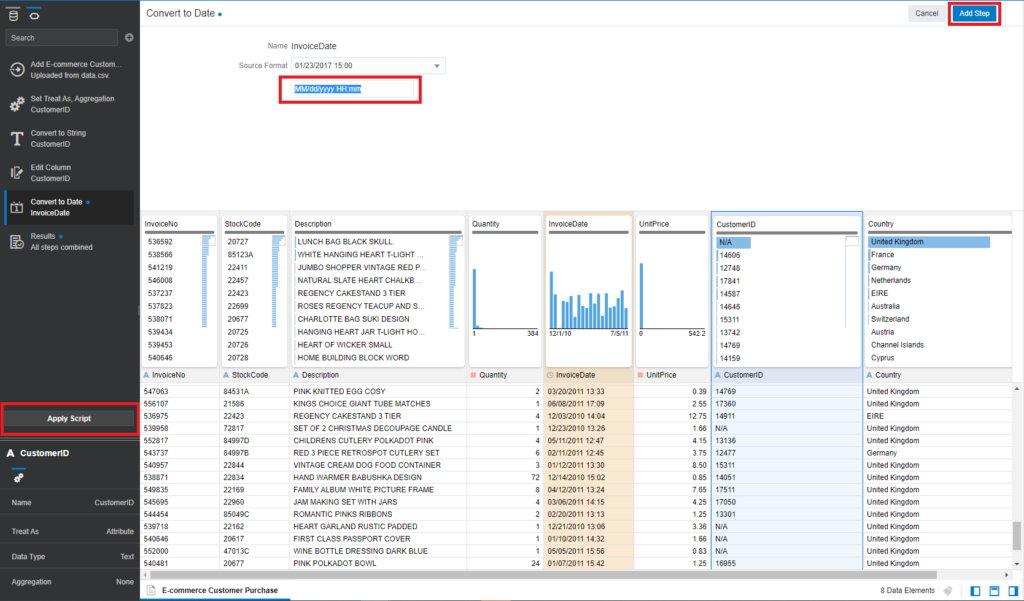
- Convert Invoice Data to Number. Click on Menu on InvoiceDate and Convert to Date
- Make sure that the Date format is MM/dd/yyyy HH:mm
- Click Add Step and Apply Script to apply changes to InvoiceDate
Model Implementation
We are going to create a Data Flow and use prebuilt Machine Learning algorithms to train the dataset. The Customer Segmentation mostly deals with several popular algorithms for building models:
- K-Mean Clustering
- Hierarchical Clustering
K-Means Clustering for Model Training
K-Mean is the first model used to build Customer Clustering. It is one of the simplest unsupervised learning algorithms applied to solve the clustering problem.
Create a new data flow and add the E-commerce Customer Purchase dataset which you imported earlier. Save the data flow as DF_Customer_Segmentation_K_Mean
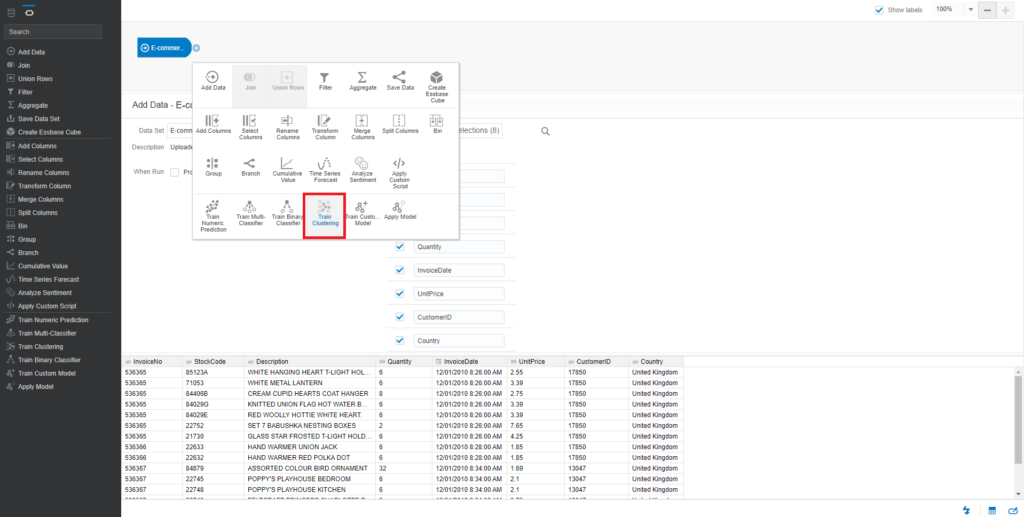
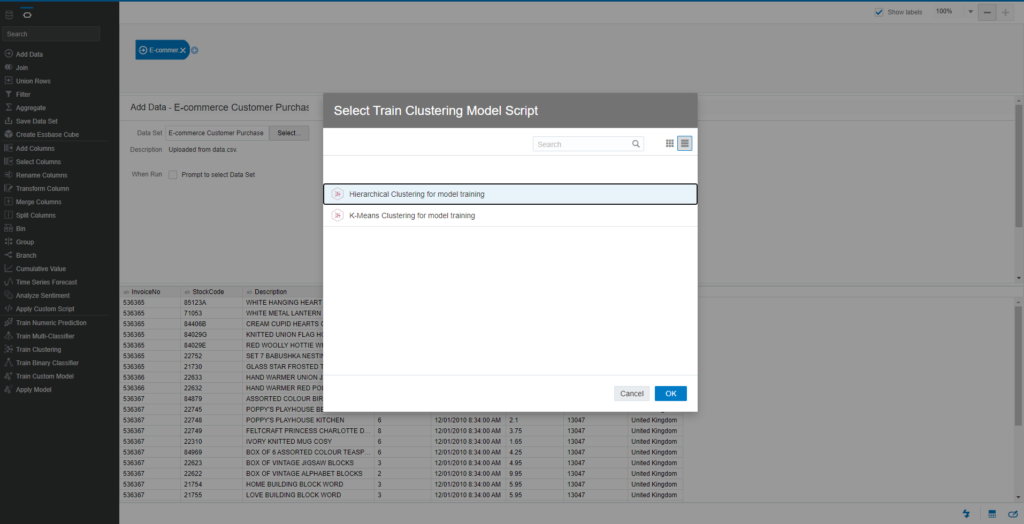
Click on the Plus icon on the added dataset and choose Train Clustering
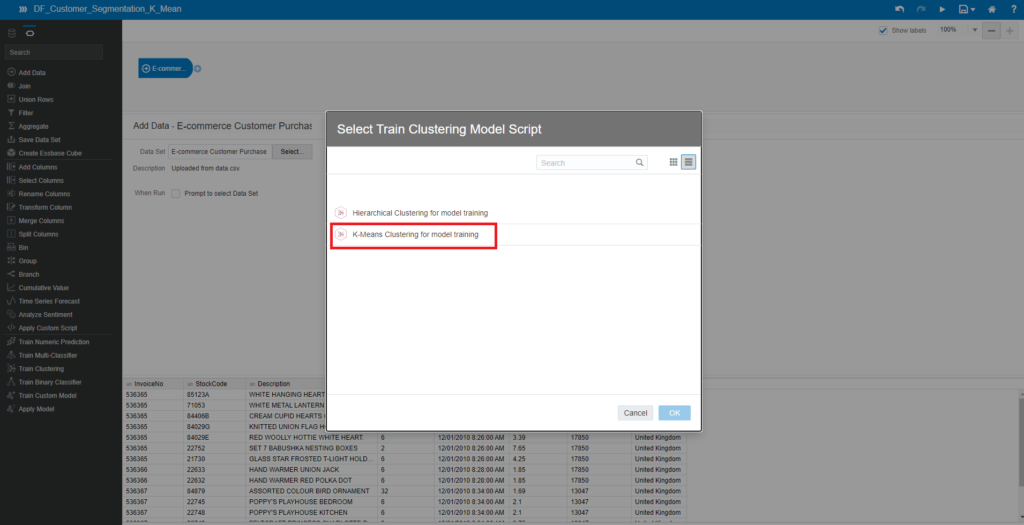
You will see a pop-up window Select Train Clustering Model Script. Select K-Means Clustering for model training
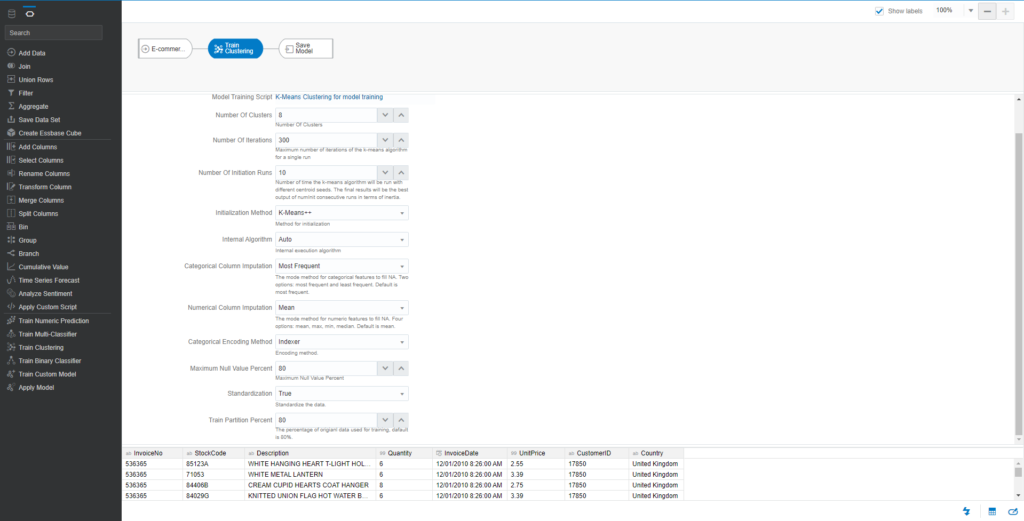
Check all initialized parameters required for K-Means Clustering and the explanation of each parameter
- Number of Clusters: 8
- Number of Iterations: 30
- Number of Initiation Runs: 10
Click Save Model and enter the name – MD_Customer_Segmentation_K_Means
Save the data flow and click Start to run this data flow. The process will take some time to proceed the model.
Hierarchical Clustering for Model Training
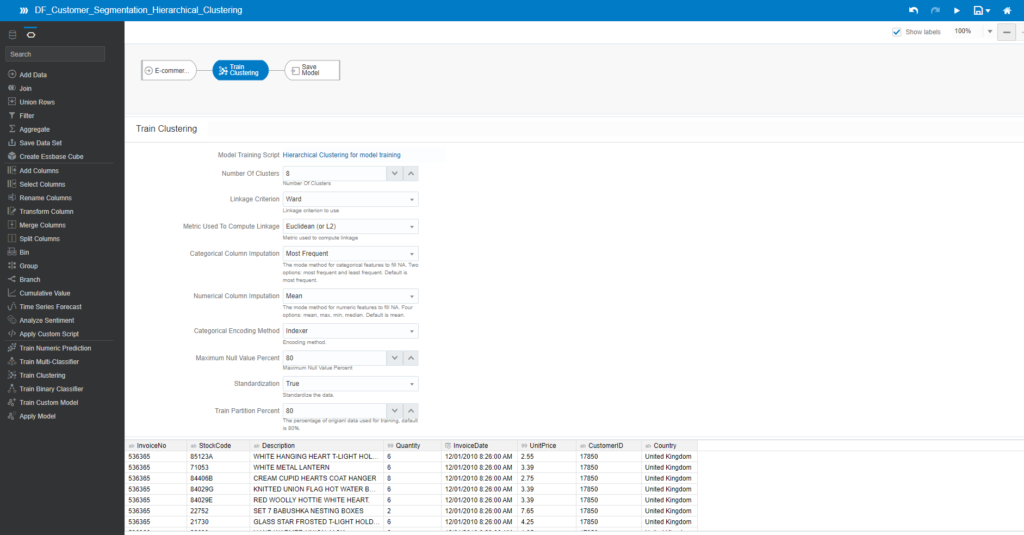
The same process takes place to create a new data flow. However, at the model implementation phase, you should select a different algorithm – Hierarchical Clustering for model training
Leave the settings of all parameters as default:

Save the model under the name MD_Customer_Segmentation_Hierarchical_Clustering and click Start to run it.
Note: If you are using the Oracle Analytics Desktop, you might encounter some performance issues with Hierarchical Clustering. Then, you might need to start trying with Oracle Analytics Cloud.
Model Deployment
After creating the model with K-Means algorithm, you need to apply this model to your dataset. Note that you only select 80% of records present in the dataset for Training process in Model Implementation. The Train Partition Percent parameter is 80.
Create a new data flow to apply to the MD_Customer_Segmentation_K_Means model. Then save the data flow as DF_Customer_Segmentation_K_Means_Apply. Add the E-commerce Customer Purchase dataset.
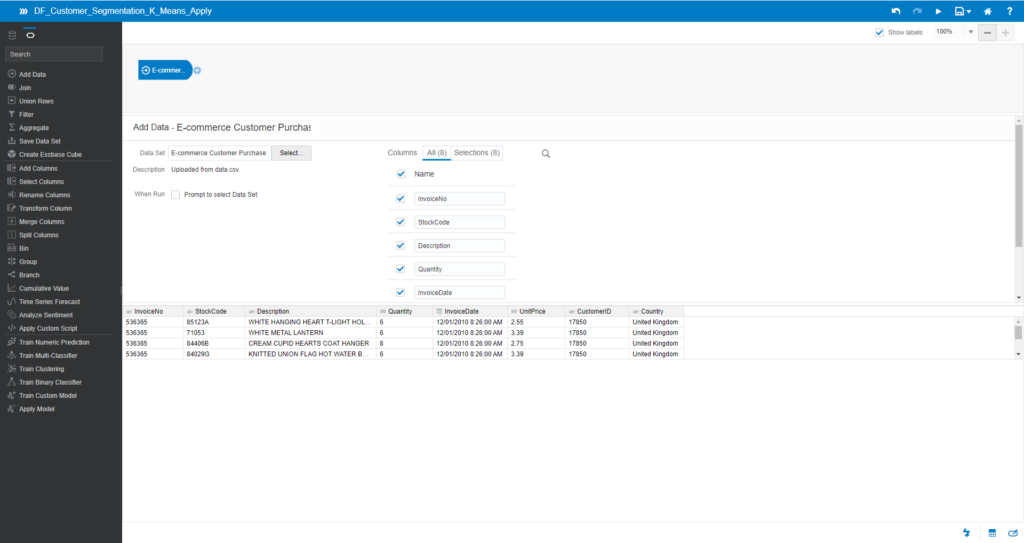
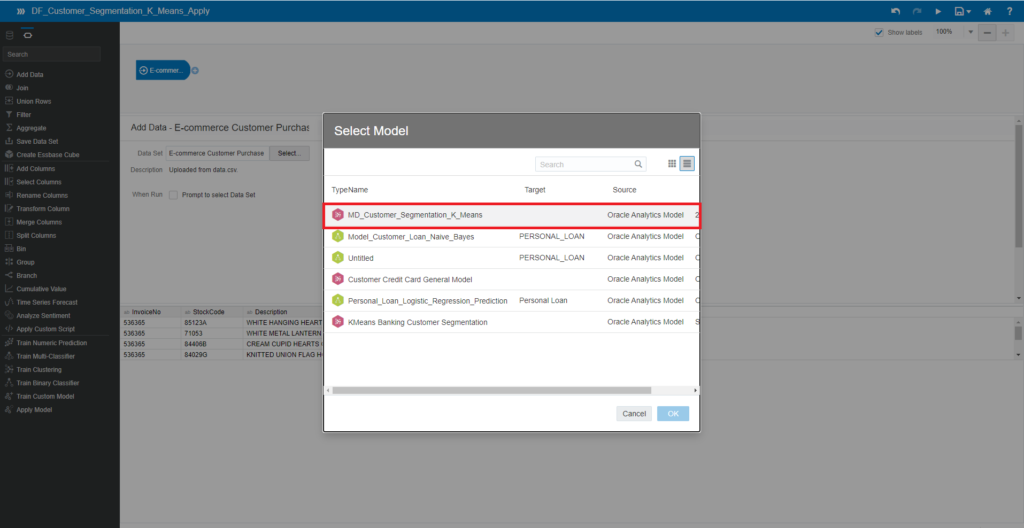
Click on the Plus icon of this dataset and choose Apply Model
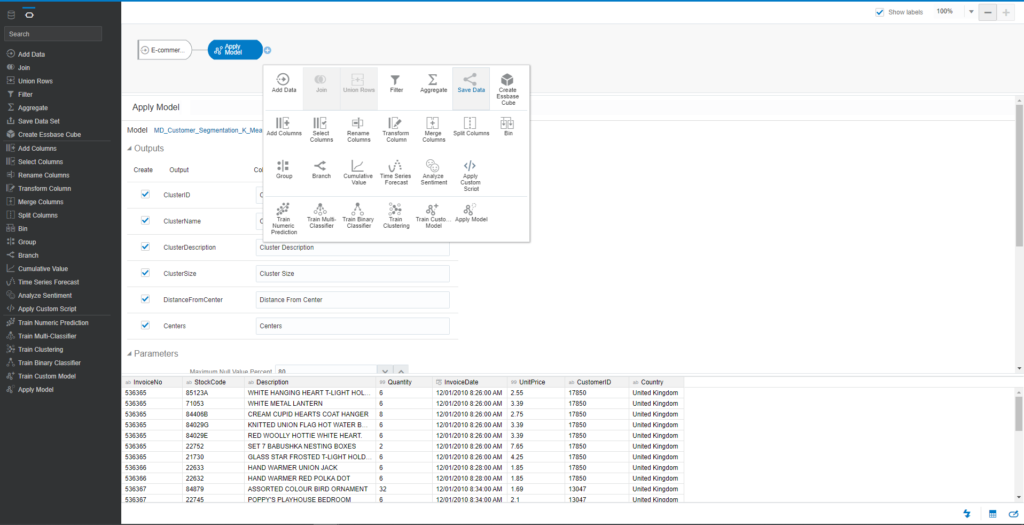
You will see the Select Model popup. Choose the model for MD_Customer_Segmentation_K_Means
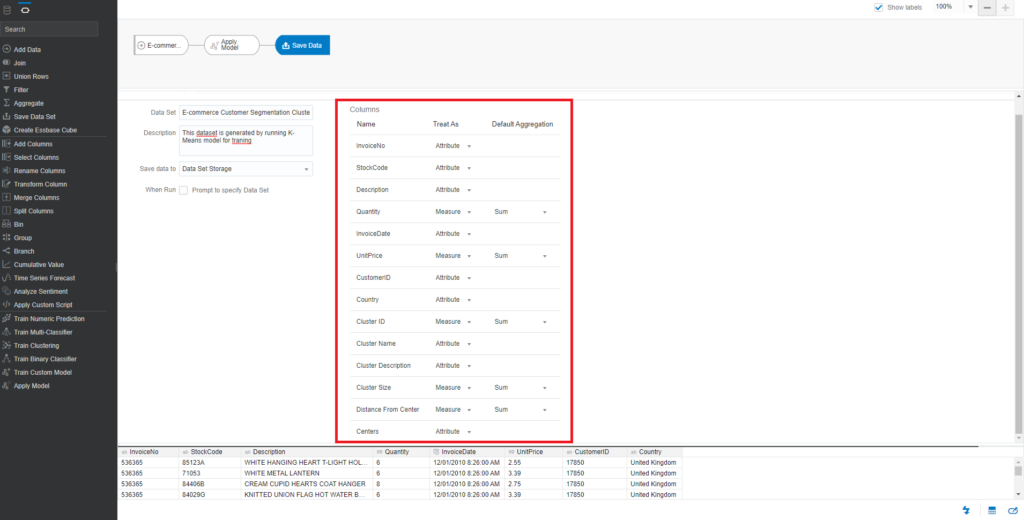
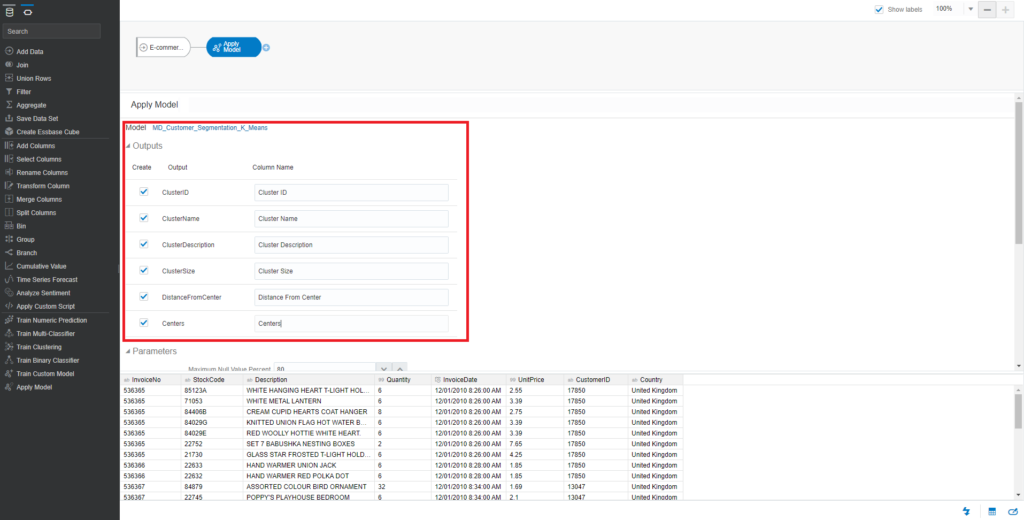
The output result of this process is a dataset that displays the returned values of the K-Means algorithm, such as ClusterName, ClusterDescription, ClusterSize, DistanceFromCenter, and Center. You can rename columns in the output results.
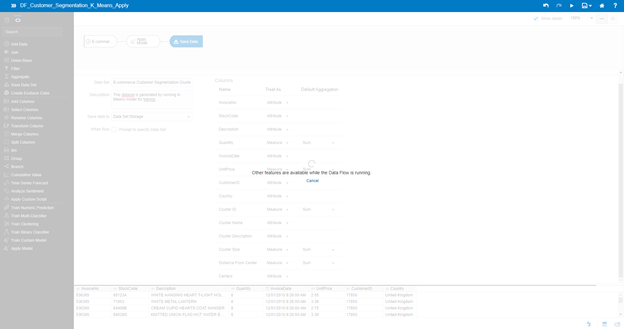
Click on the Plus icon of Apply Model and choose Save Data

Enter the name of the dataset – E-commerce Customer Segmentation Clusters (K-Means). The output columns of the dataset are the combination between the E-commerce Customer dataset and the K-Means output results.
Save the data flow and click Start to run
Now, the output of the data flow has been done. You can start visualizing the Customer Segmentation Analysis.
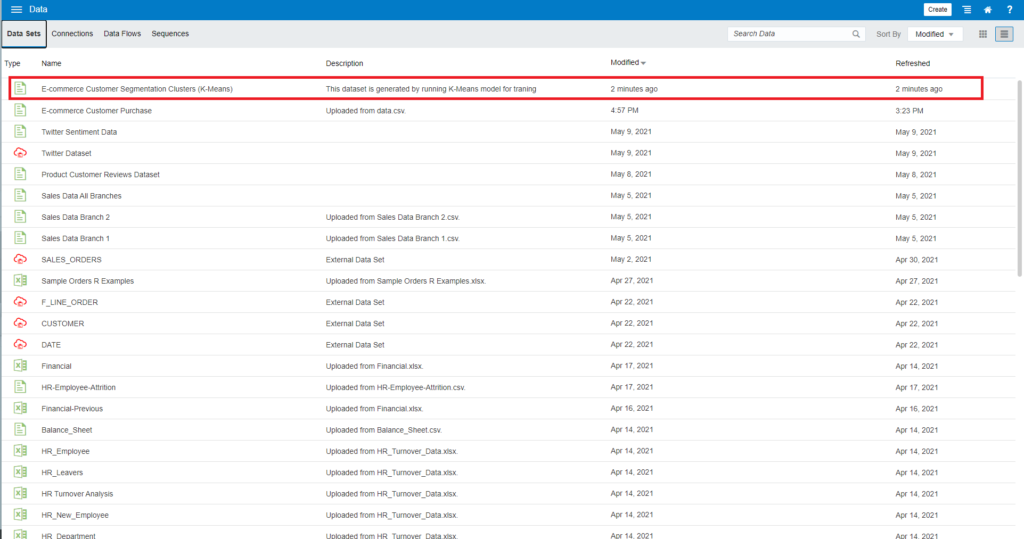
The saved dataset is E-commerce Customer Segmentation Clusters (K-Means).
Navigate to Home and Data. You can see the dataset generated:
Click on the dataset to discover the data profiling:
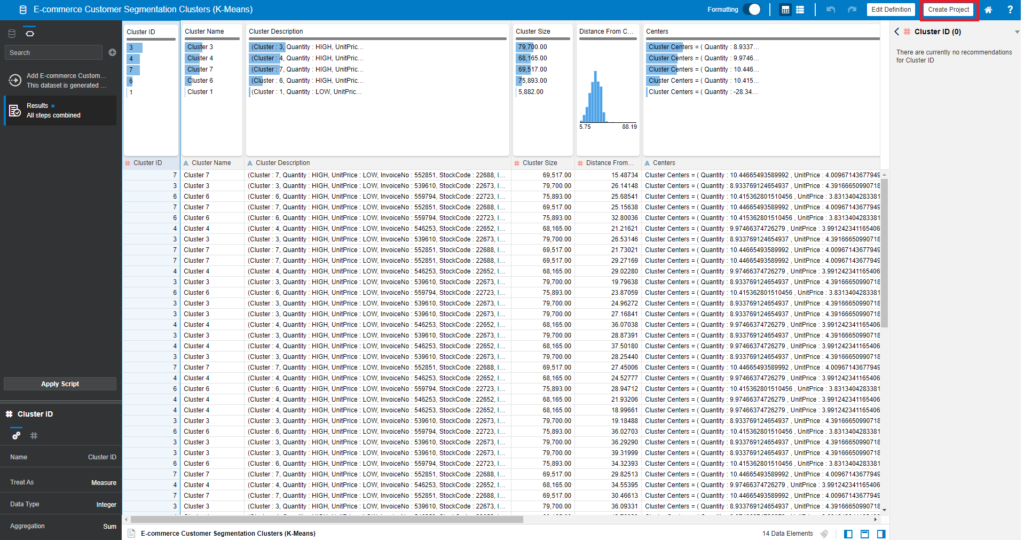
Now, we can start visualizing this dataset to find out patterns for Customer Segmentation.
Conclusion
In a data science project, you are often wondering:
- which model to use
- what configuration of parameters for each model/algorithm to use
Actually, there aren’t golden models and configurations to solve all business problems. Depending on your dataset (attributes) and your experience, you may try different models and algorithms. Compare their output (accuracy, performance) and tune parameters for your needs.
In Oracle Analytics, you can create an initial Data Flow, choose a model with parameters, and save the Data Flow and model. Repeat this process until you find the right parameters and model to solve your business problems. For example, Oracle Predictive Analytics allow you to predict of employee attrition and so on.
Tags: customer segmentation, data flow, oracle analytics Last modified: January 05, 2023