
Nowadays, companies are moving their infrastructure from on-premise devices to the cloud. There are a few major cloud vendors like AWS, Azure, and GCP that dominate the market shares.
When applications are deployed to the cloud, more and more data is generated daily. However, the humongous amount of data generated each minute has no value until these data are properly analysed. This brings us to the rise of Data Visualization tools allowing us to visualize large data.
Amazon offers a cloud data visualization tool called Amazon QuickSight that offers fast insights into the data in your databases or any cloud storage. Users can connect to the various supported data sources, fetch data into the in-memory SPICE data engine, and then build graphs and charts based on the imported data. Furthermore, users can share these graphs in the form of presentable dashboards with other users within or out of their organizations. This is extremely helpful as other users can also benefit from your analysis. It is also possible to embed these QuickSight dashboards into your custom application so that it looks like its part.
How to Setup Amazon QuickSight
As Amazon QuickSight is a cloud-based business intelligence platform, we do not need to perform any sort of manual installation. All that you need to do is to sign up for an AWS account. You can start by navigating to the AWS Management Console:
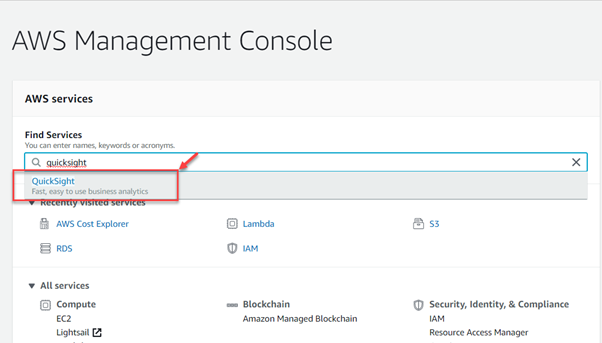
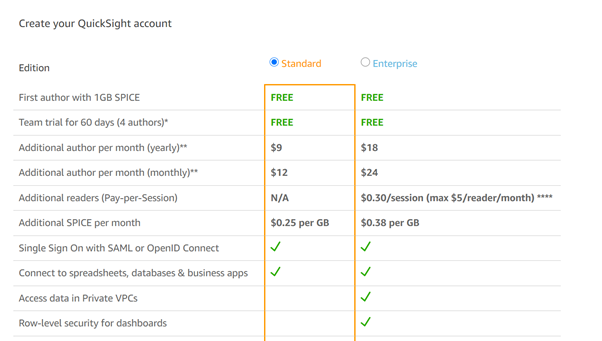
Select QuickSight and click Sign up for QuickSight. Next, you need to select the edition you want to set up and click Continue.
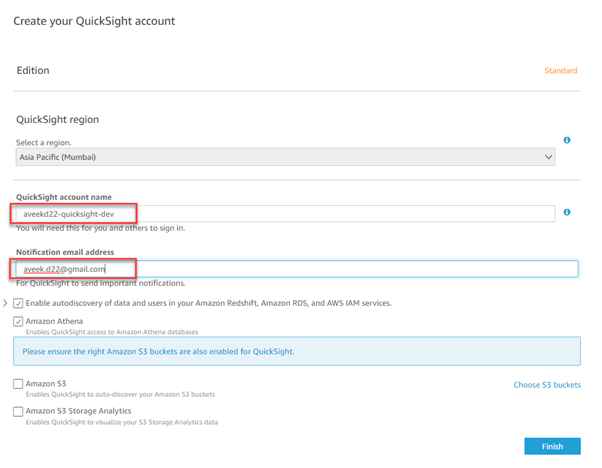
Provide the account details. Furnish a name and an email address for the QuickSight account.
Deploying the QuickSight account on AWS might take some time. Once the account is created, you will receive a confirmation as follows.
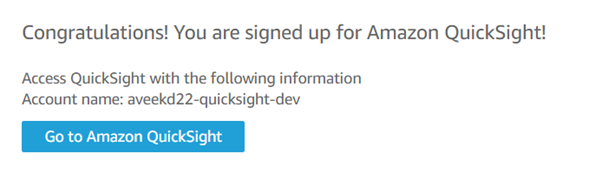
Click Go to Amazon QuickSight, and you will be navigated to the QuickSight console.
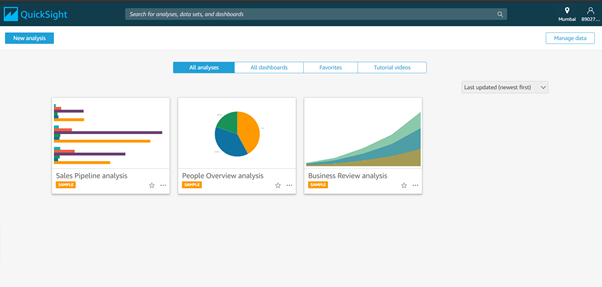
You can see several sample analyses in the console. These analyses are provided by Amazon for new users to get started with the QuickSight account.
Since this was provided by Amazon, we already have the data and a few visuals ready for us. If we start the analysis from scratch, there won’t be any datasets linked to the analysis directly.
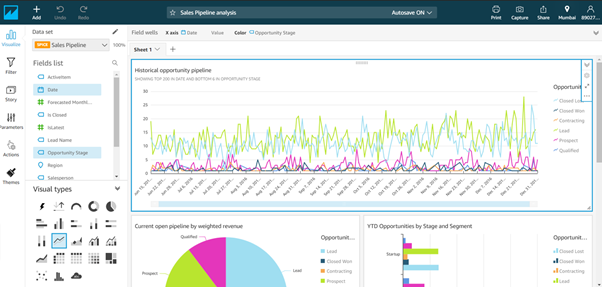
You can see that we have the Data Set, the Fields List, and Visual Types on the left-hand pane.
- Data Set shows which dataset is used to build the analysis.
- Fields List displays a list of all the columns that are available in the dataset.
- Visual Types is a pane from which you can choose the type of visual that you want to build. It can be a bar chart, a pie chart, or even a line chart.
As you start creating visuals, they will appear in the right-hand window. You can resize the visuals by dragging the handles around the corners of the visuals.
How to Create a New Analysis
To create a new analysis, we need to start with a dataset that can be used for the analysis. In this tutorial, I am going to use the Superstore dataset that can be downloaded for free.
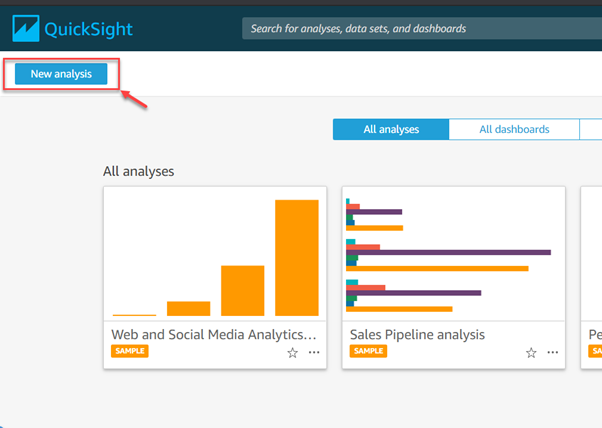
Click New Analysis.
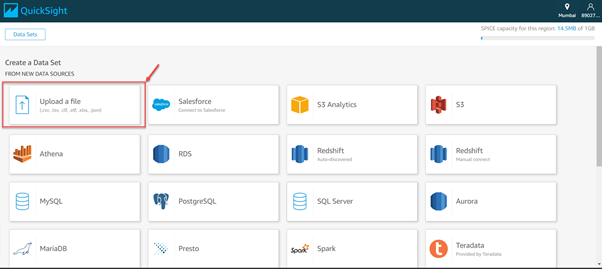
Click New Data Set. Since we are going to use our own dataset for this, choose the Upload a File option. In other cases, if you have your data residing on some other databases, you are free to choose RDS or some other database connector such as MySQL or SQL Server.
You need to specify the path for the file on your machine, and then it will be uploaded to the QuickSight account.
Note: without the dataset being imported into QuickSight, we cannot create an analysis.
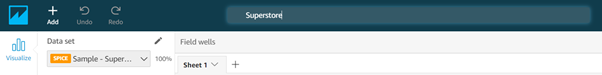
Once the dataset is imported, click Visualize to create an analysis based on the dataset. The New Analysis page will open up and you can rename the analysis.
You can see that all the fields from the dataset are now visible under the Fields List pane. You can start by dragging and dropping these columns from the pane to the Field Wells pane. This pane is responsible for creating the charts with the specified columns in there. You can also try out various Chart Types from the pane.
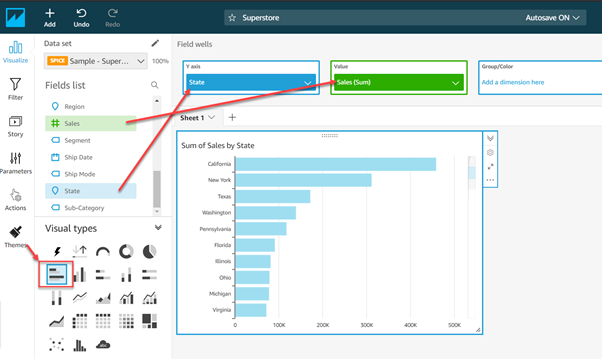
Suppose we are trying to visualize the Sum of sales by each state. For that, simply select the Bar Chart from the Visual Types pane and drag the fields State and Sales to Y-axis and Value wells respectively. This will generate the visual in the form of a bar chart that you can see in the figure above.
You can add multiple visuals to the analysis, and all these changes will be saved automatically.
Publishing and Sharing the Analysis
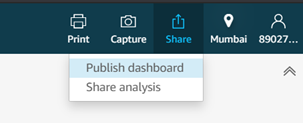
After the analysis creation, you can either share it with another user within the QuickSight account or publish it as a Dashboard and then share it with other users. A Dashboard in QuickSight is a read-only version of the analysis.
Click Share on the menu bar and select the appropriate option. I’ve selected Publish Dashboard because I am going to publish this analysis as a dashboard.
Name the dashboard and click Publish Dashboard. Alternatively, if you already have a dashboard created, you can choose to replace it.
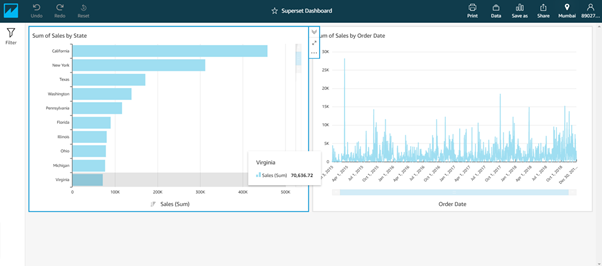
Now the published dashboard will be visible and available for other users.
Understanding the Concept of the SPICE Data Engine
The heart of Amazon QuickSight is a SPICE data engine. SPICE stands for Superfast, Parallel, In-memory, Calculation Engine.
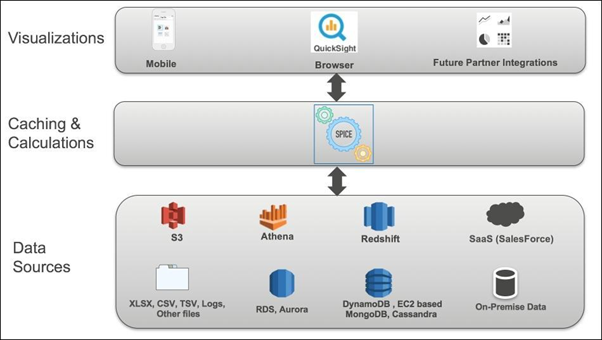
SPICE is responsible for caching the data within the QuickSight environment. It also helps perform various calculations within the dataset.
While importing data into QuickSight, users get two choices – direct query to the datastore or import the data into SPICE.
Importing data into SPICE has some added advantages. It is optimized to perform analytical queries faster and it also saves time if your original data source incurs charges for every query that is processed. Another feature provided by the SPICE data engine is that it encrypts the data at rest for the Enterprise Edition.
While setting up Amazon QuickSight, a customer can decide on the capacity of the SPICE memory required to support the data architecture. We need to calculate the SPICE capacity in Amazon QuickSight before bringing in the entire data for analysis.
The memory required by SPICE to store decimals, dates, and integers is 8 bytes per field whereas for strings it is 8 bytes added with the UTF-8 encoded length of the character. The total capacity required can be calculated as follows. For example, we have a table in RDS that contains 2 billion records. Each row in the table has the following columns:
- id (integer)
- name (string)
- unit_price (decimal)
- quantity (integer)
- amount (decimal)
- purchase_date (date)
So, in total, we have 6 fields of which 2 are integer, 2 are decimal, 1 date, and 1 string. Let us first calculate the memory required for one row.
(2 * 8) – for integers
+ (2 * 8) – for decimals
+ (1 * 8) – for date
+ (1 * (8 + 100)) – for string, 100 is the varchar length in the database table.
= 16 + 16 + 8 + 108 = 148 bytes for each row
Now, to calculate the SPICE capacity for the entire dataset, we need to multiple this with the number of records in the dataset.
2,000,000,000 * 148 = 296,000,000,000 bytes
To convert the above bytes to GB, divide it by 1,073,741,824.
i.e. 296,000,000,000 / 1,073,741,824 = 275.67 GB
So, to accommodate the entire dataset of 2 billion records into SPICE, you can plan around approximately 300 GB of SPICE memory capacity.
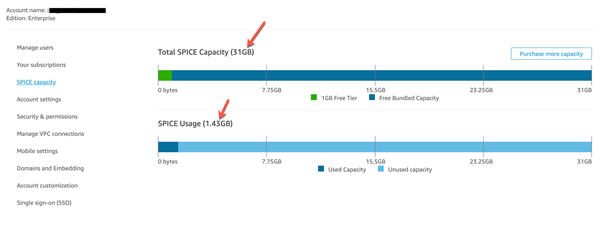
As you can see in the figure above, this is a screenshot from the development environment. The Amazon QuickSight console lets you view the total SPICE memory available in your current account.
Conclusion
In this article, we have learned how to get started with Amazon QuickSight. It is a fully managed data visualization tool offered by Amazon on AWS. To learn more about Amazon, you can also read our articles Setting Up SQL Server on the Amazon RDS, Trigger Lambda functions in AWS and Introduction to AWS Lambda Layers.
Tags: amazon, AWS Last modified: October 27, 2022