The traditional approach to the transformation process (Extract, Load, Transform) requires that technical users get involved directly. They execute connection to data sources, the transformation of data, and provide final datasets to business users. The process often requires much time whenever business users ask for more information or due to changes/updates in business logic. Then, technical users have to revert datasets and transformations.
Data Flow in Oracle BI Analytics is the solution for business users letting them create sequential transformations for their datasets. The user interface offers a set of components to perform transformation without programming skillsets for the following goals:
- Combine, transformб and integrate datasets
- Prepare curated datasets for further analysis
- Send curated datasets to relational databases or Essbase
- Build training of machine learning models
The current articles will focus on using Data Flow to build Sentiment Analysis. This is one of the common use-cases related to customer datasets for comments, feedback, etc.
Use Case Overview
Assuming that you have an urgent task to analyze the Sales data for particular branches.
You have requested the IT team to extract data into multiple datasets. Now, you need to combine all datasets into a single view and build reports without efforts spent on the transformation process.
We’ll need to perform the following actions:
- Upload raw data
- Create Data Flow
- Merge raw Data Flow into a single view
- Transform the data
- Run and manage Data Flow
Before we start to examine this case in detail, make sure to download the latest version of Oracle Analytics Desktop and install it.
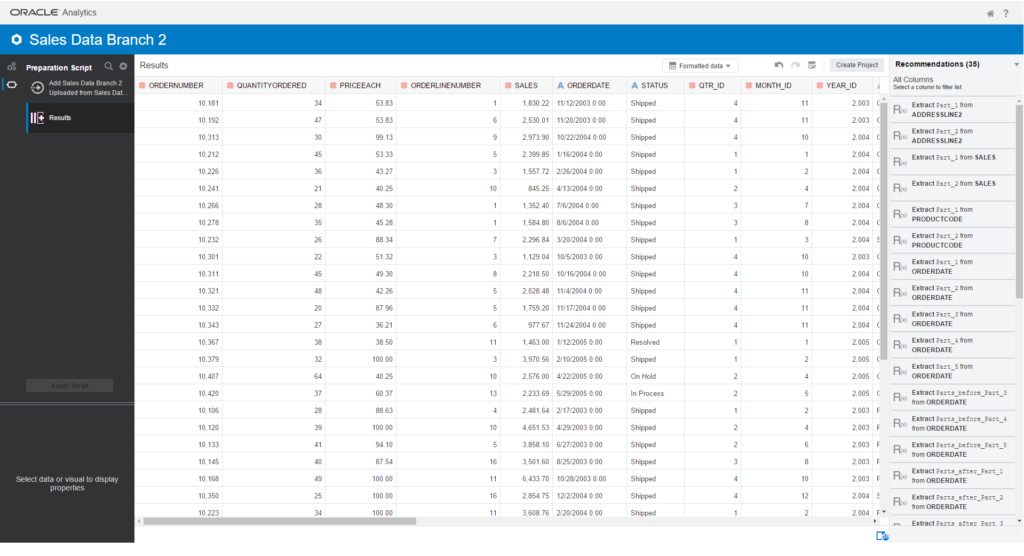
Upload Raw Data
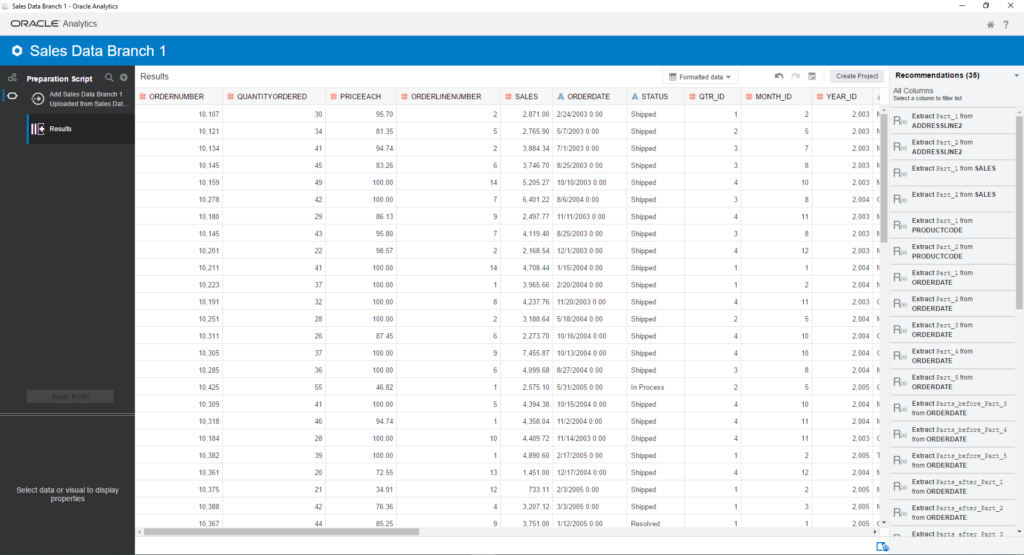
At this stage, we upload two Sales datasets from Branch 1 and Branch 2.
Open Oracle Analytics Desktop, navigate to the top-right corner, and click Create > Data Set
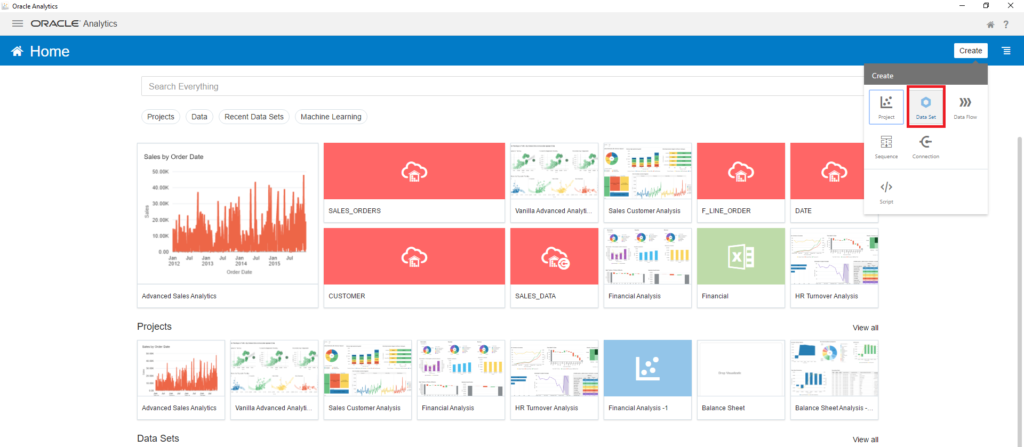
The Create Data Set window appears. Choose Drop data and browse to the data file.
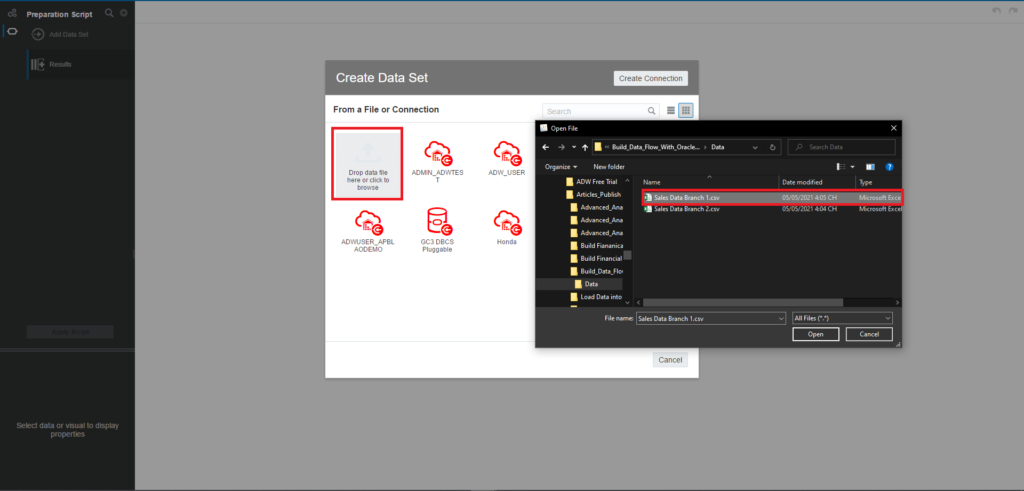
Click the Add button to add the necessary dataset.
Continue adding new data set for the Branch 2 Sales data:
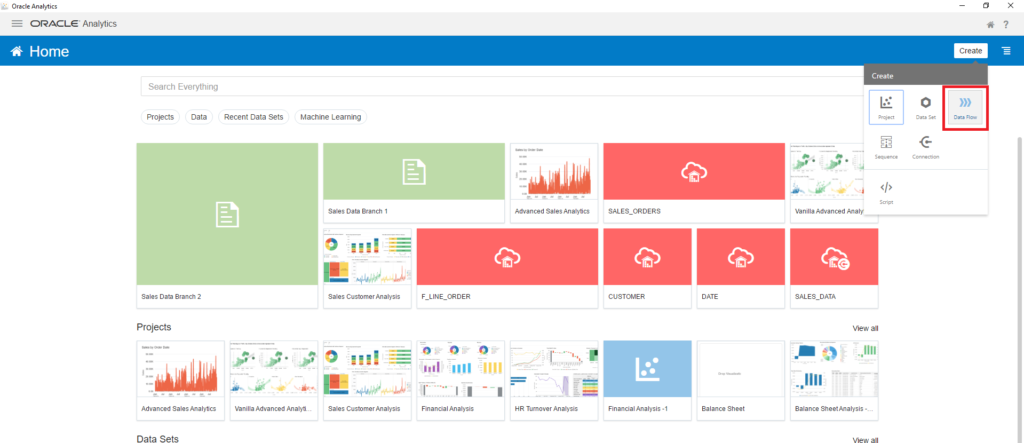
Create Data Flow
The goal of this step is to create a Data Flow project and combine two datasets uploaded in the previous step.
On the top-right corner, click Create > Data Flow
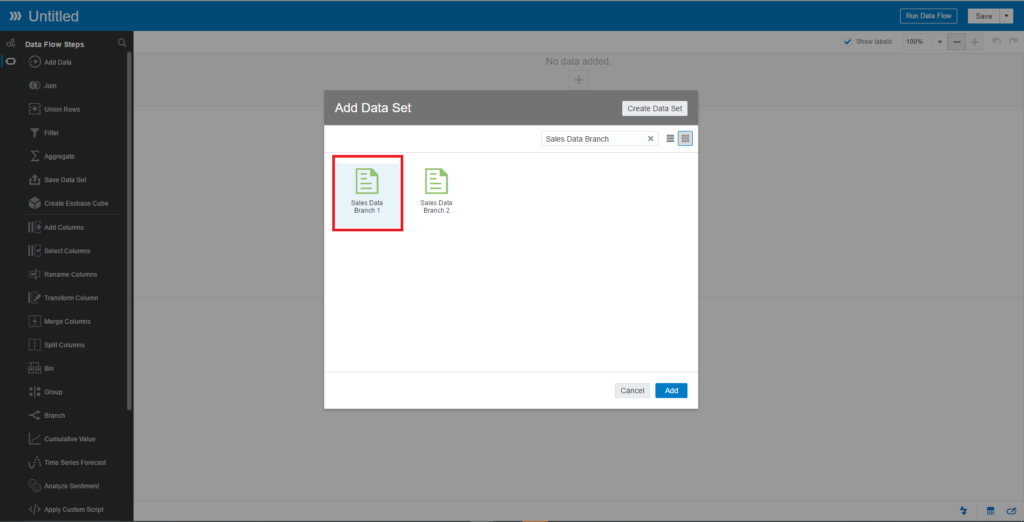
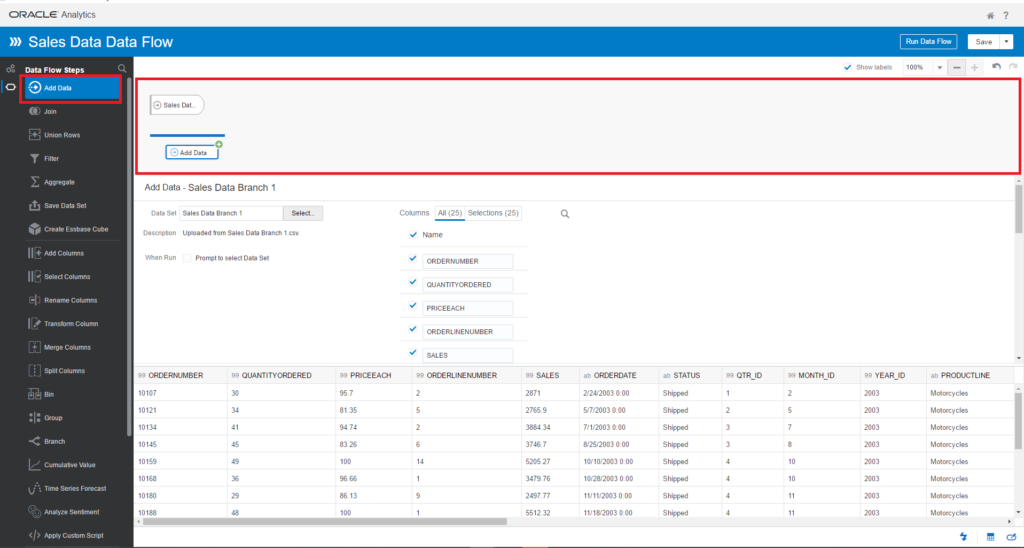
In the Add Data Set window, you can add your datasets at once or choose to or add them later. Type Sales Data Branch in the search field and choose Sales Data Branch 1
Rename the Data Flow project to Sales Data Flow
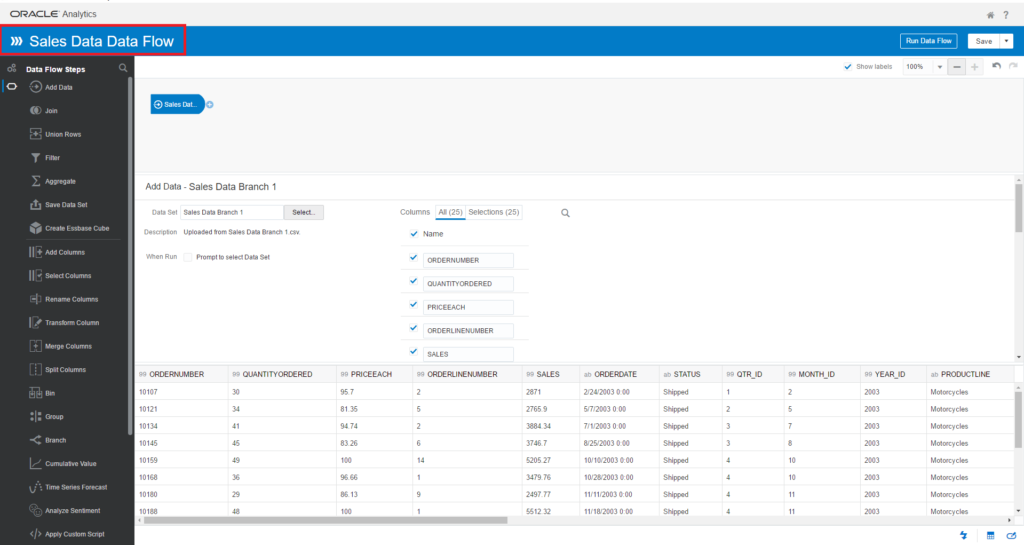
On the Data Flow Steps panel, drag and drop the Add Data component to the designer area.
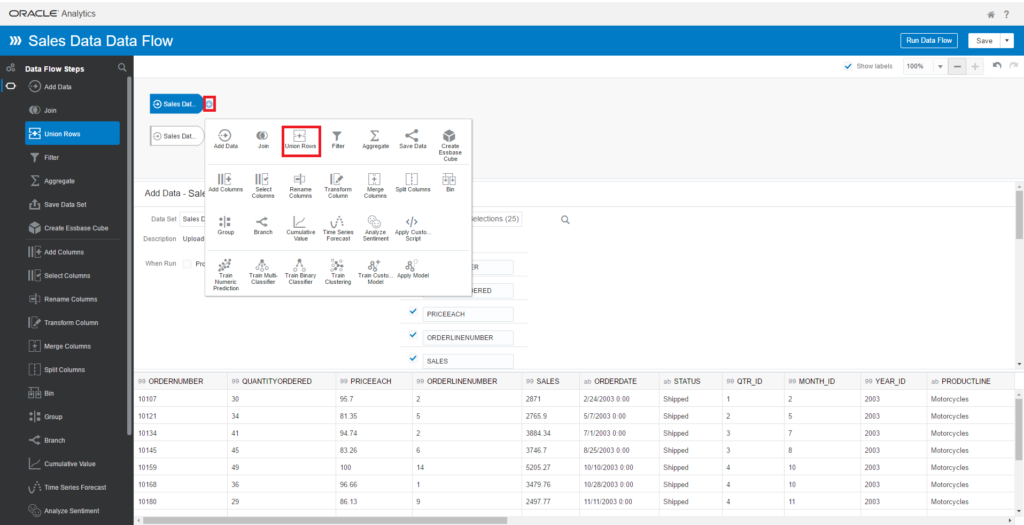
In the Add Data Set window, choose the Sales Data Branch 2 dataset. Click on the Plus icon of the Sales Data Branch 1, and choose the Union Rows step.
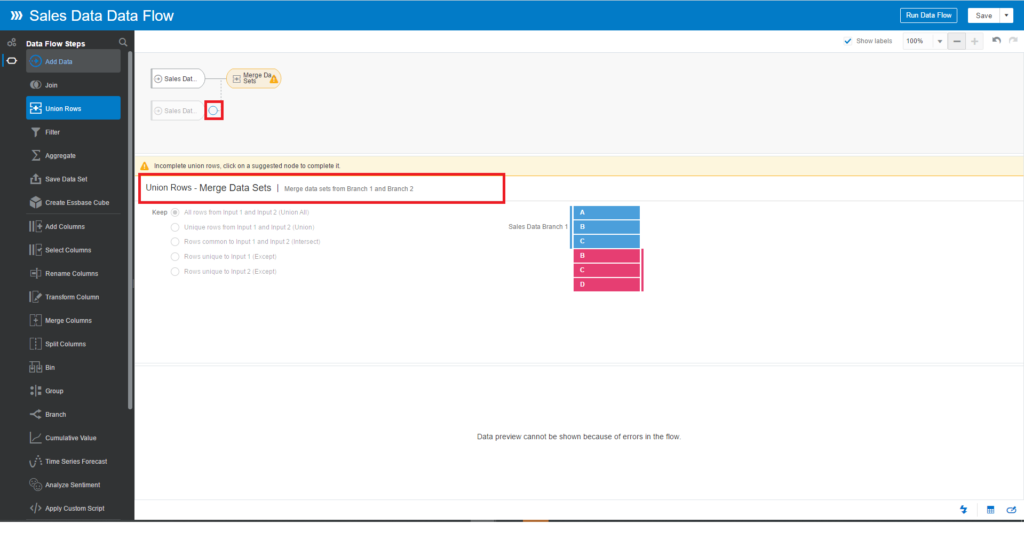
By default, you see the warning message: Incomplete union rows, click on a suggested node to complete it. It is because you don’t choose any dataset for the Union process.
Merge raw Data Flow
Click on the Circle icon of Sales Data Branch 2 to complete the Union component. You can also rename the Union step and provide a description:
You choose the All rows option from Input 1 and Input 2 (Union All)
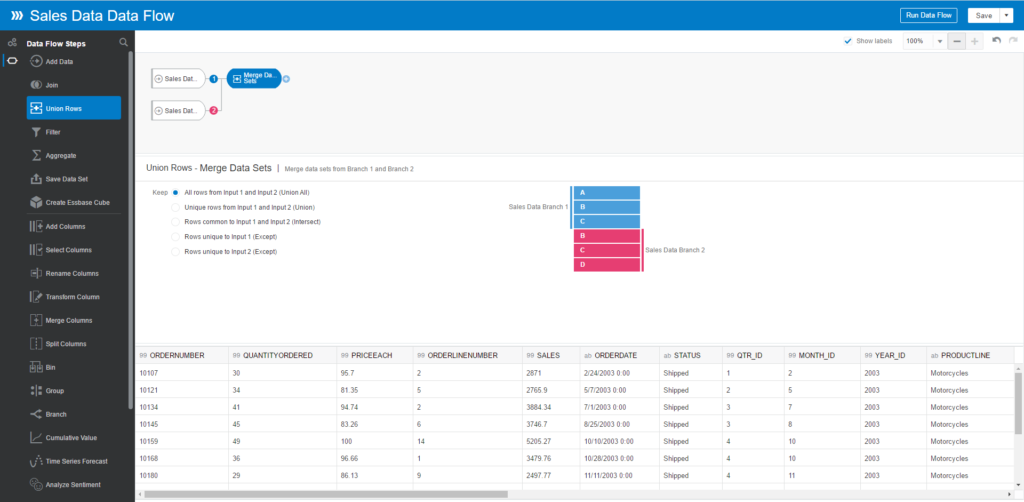
The Union component receives two input datasets.
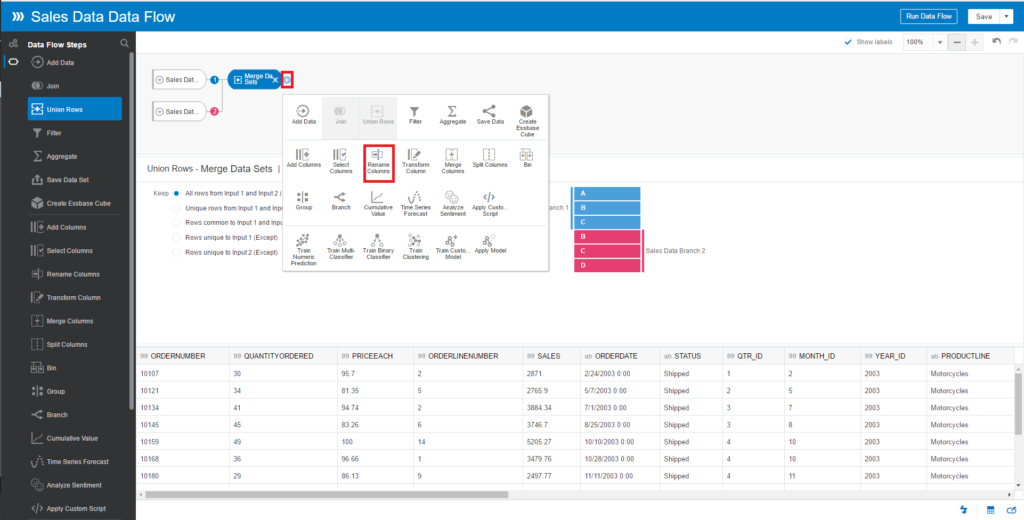
Now, you need to rename the columns to convenient names to use in your reports such as Order Date, etc. Click on the Plus icon of the Union Rows step > Rename Columns.
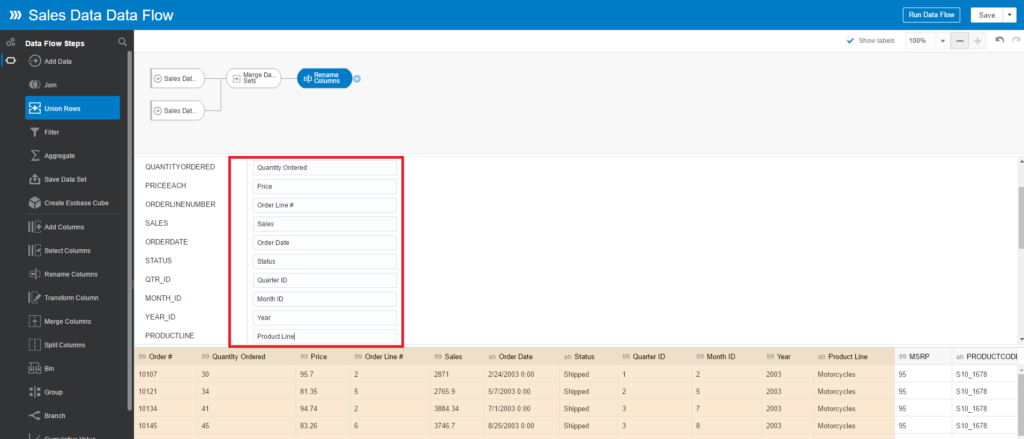
Rename columns as you need.
Transform the data
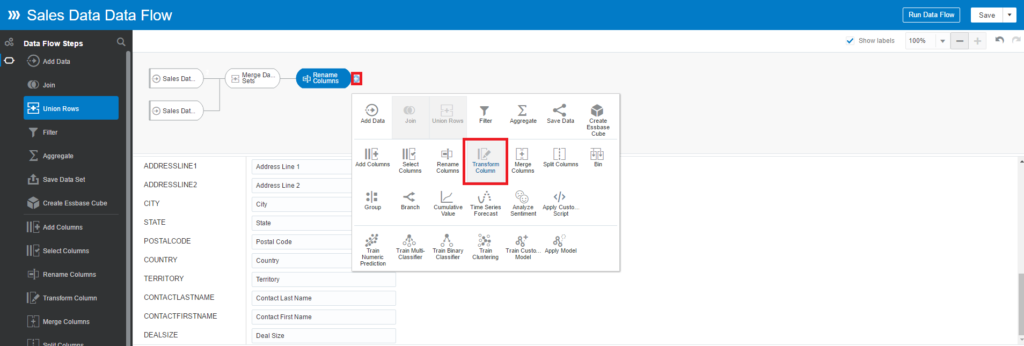
In the dataset, you see that the State column can be empty. Thus, you need to transform an empty value to N/A. Continue clicking on the Plus icon of the Rename Columns step. Choose the Transform Column step.
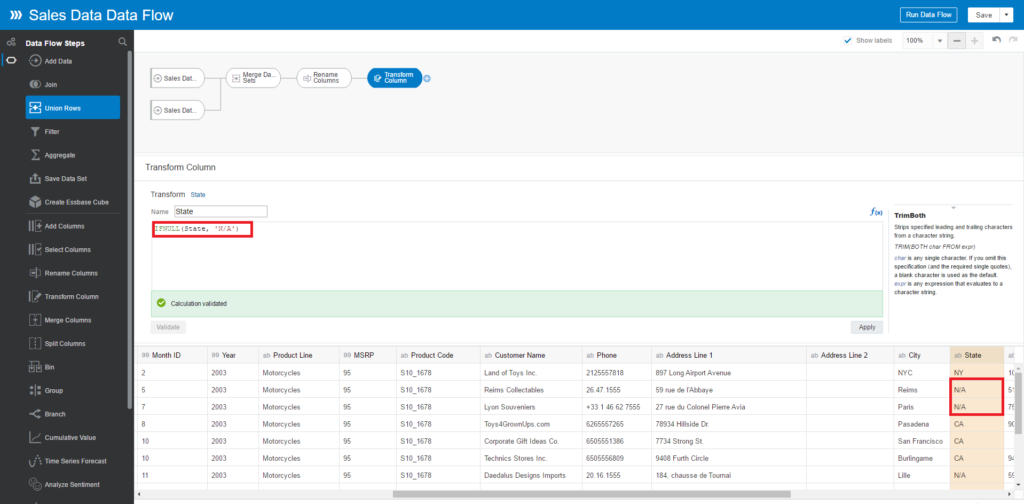
In this case, you use the IFNULL function to check if the Status is NULL, then you use N/A value.
Click Validate to make sure there is no error syntax, and then Apply. You can see the N/A value in the State column.
Continue adding the Split step. Here, you need to split the Order Date column into three parts, and then combine them to create a new column with the Date datatype (dd/mm/yyyy).
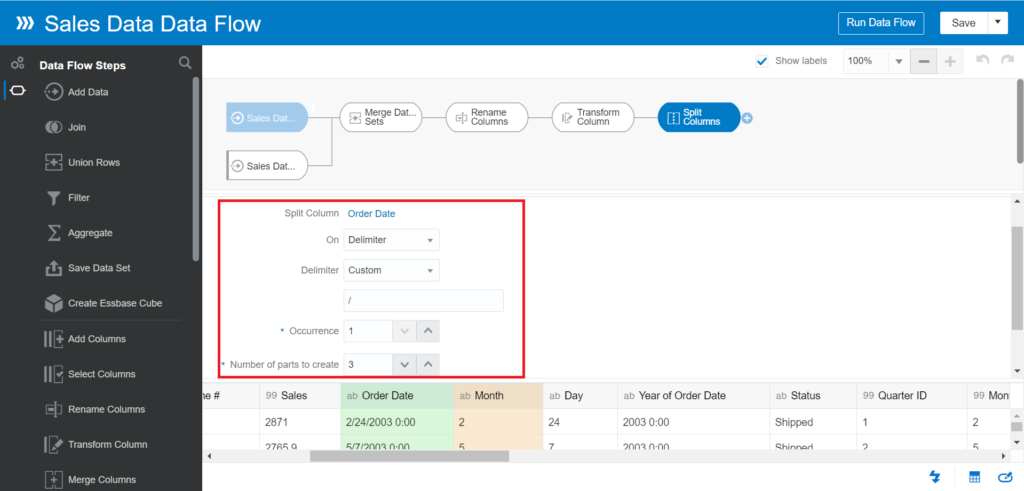
The contents of the Order Date column get split into three columns – Day, Month, and Year Of Order Date. You need this step because Order Date can have different formats of Date, such as m/dd/yyyy, mm/dd/yyyy, or mm/d/yyyyy. Thus, you need to standardize the format and convert it to the Date data type.
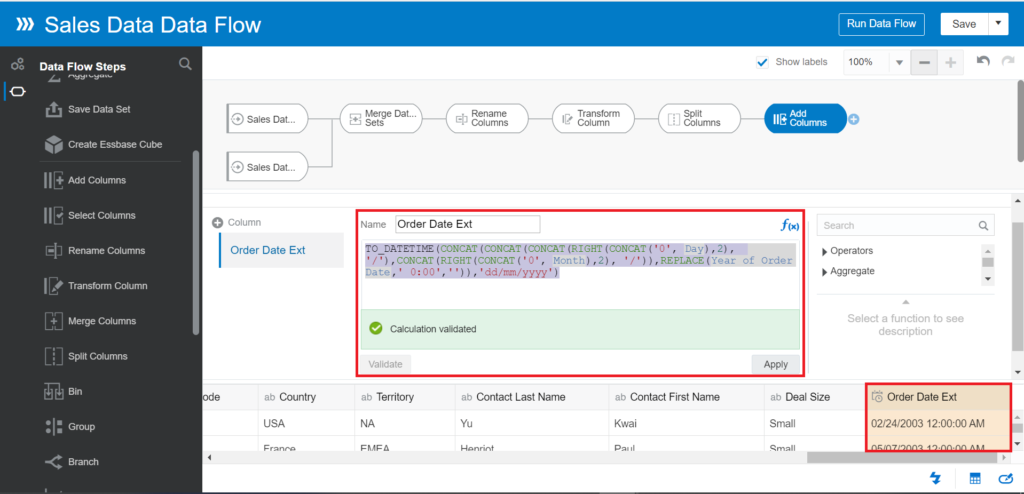
Click on the Plus icon of the Split Columns step > Add Columns.

Enter the name of the new column Order Date Ext.
Enter the expression:
TO_DATETIME(CONCAT(CONCAT(CONCAT(RIGHT(CONCAT('0', Day,2), '/'),CONCAT(RIGHT(CONCAT('0', Month),2), '/')),REPLACE(Year of Order Date,' 0:00','')),'dd/mm/yyyy')The purpose of this expression is to combine three Day, Month, and Year of Order Date columns. Then use TO_DATETIME to convert the combination to the DATE datatype within the dd/mm/yyyy format.
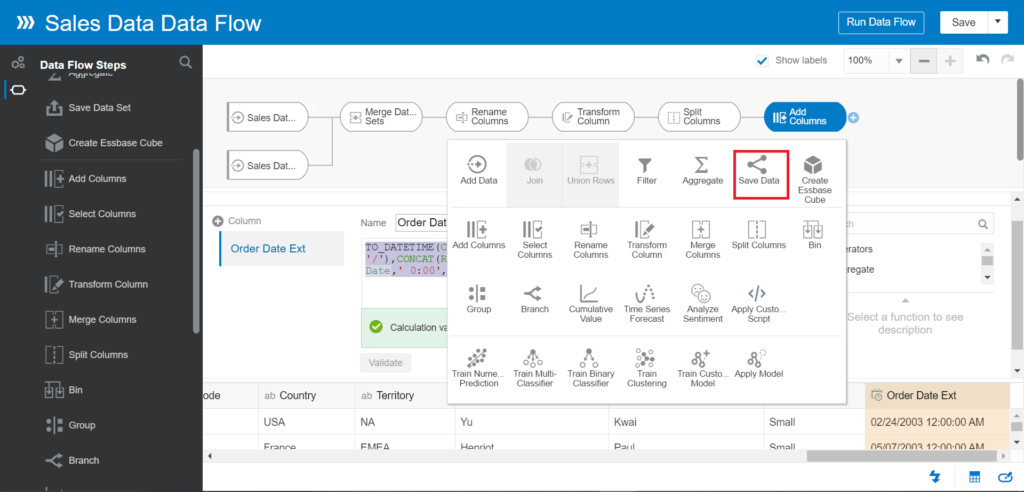
Next, you need to save the combination to the finalized dataset. Click on the Plus icon of the Add Columns step > Save Data step.
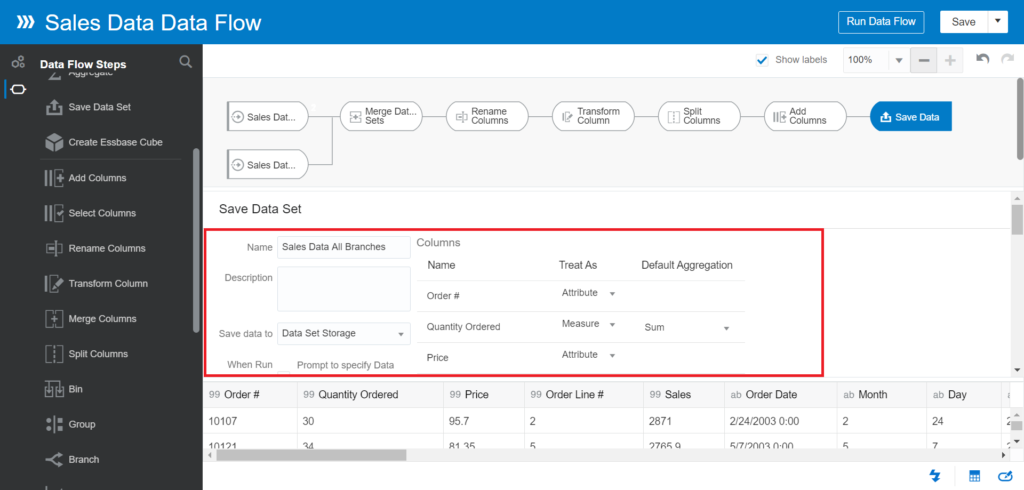
- Enter the name of your dataset: Sales Data All Branches
- Save data to Data Set Storage
- Choose Data Set Storage to save the output data in a data set in Oracle Analytics.
- Choose Database Connection to save the output data in one of the supported database types.
- Update the following columns to Measure in Treat As. Other columns should be Attribute. The purpose of Measure columns is to support Aggregation functions automatically, such as SUM, COUNT, etc. when you build reports
-
- Quantity Ordered
- Sales
Run and manage Data Flow
Click Save and Run Data Flow
Go back to the Home page of Oracle Analytic. Click on the hamburger icon on the top-left corner > Data menu
Now, you can see the Sales Data All Branches dataset that has been generated after your data flow run.
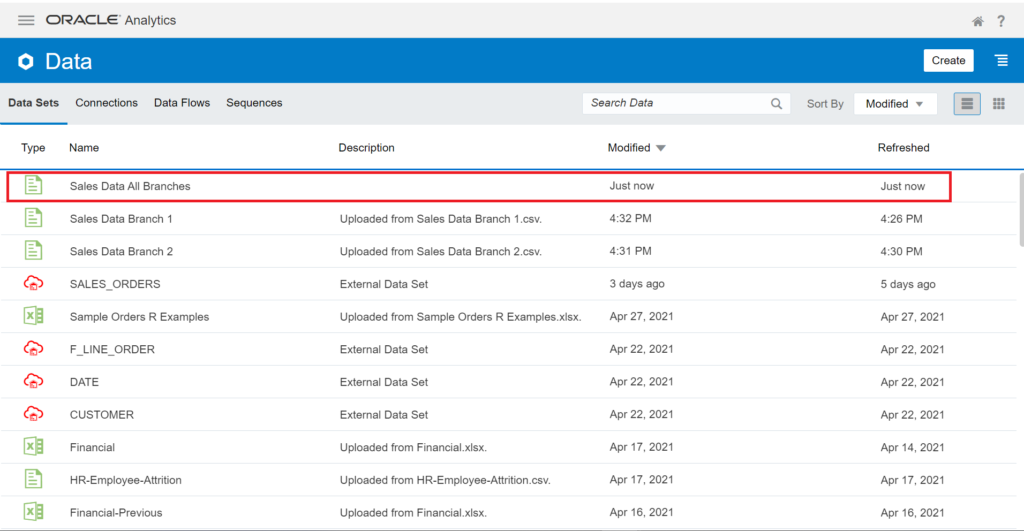
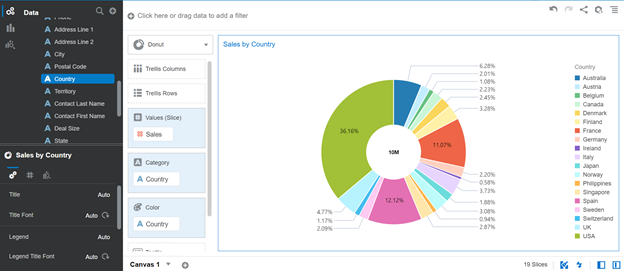
You can start visualizing and building reports based on your finalized dataset.
Conclusion
This tutorial let us get familiar with a few steps in Data Flow, such as Union Rows, Split, and Add Columns. These options let you combine multiple raw files in a single view (dataset) to analyze the data based on a combined dataset.
The Data Flow of Oracle Analytics lets you extract, load, and transform the data by dragging and dropping the prebuilt components. It allows easy building of the Data Flow easily without referring to the technical team.
Complicated transformations require such prebuild functions as:
- STRING
- DATE
- Operators
- Math
- Conversion
- Aggregation
The next tutorial will focus on building the Data Flow to analyze sentiment based on the feedback of customers’ datasets.
Read Also
Introduction to Advanced Analytics Features in Oracle BI Analytics
Learning Advanced Analytics Features with Oracle BI Analytics: Outliers and Clusters
Advanced Analytics with Oracle BI Data Analytics – Handling with Express Builder Functionality