From the Customer Segmentation tutorial, you already know that Oracle Analytics provides several Machine Learning (ML) algorithms to solve the Supervised Learning and Unsupervised Learning problems with low-code required.
Prediction of Employee Attrition is one of such Supervised Learning problems. It is a popular use case that most organizations need to resolve to minimize the attrition rate. You train a model with a labeled dataset, and Employee is labeled Yes or No for Attrition in the dataset.
In this tutorial, we are going to know how to use Data Flow in Oracle Predictive Analytics to predict Employee Attrition. We will try different algorithms to predict and evaluate which model is the best for resolving Employee Attrition:
- Naive Bayes
- Neural Network
- Support Vector Machine
Project Lifecycle Development
Most data science projects follow the five stages of Project Lifecycle Development:
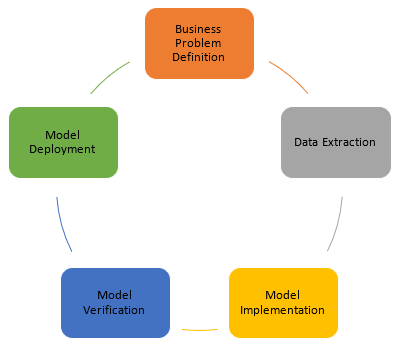
Business Problem Definition: this stage defines the business problems to be resolved and identifies the data business requirements:
- Where does data come from?
- What data is needed (attributes)?
- How is data transformed?
Data Extraction: this stage defines processes to extract data.
Model Implementation: this stage defines the algorithms and models to resolve the defined business problems based on training a dataset. You have to run various algorithms and models to find out which ones return the most accurate results.
Model verification: this stage applies the algorithm and the model to your testing dataset.
Model Deployment: after model verification, you need to deploy the model and run it on the real dataset.
The above-mentioned stages continually run in the lifecycle process until the business problems are resolved completely.
Prerequisites for Analytics
- Download and install the latest version of Oracle Analytics Desktop
- Provide Autonomous Data Warehouse database.
- Complete the Customer Segment tutorial to get familiar with Data Flow in Oracle Analytics.
Get Sample Employee Attrition Dataset
Download a sample dataset. We are going to work on the Employee Attrition dataset. Each record is marked Yes or No for the Attrition column defining if an employee has resigned or not.
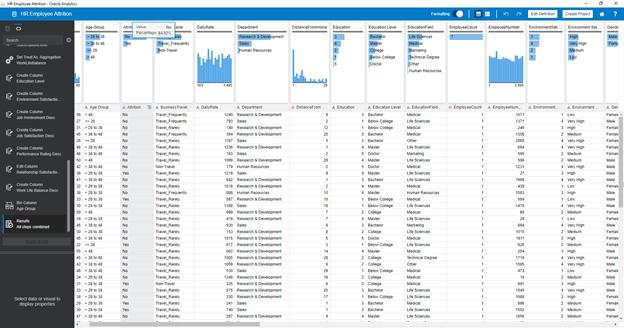
Open Oracle Analytics Desktop and import the dataset. Save the dataset with HR Employee Attrition. You can see that the No value of Attrition is 84.92% and Yes of Attrition is 15.08%.
Choosing Prediction Model
In this step, you are creating Data Flow and use prebuilt Machine Learning algorithms to train your dataset. You start developing ML algorithms for Prediction Attrition and evaluate what model is the best one:
Notice that you only choose 80% of the dataset to train and 20% of the dataset to test the model for all algorithms used in this tutorial.
Naїve Bayes for Model Training
Create a new data flow and add the HR Employee Attrition dataset which you imported at the previous step. Save the data flow with the name DF_Employee_Attrition_Naive_Bayes.
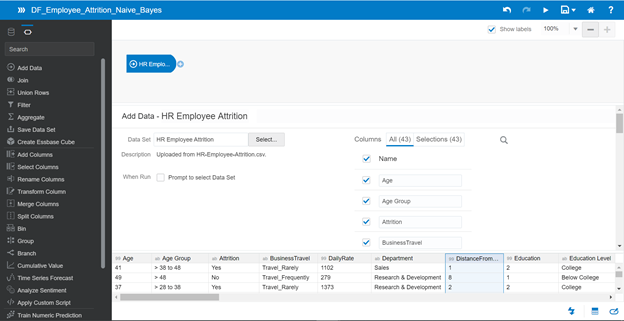
The business problem is to predict Yes or No for Attrition. Click the Plus icon of the dataset added and choose Train Binary Classifier.
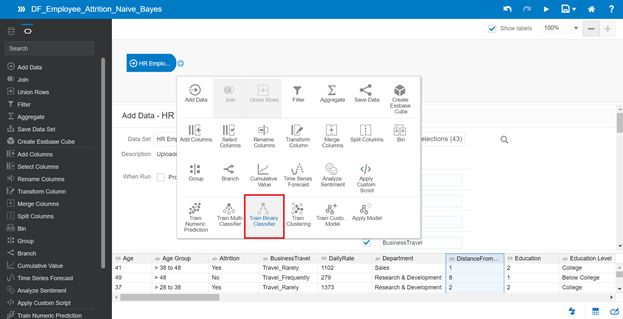
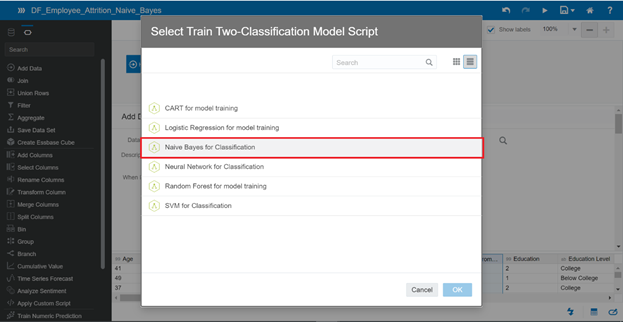
Select Train Two-Classification Model Script when a popup appears, and choose Naïve Bayes Classification for model training.
In the Target parameter, you choose the Attrition column for prediction in your dataset. You can keep default values for other parameters
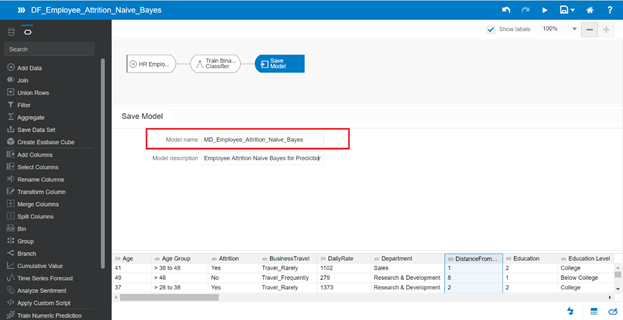
Click Save Model and enter the name MD_Employee_Attrition_Naive_Bayes
Save the data flow and click the Start icon to run it. Depending on the power of your environment, the process will take a while for proceeding with the model.
Neural Network for Model Training
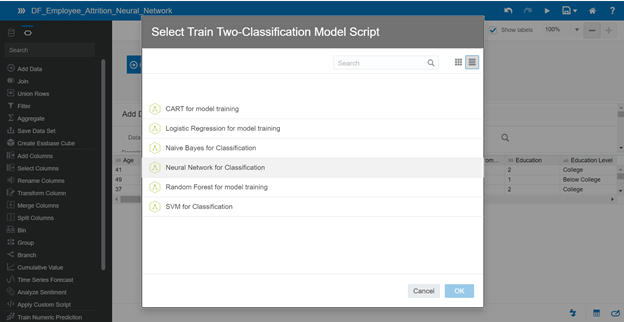
Apply the same process to create a new data flow, but with a different algorithm – Neural Network Classification for model training.
Save the DF_Employee_Attrition_Neural_Network data flow.
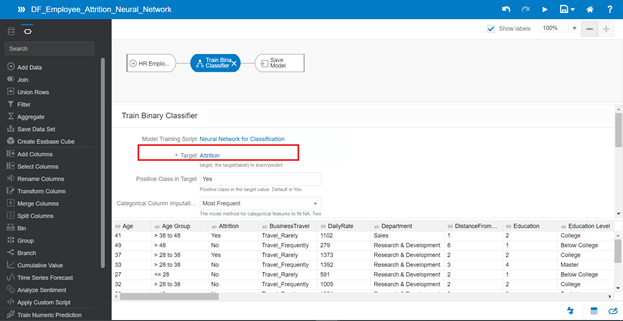
In the Target parameter, you still select Attrition in the dataset for prediction, also keep other parameters by default.
Save the model with the name DF_Employee_Attrition_Neural_Network and click Start to train the model.
Support Vector Machine
Continue creating a new data flow and use SVM for the Classification algorithm.
- Data Flow name: DF_Employee_Attrition_SVM
- Model Name: MD_Employee_Attrition_SVM
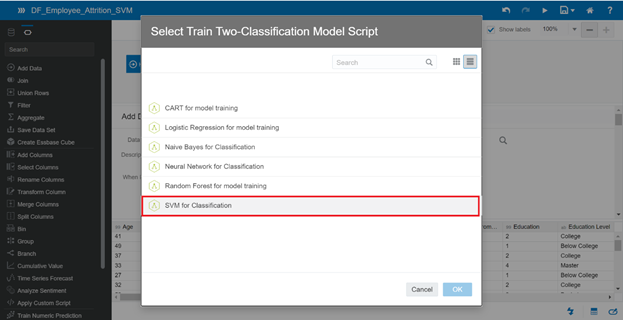
Save the model and click Start to train
How to Evaluate Prediction Models in Oracle?
You created three data flows and used three models within various algorithms for Employee Attrition prediction. Now, we want to evaluate which model is the best in this situation.
On the Home page of Oracle Analytics, click the top-left corner of the Navigator menu, and navigate to Data then switch to Data Flows. In the list, you can see three data flows created:
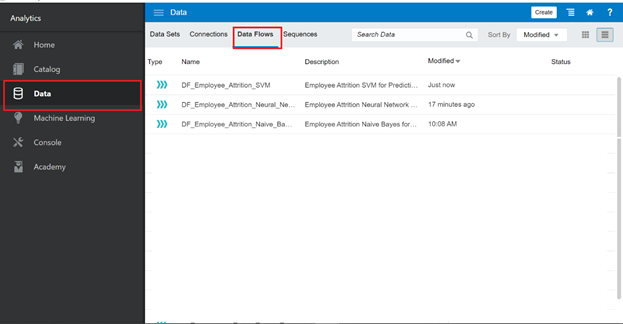
At the end of each data flow in the list, click the hamburger icon (Actions menu), and select Inspect menu
Naïve Bayes Classification Evaluation
Switch to Sources/Targets tab > Click MD_Employee_Attrition_Naive_Bayes in Targets
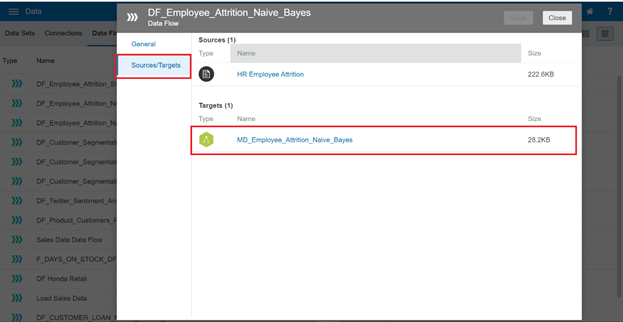
You have navigated to the detailed explanation for the Naïve Bayes Classification model. Switch to the Quality tab. The result provides a confusion matrix and key metrics that you can use to evaluate the quality of the model.
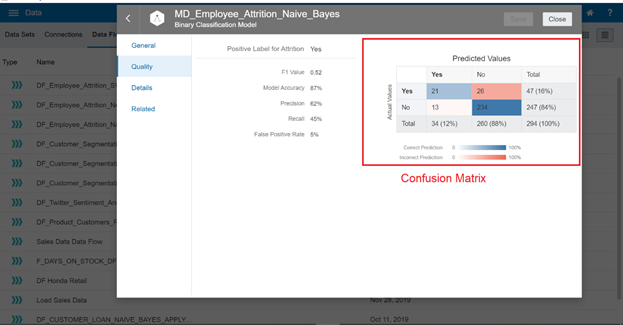
Model Accuracy: (21 + 234) / 294 = 86.73 % (~87%)
This metric defines how many correct predictions were made by this model.
Precision: 21 / (21+13) = 61.76% (~62%)
This metric defines percentage of truly positive predicted instances to total positive instances predicted. Precision is an important metric, but it does not mean that the model with the highest values of Precision is the best choice. As you see in the confusion matrix, the model predicted a total of 34 positive instances, but there were 34 actual positive instances.
Recall: 21 / (26+ 21) = 44.68% (~45%)
This metric is opposite to the Precision metric, it defines a percentage of truly positive actual instances to total positive actual instances. This value is the expectation from the training dataset. Similar to Precision, a model with a high Recall isn’t always the best choice.
False-positive rate: 13/ 247 = 5.26 % (~5%)
This metric defines the percentage of false-positive instances to total actual negative instances. If the metric value is low, it means the Precision value is high.
False-negative rate: 26/47 = 55.31% (~55%)
The metric defines the percentage of false-negative instances to total actual negative instances.
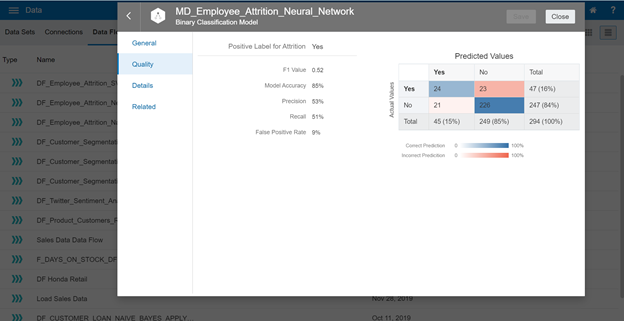
Neural Network Classification Evaluation
Continue opening the evaluation for this training model:
SVM Evaluation
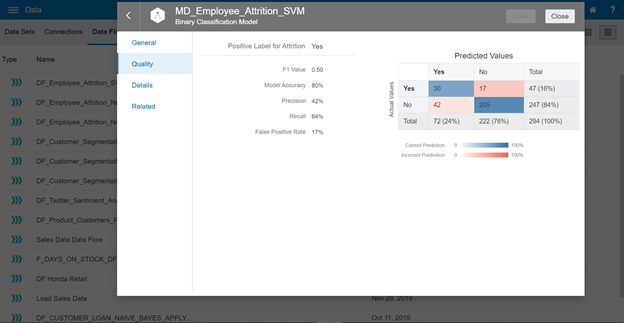
Continue opening the evaluation for this training model.
Prediction of Employee Attrition: Comparison table
From the evaluation, let’s create a comparison table
| Model | Accuracy Model | Precision | Recall | False Positive Rate | False Negative Rate |
| Naïve Bayes | 87% | 62% | 45% | 5% | 55% |
| Neural Network | 85% | 53% | 51% | 9% | 49% |
| SVM | 80% | 42% | 64% | 17% | 36% |
In the Employee Attrition problem, you need to know which model provides the highest rate for Attrition. You want a model to maximize Recall%. In other words, a model provides correct predictions of as many truly positive instances as possible. It means the Support Vector Machine model can be a good candidate to apply the ML to the Employee Attrition problem.
Conclusion
There is no perfect solution to any machine learning problem because it depends on a lot of factors:
- How much training data do you have? The more training data, the more chances to select the right model.
- How do you and your team understand the business problem before starting an ML project? This factor will affect your selection of attributes/variables for predictions.
You need to identify what type of problems should be solved with Supervised Learning or Unsupervised Learning. Then you train your dataset within different models and evaluate them to select the right one.
Tags: machine learning, oracle, oracle analytics Last modified: October 07, 2022


